October CPI 2026: Why There's No Yearly Inflation Rate This Time
October CPI lands Nov. 10 with no official yearly inflation rate. Why the 2025 shutdown erased it, what to read instead, and what it means for the Fed.
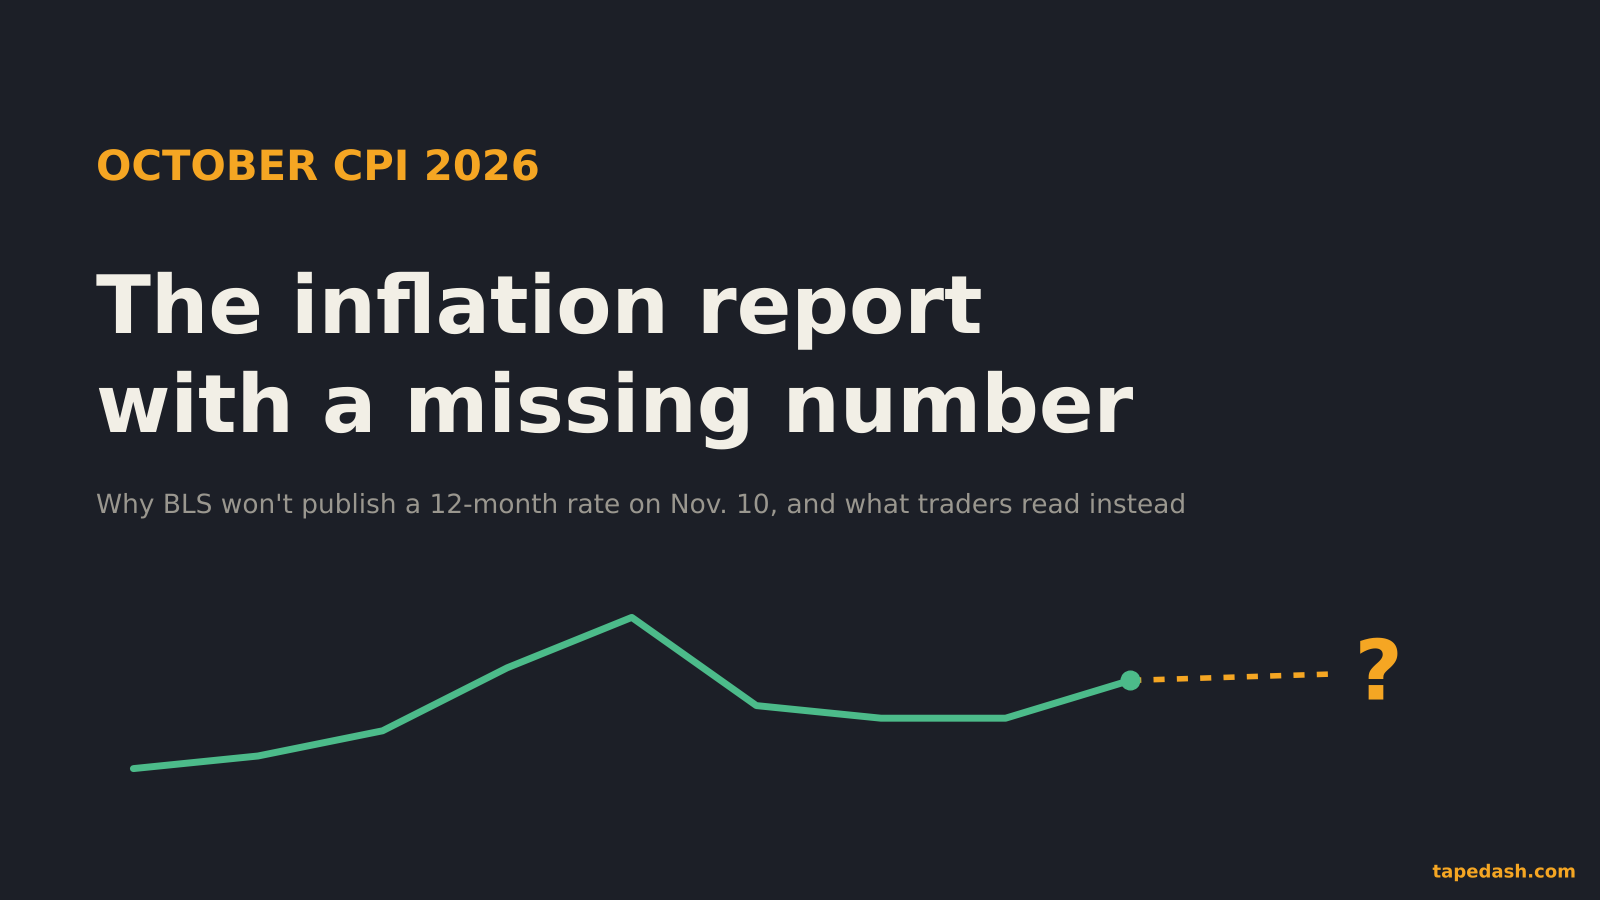
The October CPI report comes out Tuesday, Nov. 10, at 8:30 a.m. ET, and for the first time in a very long while it will not carry the number most people look for first. The Bureau of Labor Statistics will not publish a 12-month inflation rate for overall prices, core prices, food, energy or rent (BLS, Stock Titan).
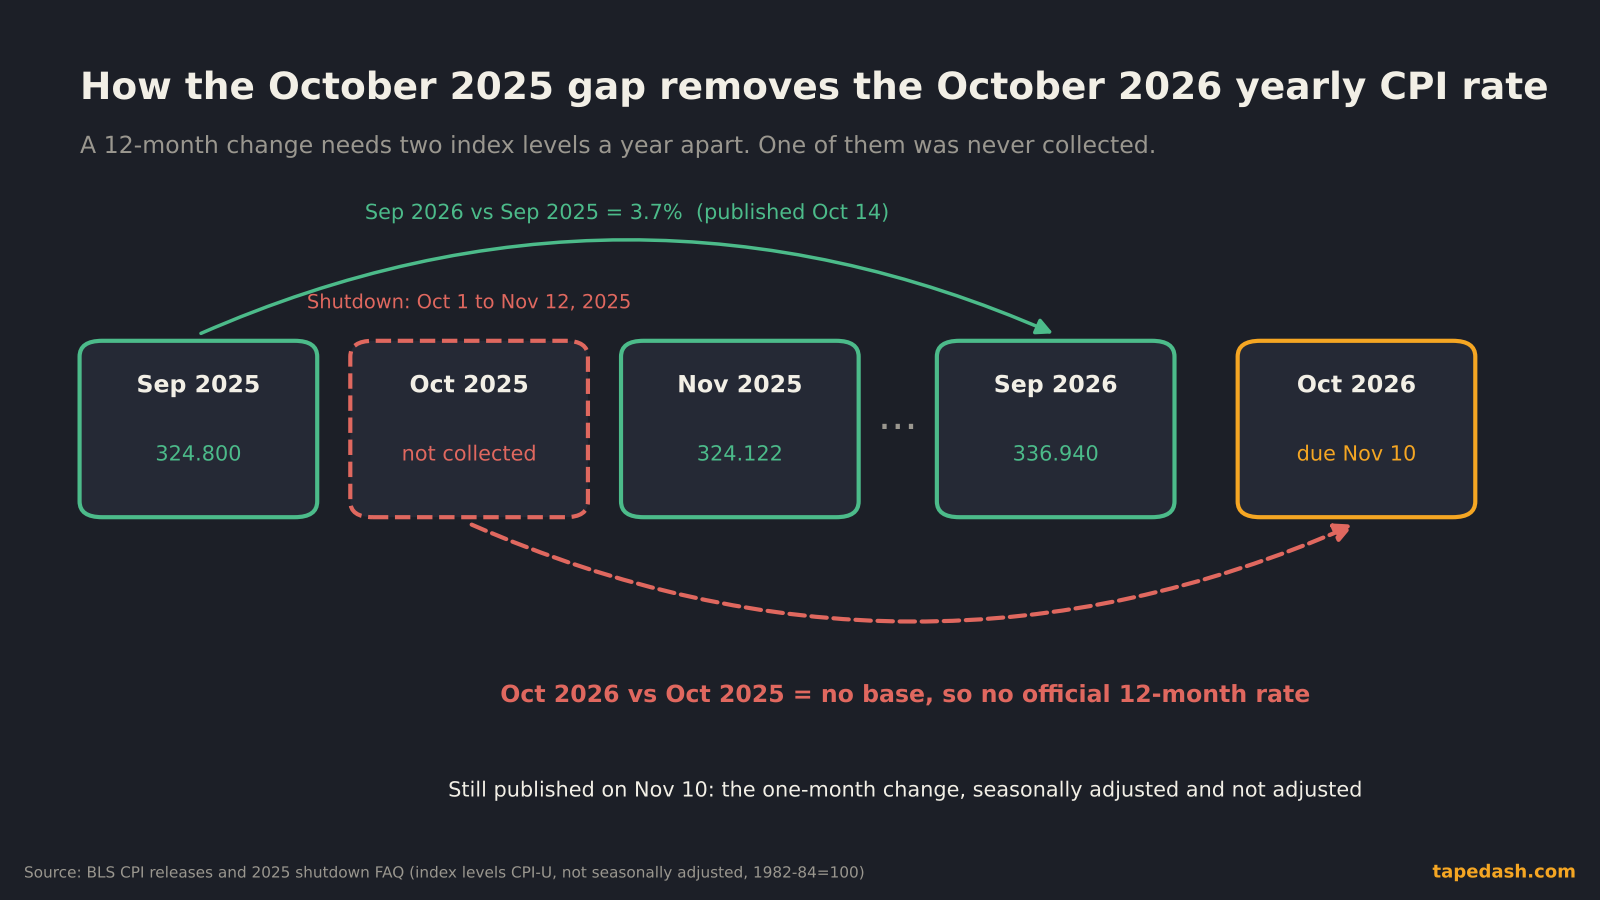
The reason is simple once you see it. A yearly inflation rate compares this October’s price index with last October’s. Last October, during the federal government shutdown that ran from Oct. 1 to Nov. 12, 2025, BLS could not collect prices at all, so there is no October 2025 index to compare against (BLS, BigGo Finance). No base, no 12-month change. What you will get is the one-month change from September to October, seasonally adjusted and not.
That sounds like a technicality. It isn’t, for one reason: this is the last CPI report the Federal Reserve sees before its Dec. 8-9 meeting, and markets are pricing roughly a three-in-four chance of a rate hike there (24/7 Wall St, BigGo Finance). The headline number that usually anchors the first ten seconds of trading is gone. Whatever replaces it in people’s heads will shape the reaction.
- The October 2026 CPI, due Nov. 10 at 8:30 a.m. ET, will have no official 12-month inflation rate for overall, core, food, energy or rent prices, because BLS collected no October 2025 data during the shutdown.
- The monthly change is the real number this time. Economists surveyed by Bloomberg expect 0.3% for headline and 0.2% for core, after 0.6% and 0.3% in September.
- Any “yearly” October figure you see on Tuesday is a stand-in someone calculated. Depending on the base, the same print can look like 3.7% or close to 4%.
- It is the last CPI before the Fed’s Dec. 8-9 meeting, with markets pricing about a 77% chance of a quarter-point hike. November CPI comes out Dec. 10, the day after the decision.
Why the October CPI report has no yearly inflation rate
Every CPI index level is built from prices that BLS staff collect during the reference month: rents from a housing panel, prices from stores and websites, service fees and so on. When appropriations lapsed on Oct. 1, 2025, that collection stopped. BLS says plainly that it could not collect October 2025 survey data, and it never issued an October 2025 CPI release (BLS).
To keep the series moving, BLS had to put something in October’s slot for internal purposes. It carried survey prices forward from September 2025, and it carried rents forward from April 2025, the last time that part of the housing panel had been priced. Then, when collection resumed in mid-November, it computed November’s change against those imputed October values. For rent and owners’ equivalent rent, it used the sixth root of the May-to-November change instead, spreading six months of rent growth evenly (BLS, BLS Monthly Labor Review).
The published October 2025 values show up as dashes. Because the agency never published a real October 2025 index for most series, it has said all along that it will not publish 12-month changes for October 2026 where that base is missing (BLS, Stock Titan).
Which CPI numbers still get a 12-month change
A handful of indexes are built entirely from non-survey data, and those were published for October 2025, so their yearly changes will appear as usual (BLS). Stock Titan’s review of the tables lists gasoline, new vehicles, and used cars and trucks among them (Stock Titan). So on Tuesday you may see a clean yearly figure for used cars and none at all for the CPI as a whole. If a headline says “inflation rose X% from a year ago” with no qualifier, check where X came from.
What the October 2026 CPI forecast actually says
Because there is no yearly rate to forecast, the Street is forecasting the monthly change, and that is where you should look too.
The Bloomberg survey median calls for headline CPI to rise 0.3% in October and core CPI, which strips out food and energy, to rise 0.2% (Bloomberg via Business Standard, BigGo Finance). The Cleveland Fed’s inflation nowcast, updated Nov. 6, sits a bit lower at 0.24% for headline and 0.21% for core (Cleveland Fed, Stock Titan).
Compare that with September. Headline CPI jumped 0.6% that month and core rose 0.3%, which pushed the yearly rate to 3.7% from 3.4% in August, with core at 2.6% (BLS, Stock Titan). The forecasts call for roughly half that headline pace in October.
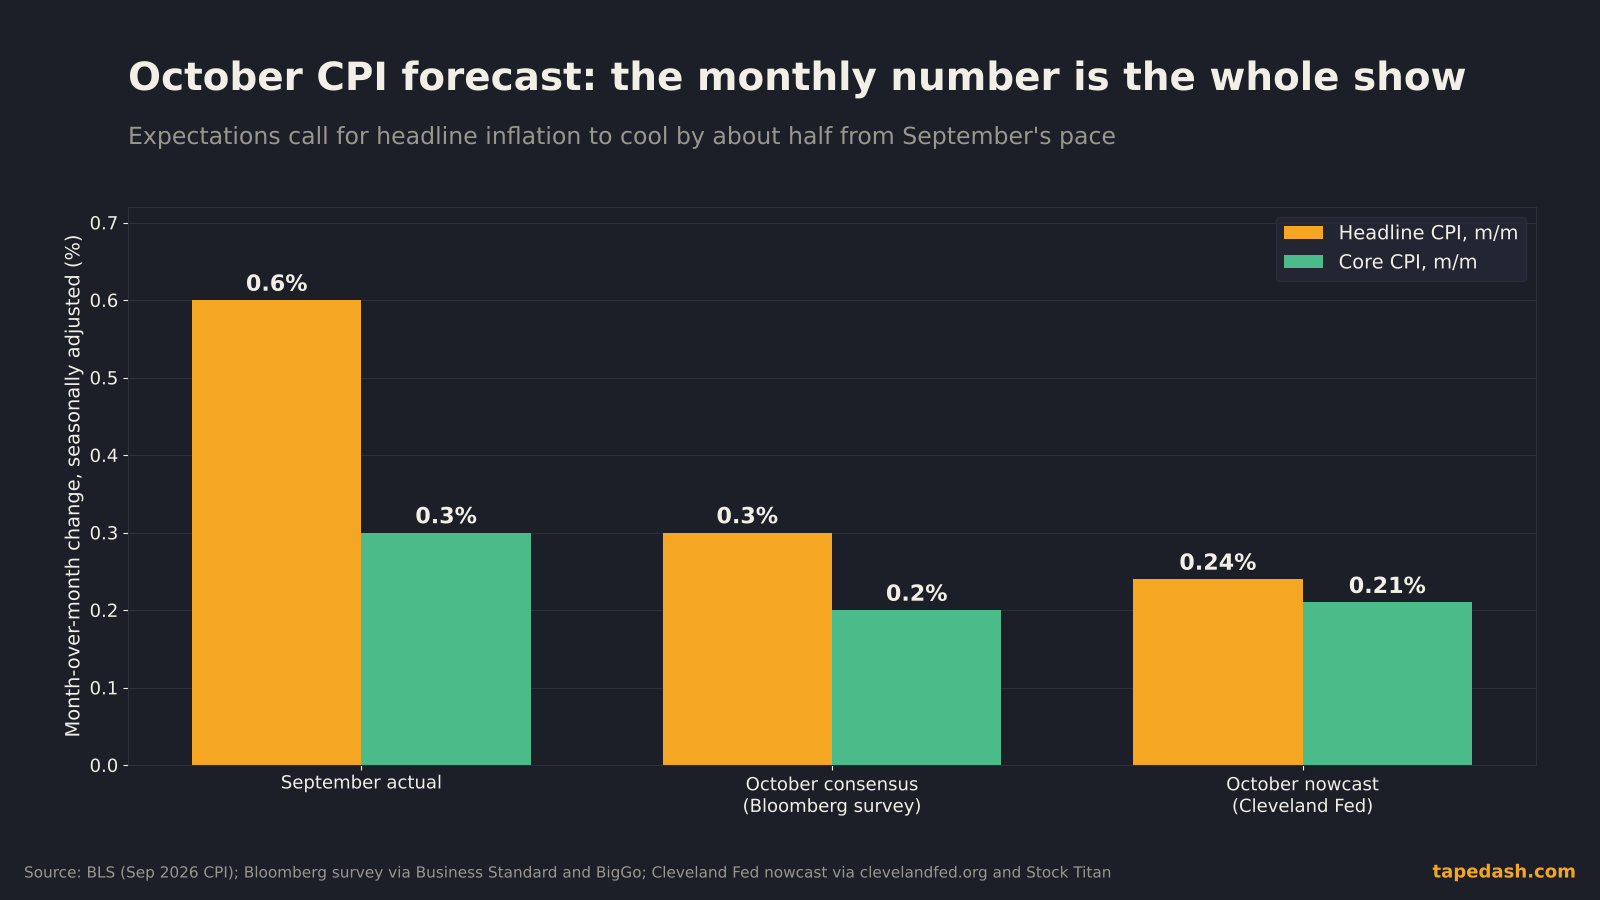
Bloomberg’s economists give the reasons behind the expected slowdown: smaller increases in used cars and consumer electronics, and a pullback in owners’ equivalent rent after a September jump. Citigroup’s economists expect only limited pass-through from high energy costs into other goods (Bloomberg via Business Standard). I’d treat that as the base case with one caveat. Forecasts for a 0.2% core print have a habit of being right on average and wrong on the day, and a 0.1 point miss on core is the difference between “September was noise” and “September was the start of something.”
How to estimate a yearly inflation rate without October 2025
You will see yearly figures for October on Tuesday anyway. Analysts, nowcasters and headline writers will build them, because people want one number. Each one depends on a choice about what to use as last October’s index, and that choice moves the answer more than most people would guess.
Here are the official index levels around the gap, all from the unadjusted CPI-U series. September 2025 was 324.800. November 2025 was 324.122. September 2026 was 336.940 (BLS September 2026 release, BLS December 2025 release, Stock Titan). Note the quirk: November 2025 sits slightly below September 2025, and that small difference is exactly why the choice of base matters.
There are three reasonable stand-ins for October 2025:
| Stand-in for October 2025 | Index level used | Implied “yearly” rate if October 2026 is flat (unadjusted) | What it assumes |
|---|---|---|---|
| September 2025 level | 324.800 | about 3.7% | Prices did not move in October 2025 |
| Midpoint of Sep. and Nov. 2025 (geometric mean) | about 324.46 | about 3.8% | October sat halfway between its neighbors |
| November 2025 level | 324.122 | about 4.0% | All of the Sep.-to-Nov. drift happened in October |
The middle row is the one I’d anchor to, for a practical reason: it is the same approximation BLS itself used for October 2025 when it ran seasonal adjustment (BLS). Stock Titan used a simple average of the two months and got the same answer, about 3.8% for headline and about 2.6% for core if October 2026 is unchanged (Stock Titan). Our own math on the BLS index levels lands in the same place. The Cleveland Fed’s nowcast, which uses its own method, puts the yearly figure at 3.74% (Cleveland Fed, Stock Titan).
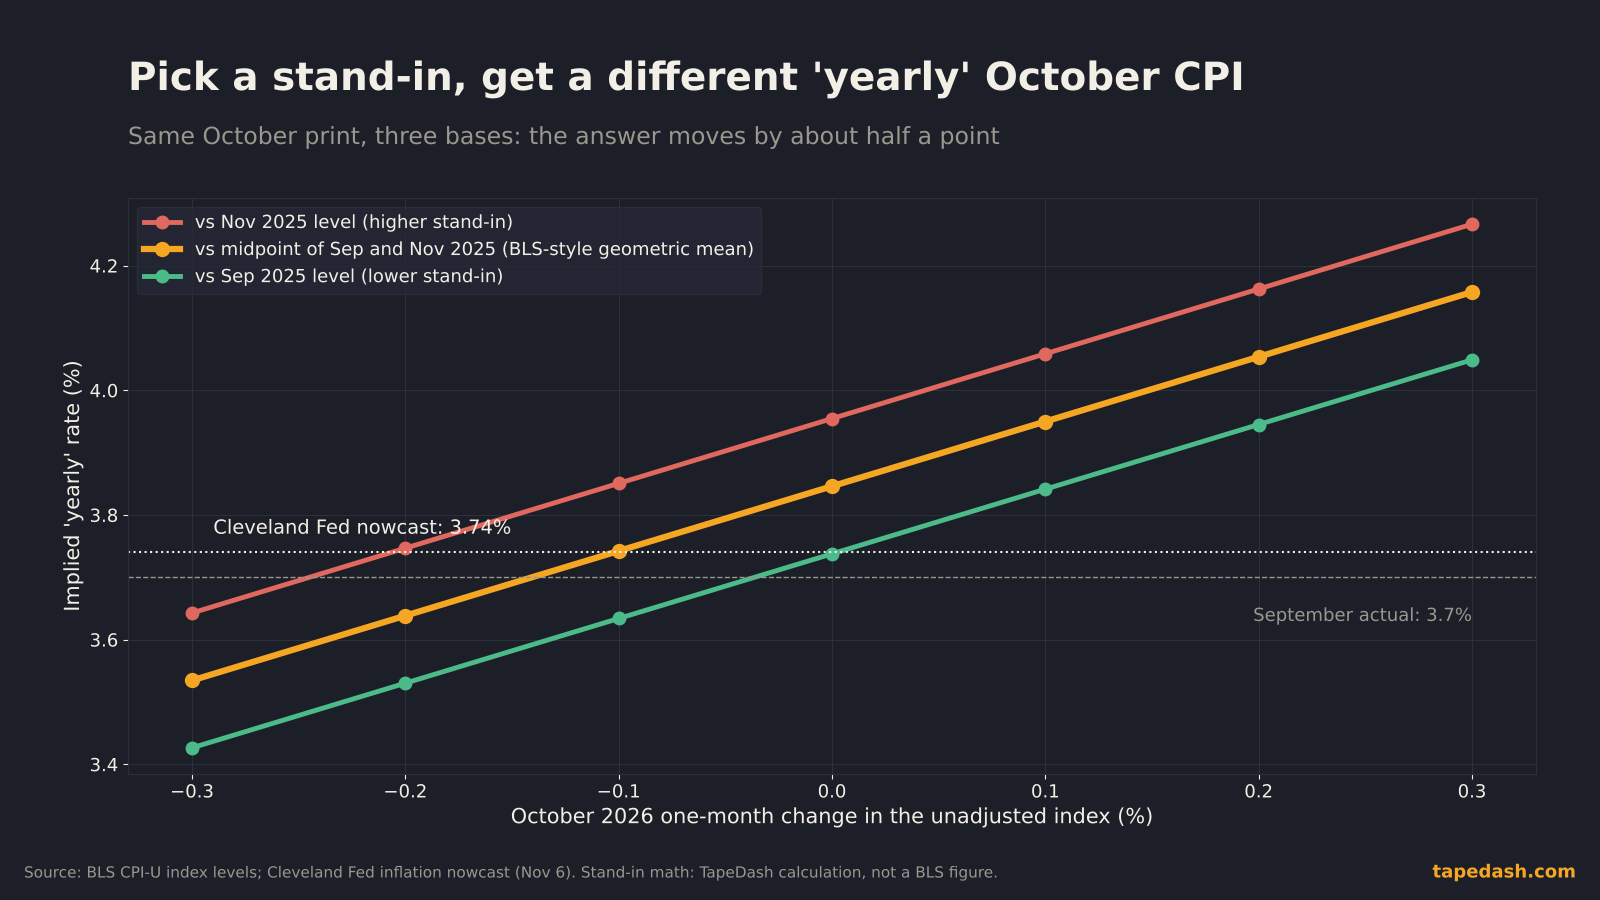
Two practical points come out of the chart. First, a “yearly” October number near 4% is not automatically hotter than one near 3.7%. It may just be built off the November base. Second, these stand-ins run on the unadjusted index, while the 0.3% consensus is a seasonally adjusted number, so the two are not interchangeable. If you see a stand-in yearly rate, ask which base and which monthly change went into it before you compare it with September’s 3.7%.
How to read the October CPI report on Tuesday
When I sit down for a CPI release, I have a short checklist. This month I’m reordering it because the usual first line is missing.
1. Core CPI, month over month, to two decimals. The rounded figure hides a lot. A 0.24% that rounds down to 0.2% and a 0.16% that rounds up to 0.2% send different messages. The unrounded figure comes from the index levels in the release tables, and that is the number rates traders will work from.
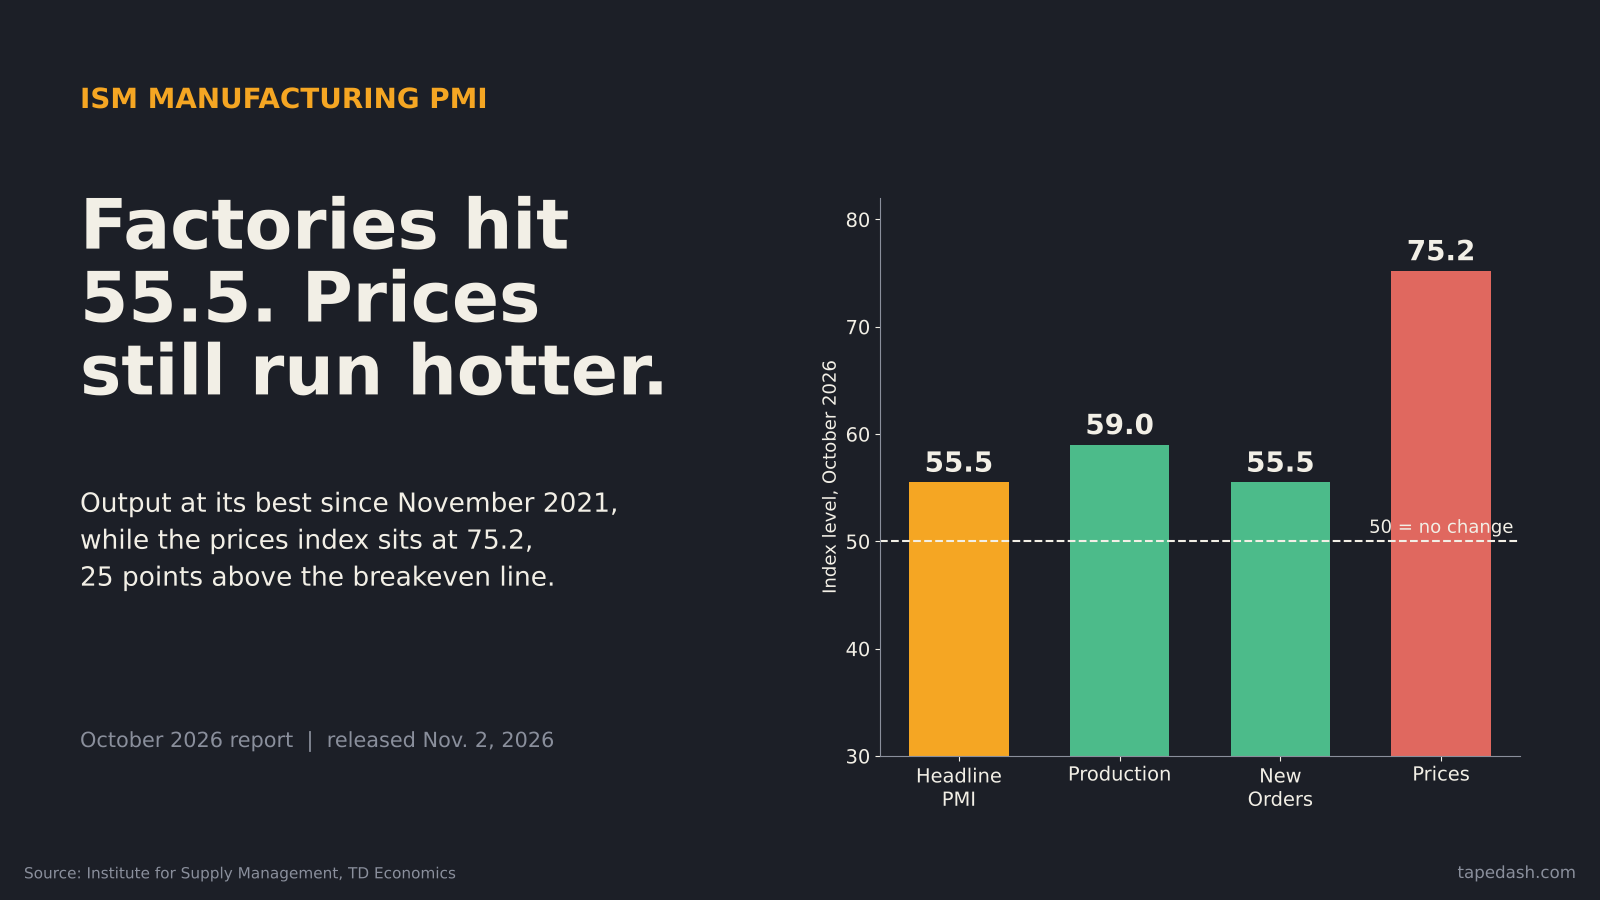
2. Headline versus core gap. In September, headline ran double core because of energy. If headline comes in at or below core in October, energy has stopped adding to inflation for the month. That matters for the Fed’s story, which is that it is hiking to keep an energy shock from spreading.
3. Shelter and owners’ equivalent rent. Shelter is the biggest piece of core. Bloomberg’s economists expect a smaller owners’ equivalent rent gain after September’s jump. If it doesn’t cool, the 0.2% core call is in trouble.
4. Core goods: used cars, apparel, household goods. This is where energy and transport costs leak into prices that are supposed to be “core.” It is also the category where a few forecasters pointed to softening.
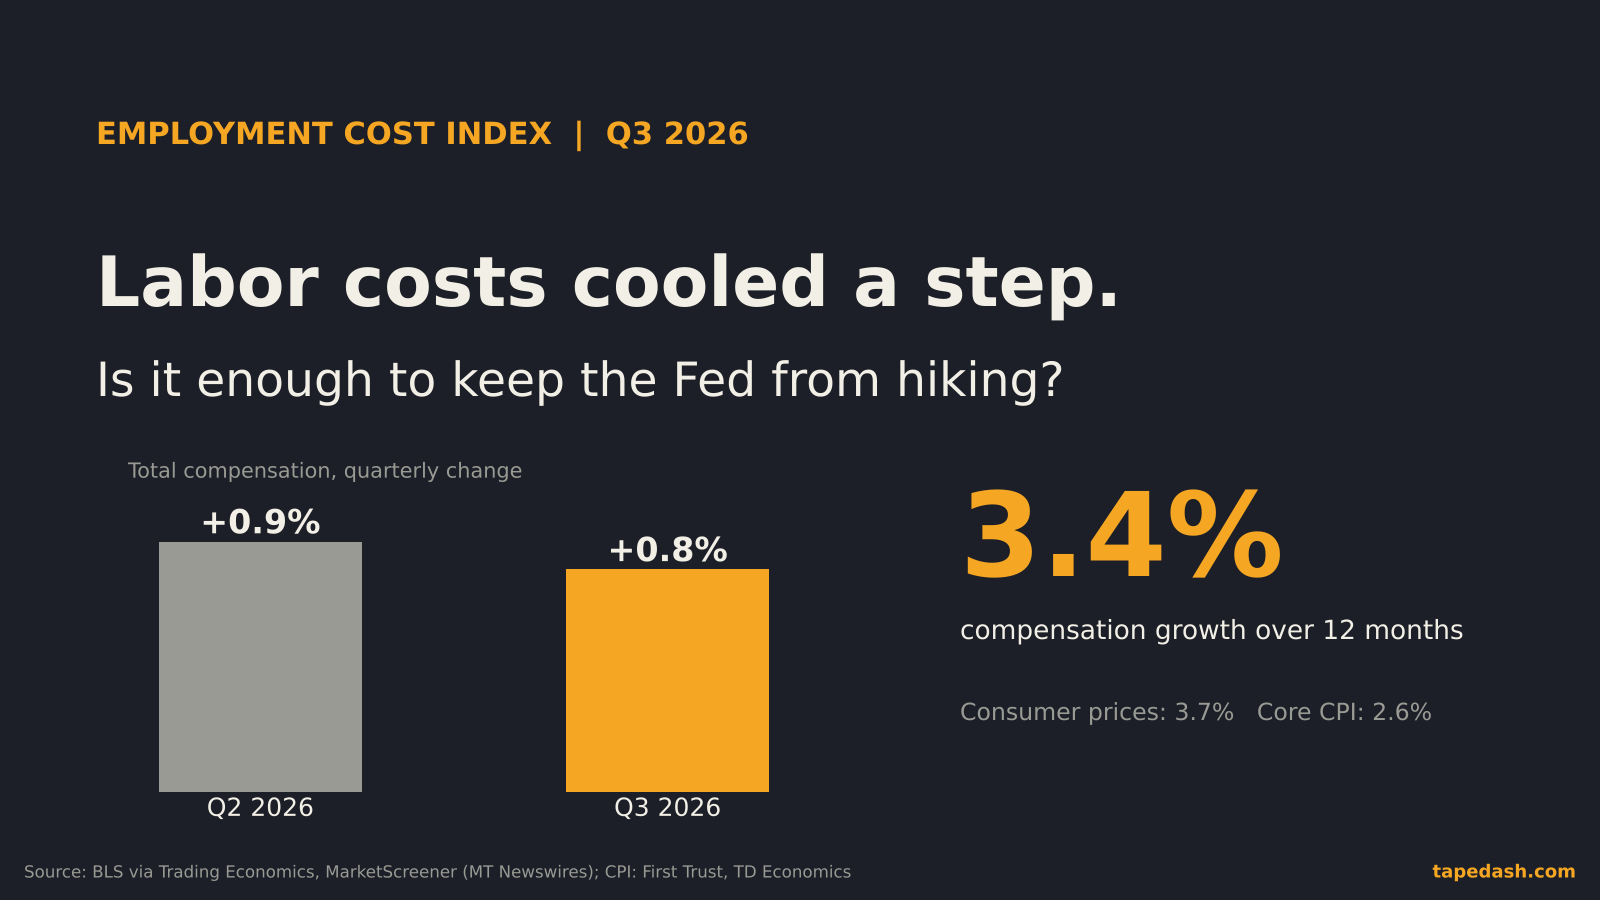
5. Services excluding shelter. People call it supercore. It moves with wages, and wages are running hot enough to matter: average hourly earnings rose 0.4% in October and 3.1% from a year earlier (24/7 Wall St, The Rio Times).
6. The market’s reaction, not the headline. Watch the 2-year Treasury yield and fed funds futures in the first fifteen minutes. If the futures move hard on a print that matches consensus, the move is about positioning, not the data. I wrote more about reading those futures in How to Read CME FedWatch and Fed Funds Futures, and the standard walk-through of the release itself is in How to Read the CPI Report.
A note on the wage number above. Pay up 3.1% from a year earlier, set against prices up 3.7% in the year to September, means paychecks are not keeping up with prices. It is one reason a hot CPI hurts consumer stocks twice: through rates and through spending power.
What October CPI means for a December Fed rate hike
The setup matters here. The Fed raised its target range by a quarter point to 3.75% to 4% on Sept. 16, its first hike in more than three years (Business Standard, StockAnalysis). On Oct. 28 it held, by a 10-2 vote, with Governor Lisa Cook and Cleveland Fed President Beth Hammack dissenting in favor of another hike (Nation Thailand, StockAnalysis).
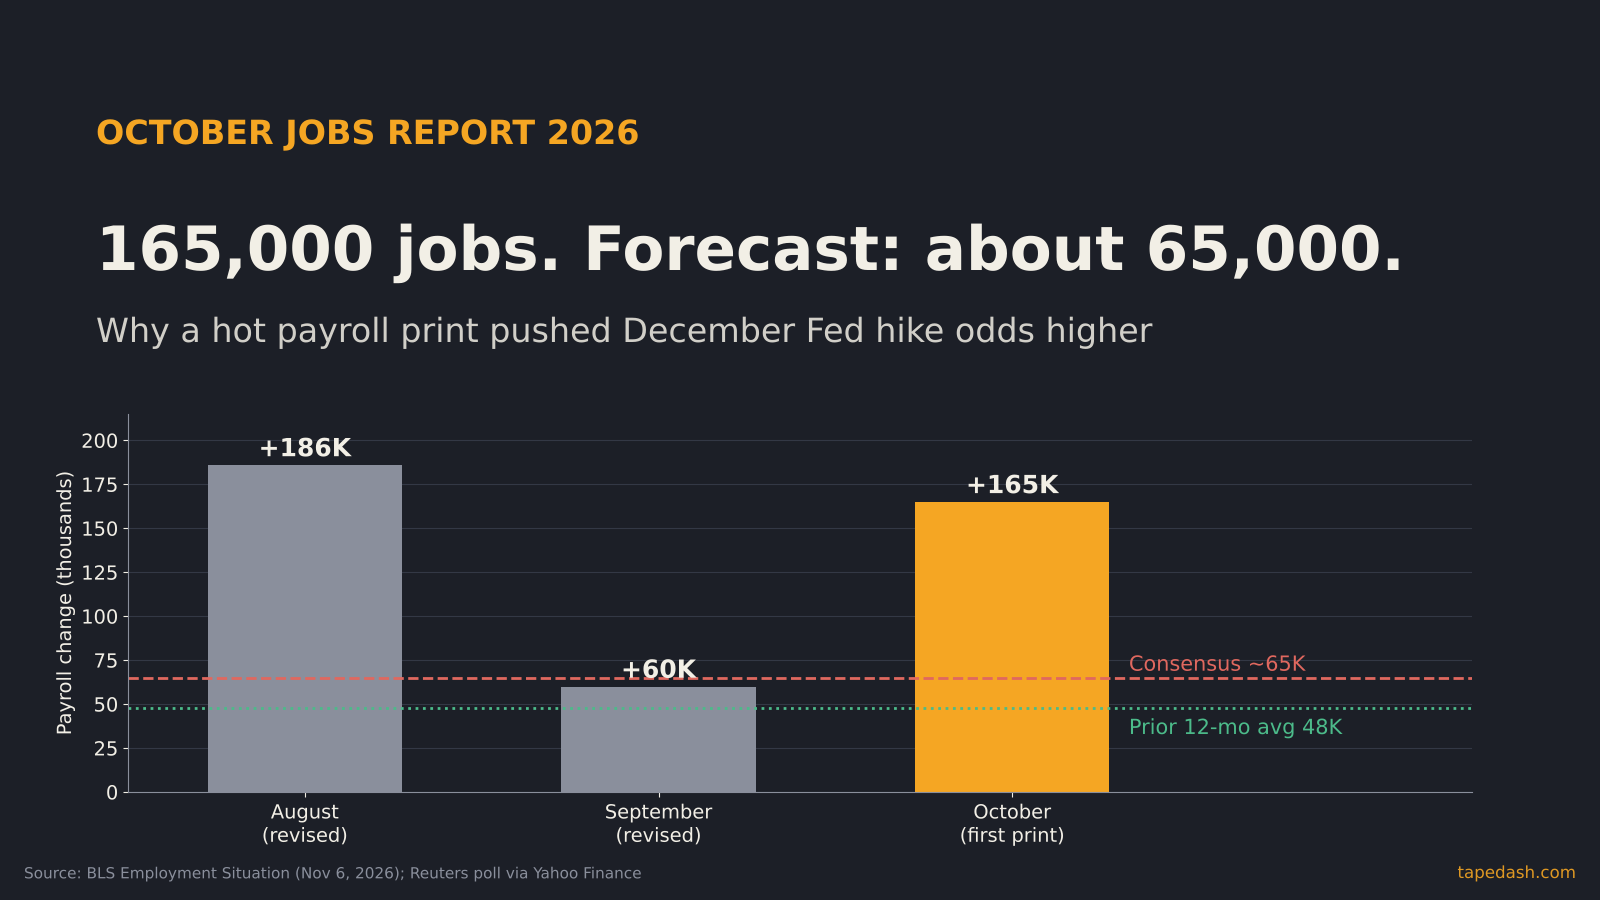
Then the October jobs report on Friday showed payrolls up 165,000, with the unemployment rate at 4.1% (24/7 Wall St, The Rio Times). After that, market pricing for a December hike rose to about 77% (24/7 Wall St, BigGo Finance). Our breakdown of that report is in October Jobs Report 2026: Why 165,000 Jobs Raised Fed Hike Odds.
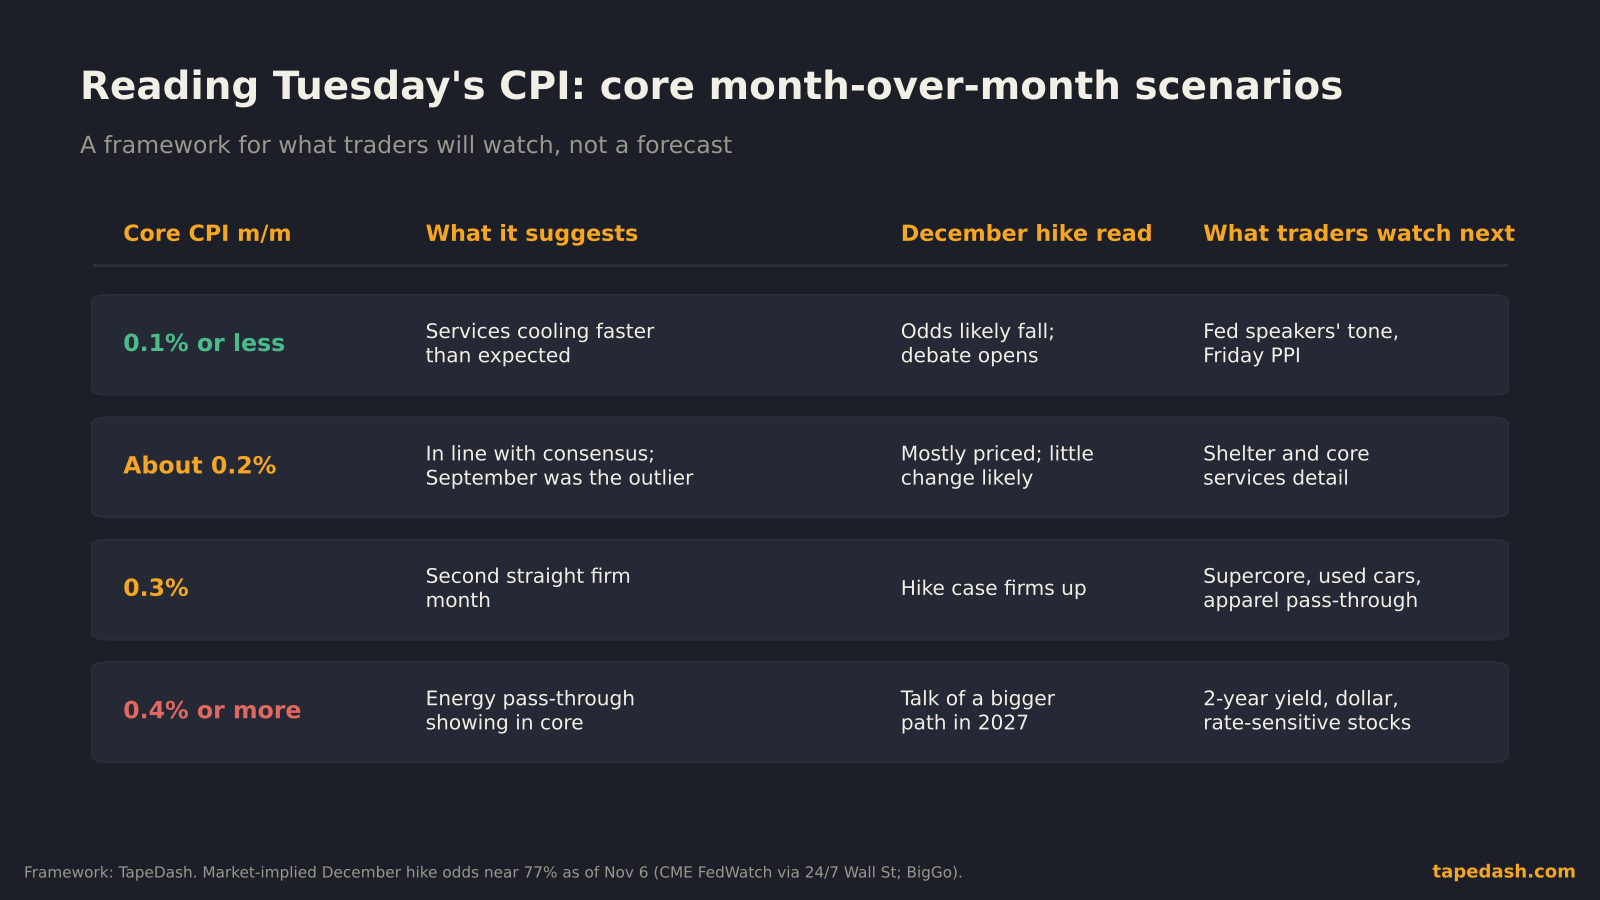
So the market has largely made up its mind, and CPI’s job on Tuesday is to confirm or shake that view. A soft core print would not make the Fed skip on its own. It would give the officials who are uneasy about hiking again something concrete to point to. A firm core print, 0.3% or more, would push the conversation from “one more” to “how many more in 2027.”
Why the missing yearly rate could matter for the Fed’s messaging
Policymakers will not be confused by the gap. They have the monthly data and their own staff estimates. The communication problem is different. Fed speeches and statements lean on the yearly rate because the public understands it. For a few weeks, officials will have to talk in monthly and three-month annualized terms, or cite their own stand-in. Watch which numbers the speakers on Tuesday’s calendar choose. Fed Governor Christopher Waller is among those scheduled to speak after the release (Six Sigma Research, BigGo Finance). If he describes inflation with a three-month annualized core rate, that tells you what the committee is actually watching.
Does the shutdown gap understate inflation?
It’s a fair question, and BLS addressed it directly. The agency notes that carrying prices forward tends to bias things one way when prices are broadly rising: “the carry-forward method may result in an underestimation,” in its words (BLS). In a period of falling prices, it would do the opposite.
The bigger effect was in housing. Because October 2025 rents were held at April 2025 levels and November used a smoothed six-month change, BLS warned that the one-month rent change for April 2026 would be atypical, when the same housing panel was priced again and the series caught up (BLS, BLS Monthly Labor Review). BLS chose not to use forecasts or models to fill the gap. Its explanation centers on avoiding judgment calls that had not been vetted, and on the public-comment process any method change would need.
Here is the part I’d keep an eye on next month. November 2026’s yearly rates will be published normally, because a November 2025 index exists. But that November 2025 base was built on top of the imputed October. If the base came out a little low in some housing series, November 2026’s yearly rate in those series could look a little high for reasons that have nothing to do with current inflation. I wouldn’t put a number on that before the data is out. I would read the November yearly shelter figure with that in mind before calling it a reacceleration.
What to watch next: CPI, PPI and the December Fed meeting
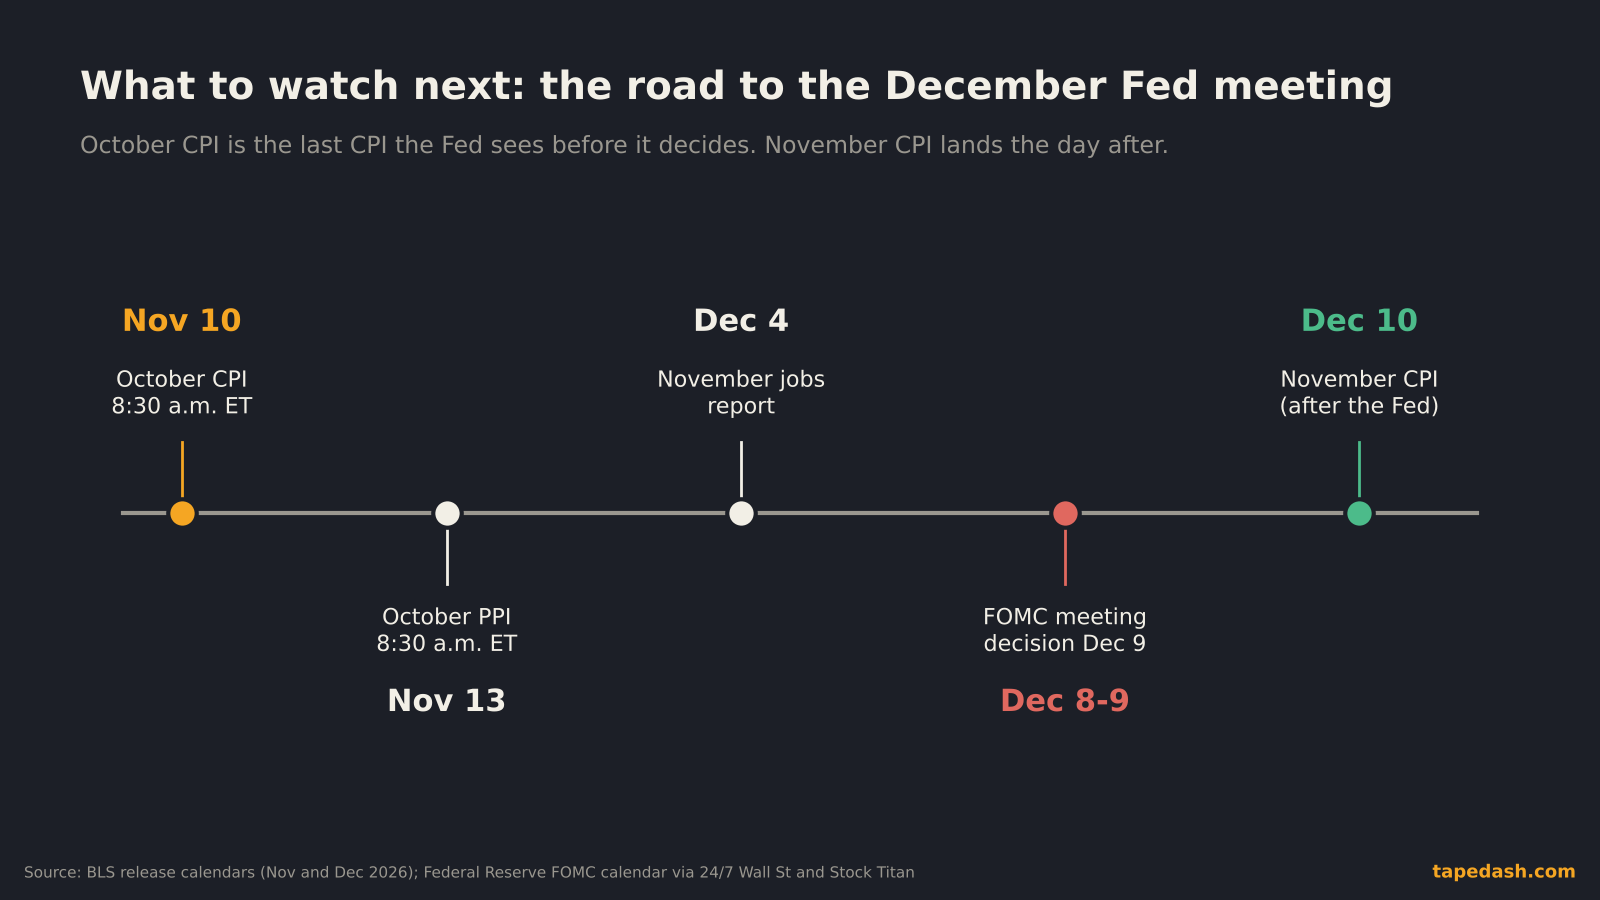
Tuesday, Nov. 10, 8:30 a.m. ET: October CPI and Real Earnings. The main event, released alongside the real earnings report (BLS, Stock Titan). Expect the monthly figures front and center and a footnote where the yearly rates normally sit.
Friday, Nov. 13, 8:30 a.m. ET: October PPI. The producer price index is next (BLS, Six Sigma Research). Producer prices are expected to show a 6.6% rise from a year earlier, which would be the steepest in nearly four years (Bloomberg via Business Standard, BigGo Finance). Parts of PPI feed into the Fed’s preferred PCE inflation gauge, so Friday’s report will refine whatever picture CPI paints on Tuesday.
Friday, Dec. 4: November jobs report. The last big data point before the meeting (BLS, 24/7 Wall St).
Dec. 8-9: FOMC meeting. The decision comes on Dec. 9 (24/7 Wall St, Stock Titan). A quarter-point hike would take the target range to 4% to 4.25%.
Thursday, Dec. 10: November CPI. It comes out the morning after the Fed decides (BLS, CalendarX). Yearly rates return with it, along with the housing caveat above.
How we’re tracking the October CPI on TapeDash
If you want to watch whether Tuesday’s print changes the December story, what matters is how money moves after the number. In the TapeDash Terminal we line up rates, sector rotation and options flow on one screen. On a CPI morning I watch three things in the first half hour: the 2-year yield, flow in rate-sensitive groups like homebuilders, regional banks and small caps, and whether index put buying expands or fades. When those three agree, the move usually holds. When they disagree, the first reaction is often wrong.
The Live Scanner flags unusual options activity as it prints, which is useful the day before a release, when positioning tends to show up in short-dated contracts. And if you’d rather get the read without staring at screens, the free TapeDash Daily covers the CPI reaction and what changed for the Fed in one email. We’re also opening Pro to a founding group: the first 200 members lock Pro at $69.99 a month on their account, even if they cancel and come back later.
FAQ: October 2026 CPI report
When is the October 2026 CPI report released?
Tuesday, Nov. 10, 2026, at 8:30 a.m. Eastern time, from the Bureau of Labor Statistics. It is the last CPI report before the Fed’s Dec. 8-9 meeting.
Why is there no yearly inflation rate in the October 2026 CPI?
BLS could not collect prices in October 2025 because of the federal government shutdown that ran from Oct. 1 to Nov. 12, 2025. Without an October 2025 index, there is nothing to compare October 2026 against, so BLS will not publish 12-month changes for most series. A few indexes built from non-survey data, such as gasoline, still get one.
What is the inflation rate right now?
The latest official yearly rate is 3.7% for September 2026, with core at 2.6%. For October, the official numbers will be the monthly changes, where economists expect 0.3% headline and 0.2% core. Estimates of a yearly October rate that use a stand-in base land between about 3.7% and 4%, depending on the method.
The one thing to remember
On Tuesday the yearly CPI number will be missing, so the monthly core figure carries the whole report. If core comes in near 0.2%, September looks like a spike and the December hike stays a close call that leans yes. If it prints 0.3% or higher, the Fed has its second firm month in a row and the debate moves on to 2027. And any “yearly” October figure you see is somebody’s estimate. Check the base before you compare it with anything.
See it on the tape, not just in the headlines
TapeDash is the research desk for traders and investors: live options flow, dealer positioning, a real-time market scanner and trade alerts graded in public. Memberships open Black Friday, November 27, and the first 200 members lock Pro at $69.99 a month on their account, even if they cancel and come back later.
Join the waitlistClick through the terminalSee the track recordSources
- BLS: 2025 federal government shutdown impact on the CPI, frequently asked questions
- BLS: Consumer Price Index, September 2026 (Oct 14, 2026)
- BLS: Consumer Price Index, December 2025 (archived release with November 2025 index levels)
- BLS: Release calendar, November 2026
- BLS: Release calendar, December 2026
- BLS Monthly Labor Review: Counterfactual imputation approaches for the housing component of the October 2025 CPI
- Federal Reserve Bank of Cleveland: Inflation Nowcasting (updated Nov 6, 2026)
- Stock Titan: Next CPI report on November 10 will have no yearly inflation rate for overall prices (Nov 6, 2026)
- Bloomberg via Business Standard: US inflation set to cool in October after two months of sharp increases (Nov 8, 2026)
- BigGo Finance: US October CPI expected up 0.3% month-on-month (Nov 2026)
- 24/7 Wall St: Odds of a December rate hike jump to 77% after a blowout jobs report (Nov 7, 2026)
- The Rio Times: Fed hike odds rise to 77% after jobs report (Nov 6, 2026)
- Nation Thailand: US Fed holds rates at 3.75% to 4% after October 28 vote (Oct 29, 2026)
- StockAnalysis: Fed holds rates steady at 3.75% to 4.00% in a 10-2 vote (Oct 28, 2026)
- Business Standard: US Fed raises key overnight interest rate by 25 bps to 3.75-4% range (Sep 16, 2026)
- StockAnalysis: Fed returns to rate hikes after 3-year pause (Sep 16, 2026)
- Six Sigma Research: Preview of the week ahead, W/C November 9, 2026 (Nov 7, 2026)
- Trading Economics: United States inflation rate
- CalendarX: Consumer Price Index, November 2026 release
This article is for educational and informational purposes only. It is not financial, investment, medical or legal advice, and it is not a recommendation to buy or sell any security. Figures come from the sources listed and were checked on the date of publication; markets change quickly. Options trading involves substantial risk of loss.