October Jobs Report 2026: Why 165,000 Jobs Raised Fed Hike Odds
The October jobs report showed 165,000 new jobs, far above forecasts. What drove it, why December Fed hike odds rose, and what traders watch next.
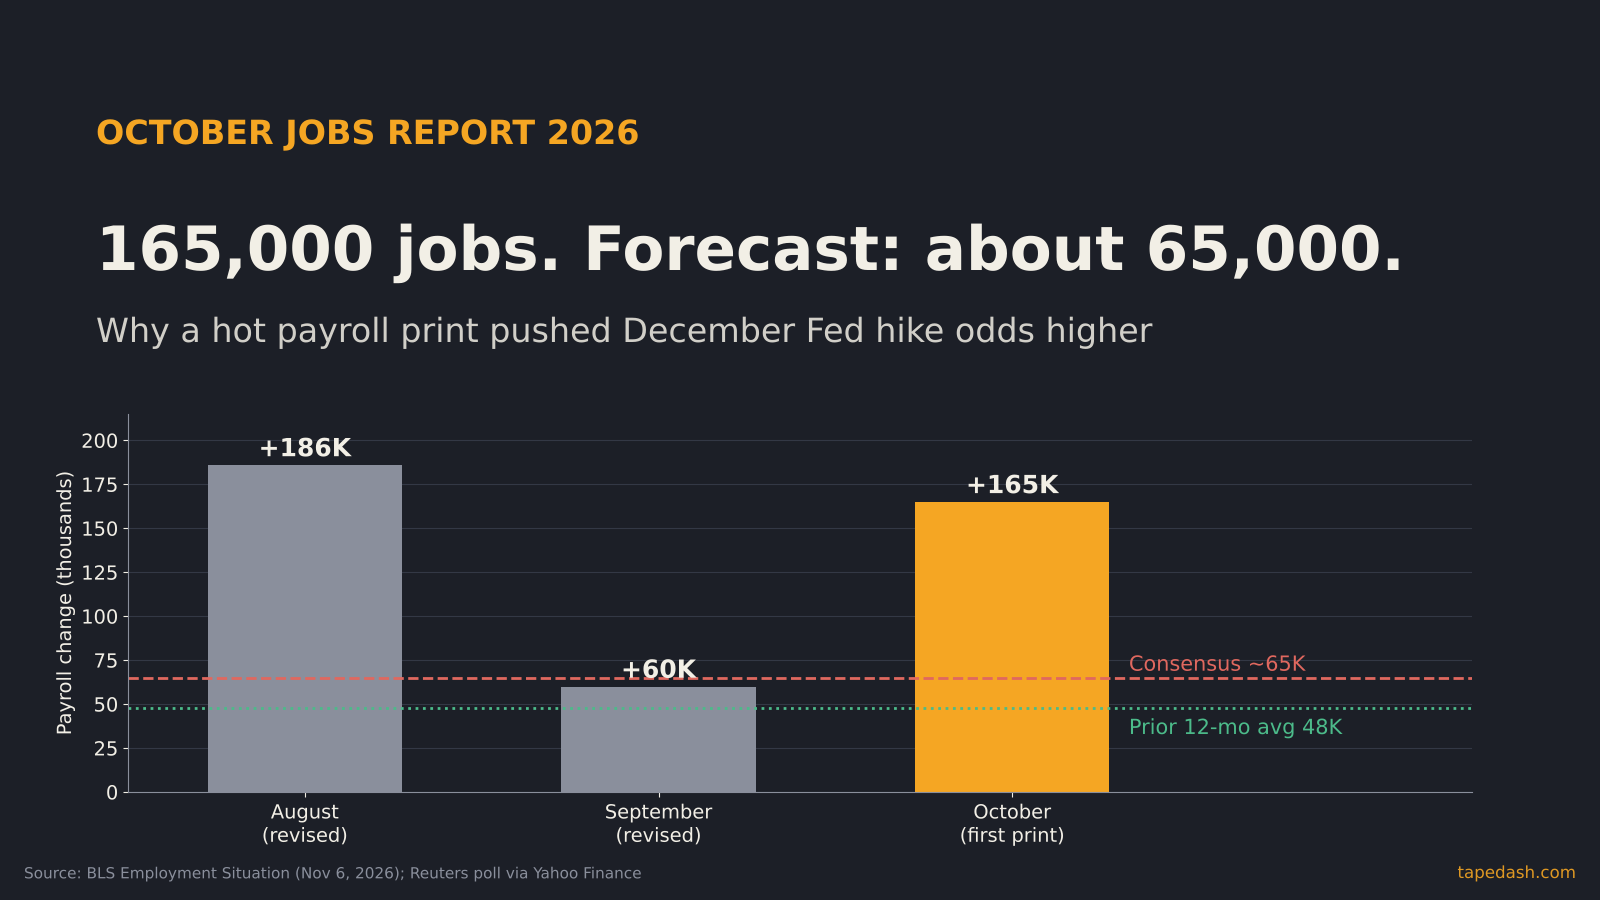
The October jobs report came out Friday morning and it was not close. Employers added 165,000 jobs, according to the Bureau of Labor Statistics, against a Reuters consensus of about 65,000 (Yahoo Finance, GV Wire). The unemployment rate slipped to 4.1% from 4.2%. Revisions added another 84,000 jobs to August and September. Average hourly earnings rose 0.4% in a single month.
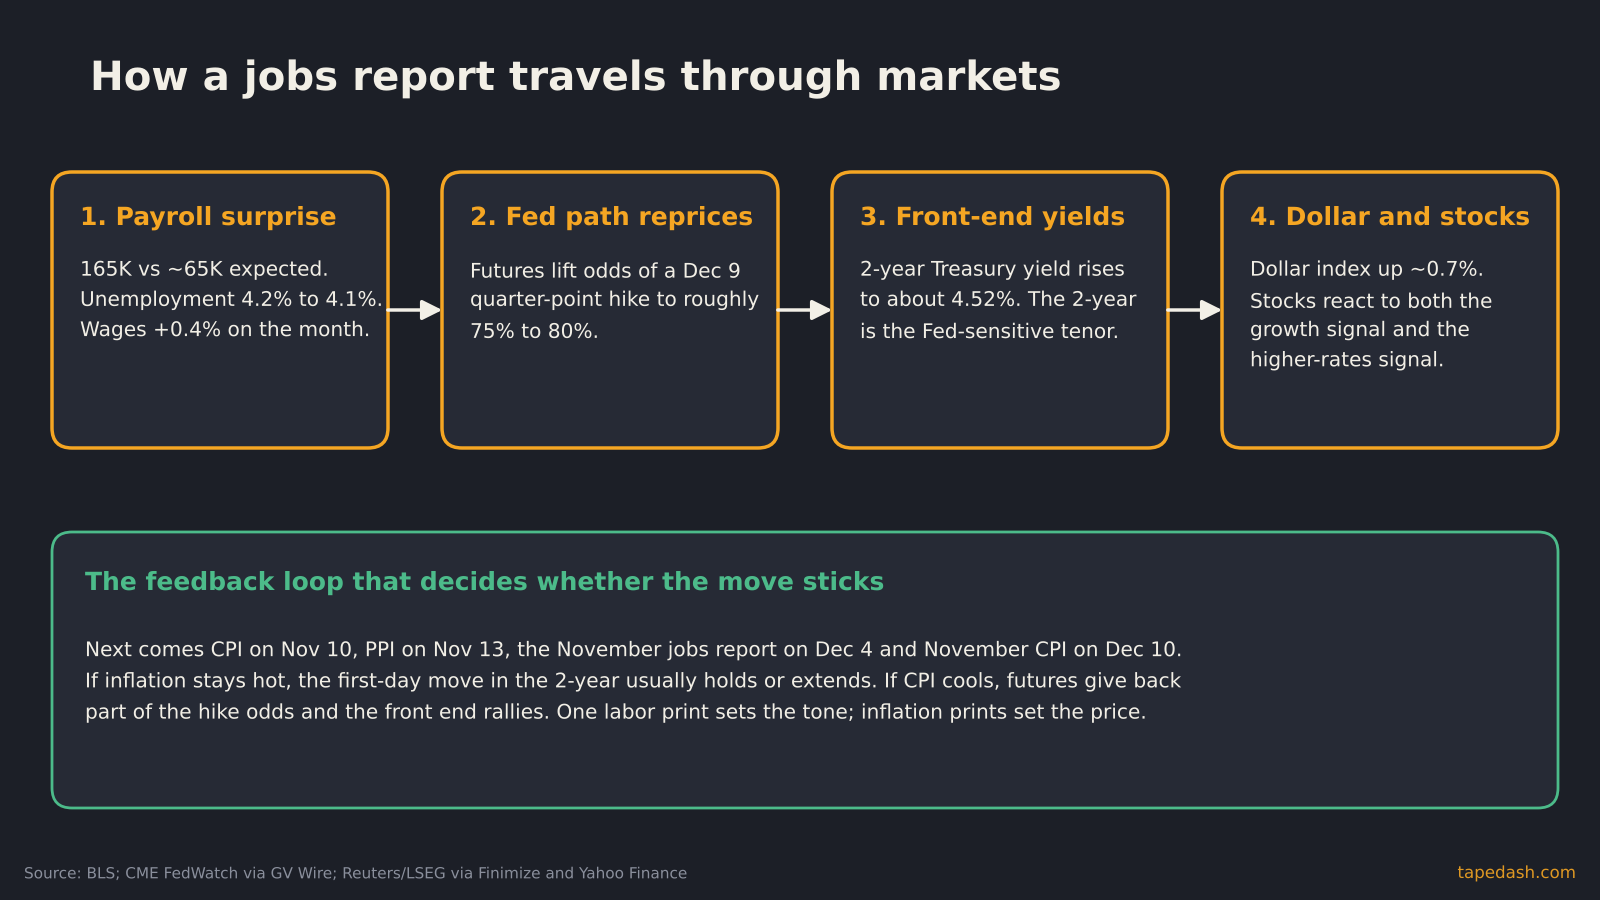
For anyone holding rate-sensitive assets, the important part came a few minutes later. Fed funds futures moved to price roughly a 75% to 80% chance that the Fed raises rates by a quarter point at its December 8 to 9 meeting, up from the high 60s to about 70% before the release, per CME FedWatch data cited by GV Wire and Reuters data cited by Yahoo Finance and Finimize. The 2-year Treasury yield rose to about 4.52%.
So the short answer to the question people are typing into search bars tonight: a strong October jobs report raised Fed hike odds because the Fed is fighting inflation that sits well above target, and a labor market this firm removes the main reason it had to wait. The rest of this piece is about what was inside the report, what the market heard, and which prints over the next five weeks decide whether December’s hike happens.
- Payrolls rose 165,000 in October, more than double the roughly 59,000 to 65,000 economists expected, and August plus September were revised up by 84,000.
- Unemployment fell to 4.1% and monthly wage growth hit 0.4%, but wages are still up only 3.1% over a year, below September’s 3.7% CPI inflation rate.
- Futures now lean toward a December hike from the current 3.75% to 4.00% range, and the 2-year yield climbed to about 4.52%.
- The October CPI on Nov. 10 will not include a yearly headline rate because of the 2025 shutdown, so traders will read the monthly change instead.
- The deciding data come next: CPI Nov. 10, PPI Nov. 13, the November jobs report Dec. 4 and November CPI Dec. 10, the day after the Fed decides.
October jobs report 2026: the numbers that mattered
Start with the headline because it set the tone for everything else. A print of 165,000 does not sound like much by the standards of 2021 or 2022, but context is the whole game with payrolls. BLS noted that the prior 12 months had averaged only 48,000 jobs a month (BLS, StockTitan). October was more than three times that pace, and it landed far above forecasts that clustered between the Dow Jones survey’s 59,000 (Kiplinger, WSAW) and Reuters’ 65,000.
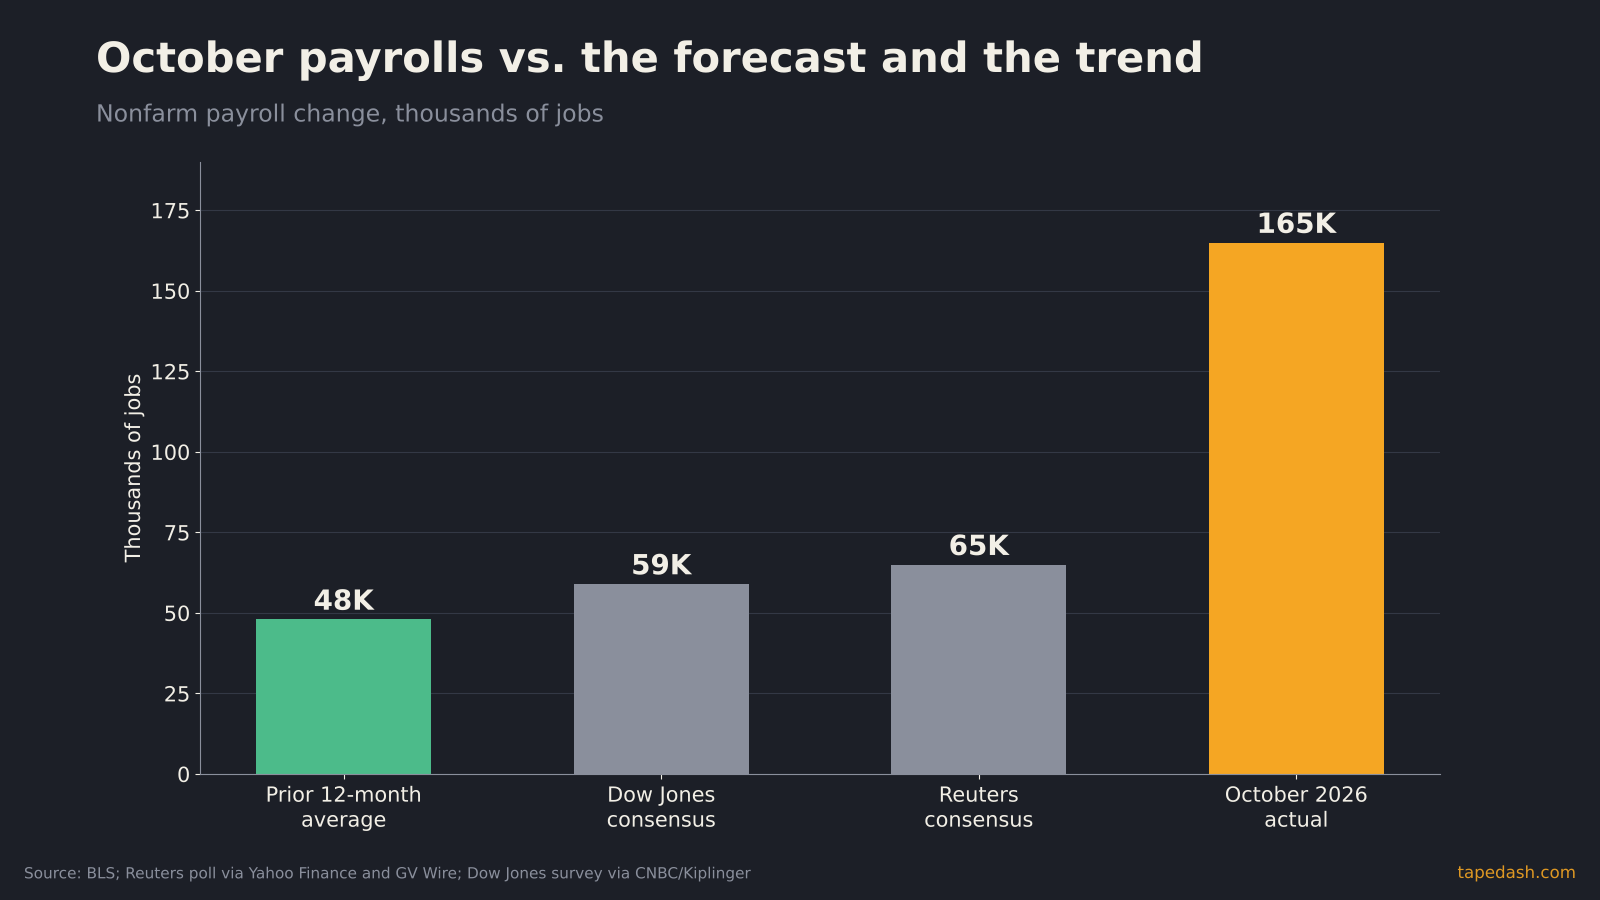
The miss matters as much as the number. When forecasters are bunched together and the print lands 100,000 jobs away from them, the market has to reprice all at once. That is a different animal from a report that lands at the edge of a wide forecast range.
The household survey told the same story
The unemployment rate comes from a separate survey of households, and it agreed with the payroll survey this time. The rate dipped to 4.1% from 4.2% in September (Yahoo Finance, Kiplinger), and BLS noted it has stayed between 4.1% and 4.3% since March. The participation rate edged up to 61.9% (BLS, CPA Practice Advisor). People came back into the labor force and the unemployment rate still fell, which is the healthier version of a lower jobless rate.
There was one soft spot worth flagging. The number of people working part time because they could not find full-time work rose by 339,000 (Yahoo Finance, StockTitan), and the broadest measure of underemployment, the U-6 rate, moved higher (CPA Practice Advisor, WSAW). That is a crack, not a collapse. It is the sort of detail that gets ignored on a hot headline day and then shows up in the Fed minutes three weeks later.
Why the revisions mattered as much as the headline
When I read a jobs report, the revisions line is the second thing I look at, right after the headline. They tell you whether the trend you thought you were in was real.
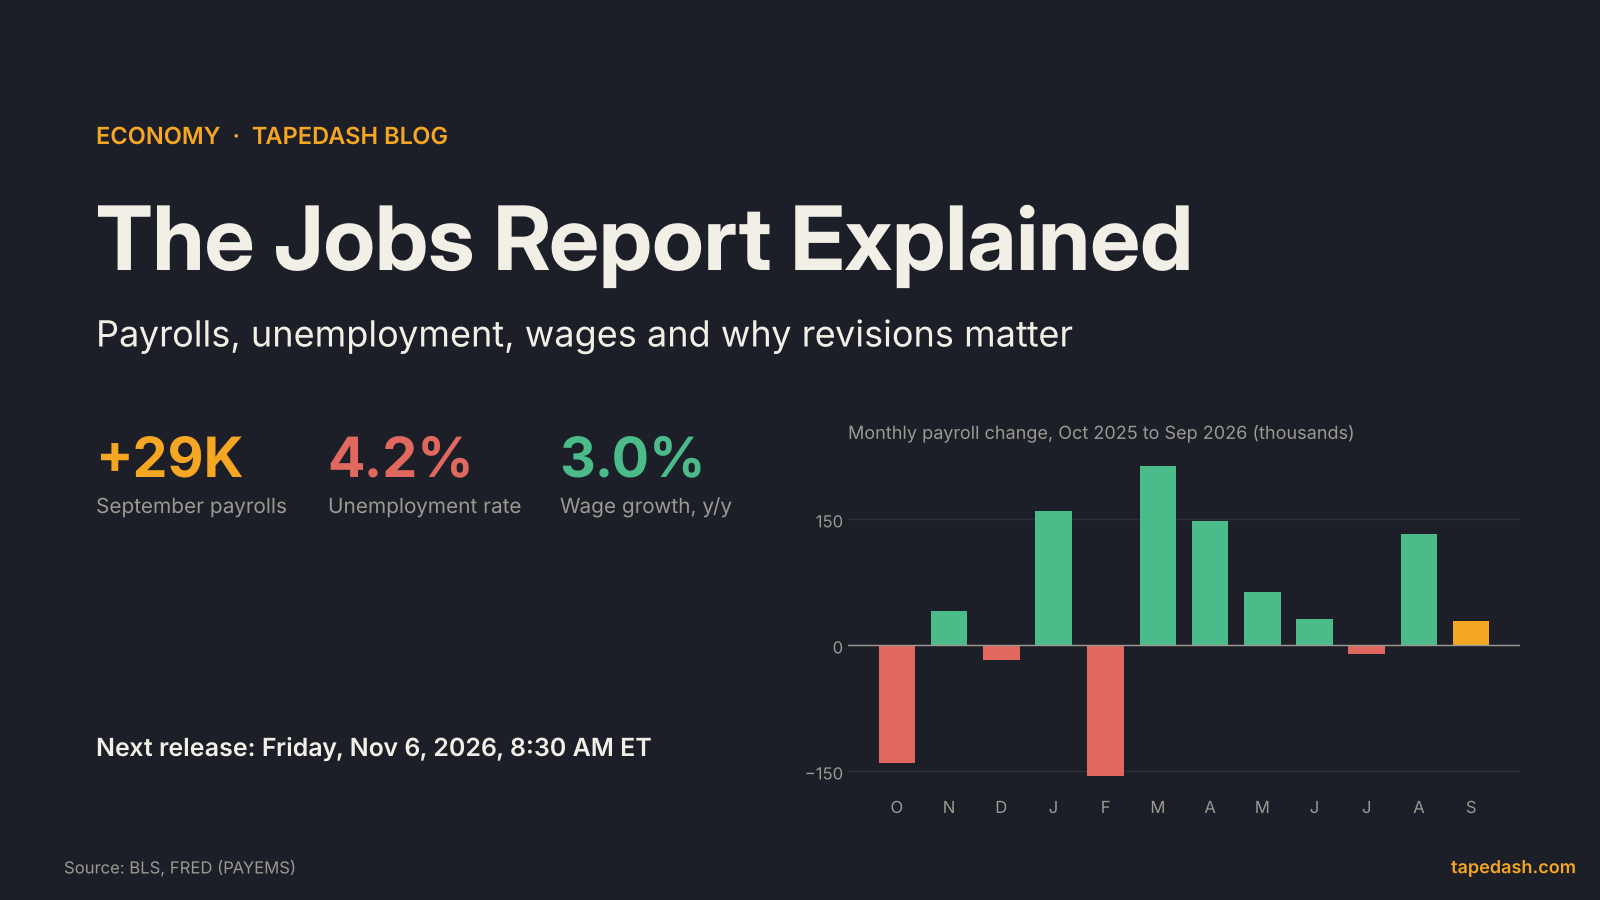
This month the revisions were big and they all went the same direction. August was revised to 186,000 from 133,000. September, which had been the weak print that fed the “labor market is cooling” story, was revised to 60,000 from 29,000 (BLS, WSAW). Combined, that is 84,000 more jobs than the market believed it had a month ago.
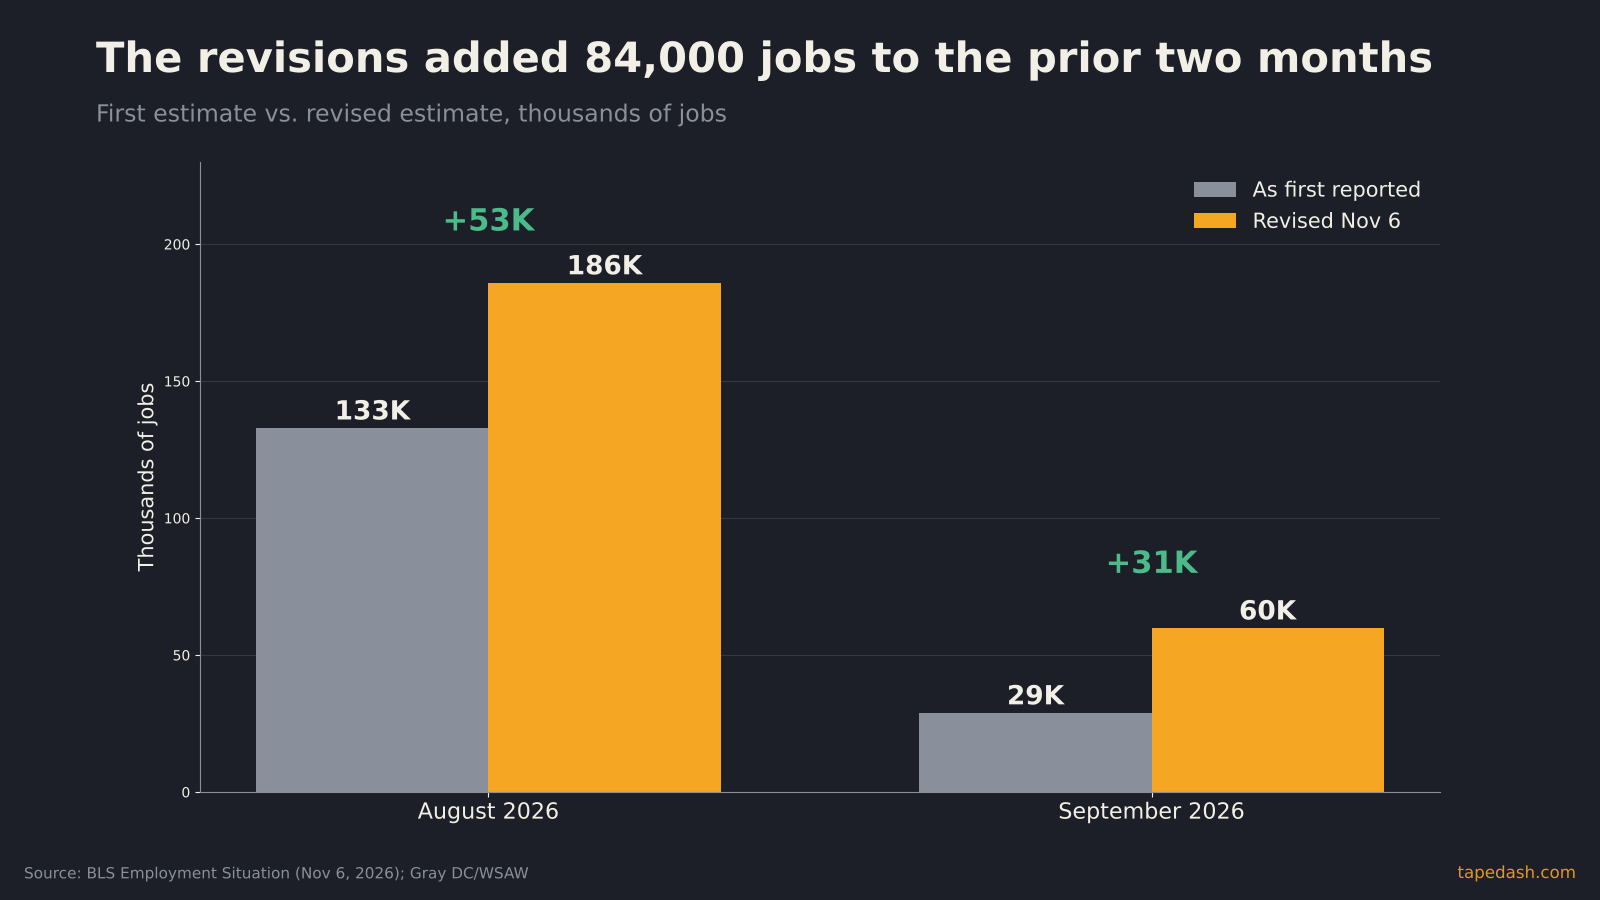
Here is why that matters for rates. A single hot month can be noise. The payroll survey is a sample, and its margin of error on any single month is wide enough that one print on its own proves little. But a hot month plus upward revisions to the two months before it changes the trend line, and the trend line is what the Fed actually reacts to. The three-month picture went from soft to solid in one release.
If you want the full walkthrough of how the two surveys work and why revisions happen at all, I wrote it up in The Jobs Report Explained. The short version: the first print is built from incomplete survey responses, and late responders get folded in over the next two months.
Which industries added jobs in October
The gains were not spread evenly. Professional and business services added 70,000 jobs, health care added 42,000, transportation and warehousing added 25,000, and manufacturing added 19,000 (BLS, WSAW). Construction, retail, leisure and hospitality, and government barely moved.
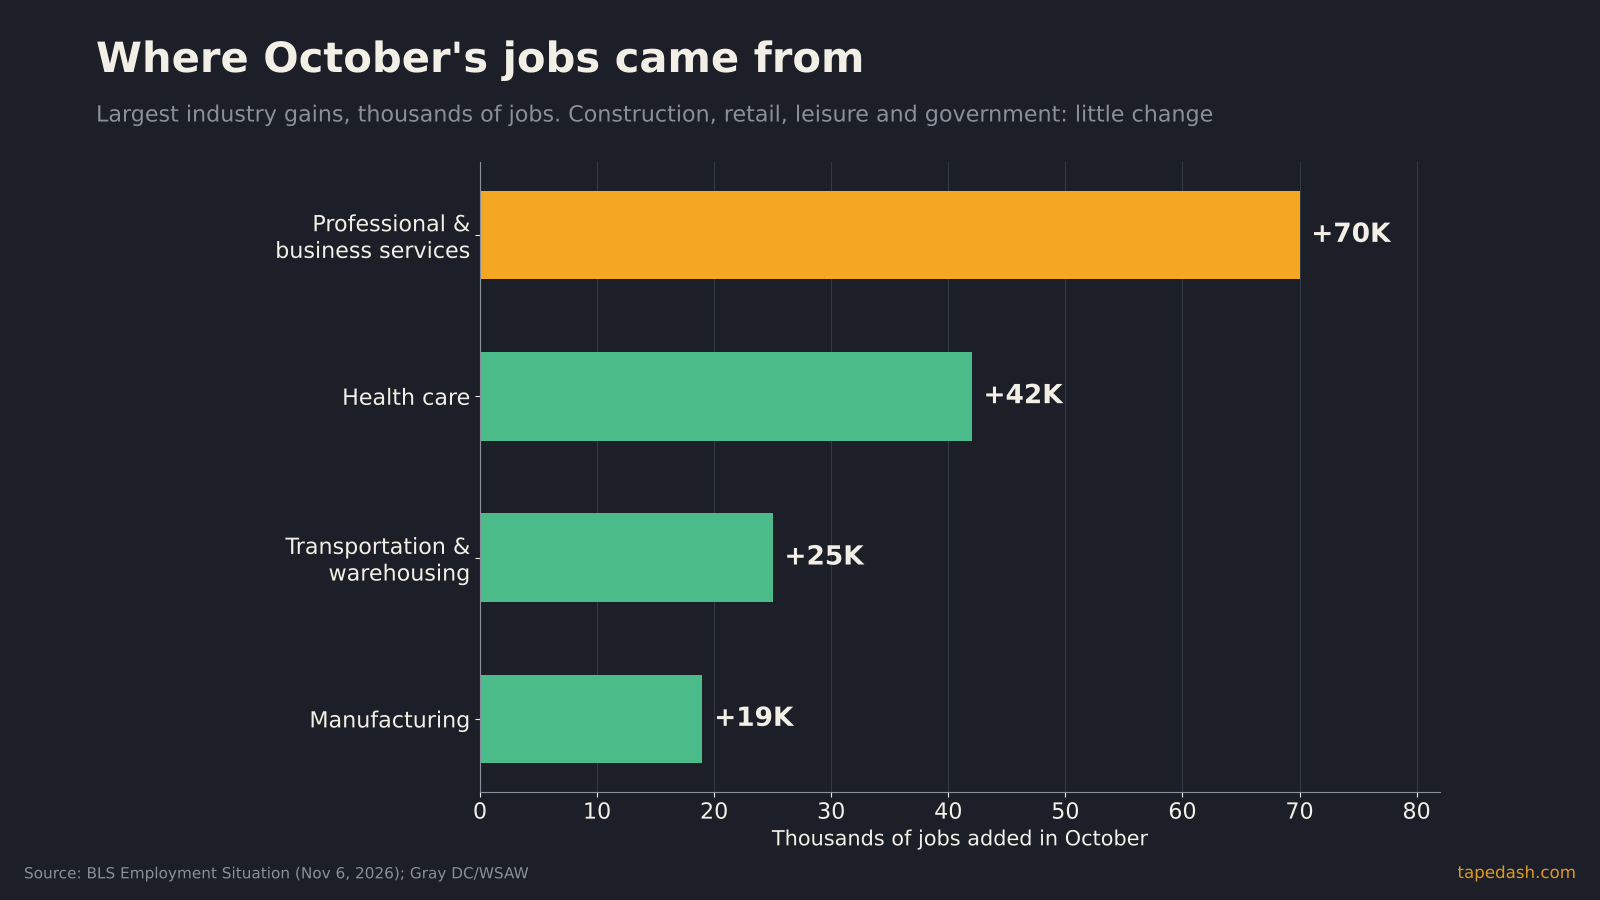
A few things stand out to me.
Professional and business services is a cyclical category. It includes staffing firms, consultants, engineers and back-office services, and companies cut it fast when they get nervous. A 70,000 gain there is a vote of confidence from employers, not a hiring pattern you see in a downturn.
Health care is the opposite. It has added jobs through good economies and bad for years because demand is driven by an aging population, not by the business cycle. Its 42,000 gain is steady, not a signal.
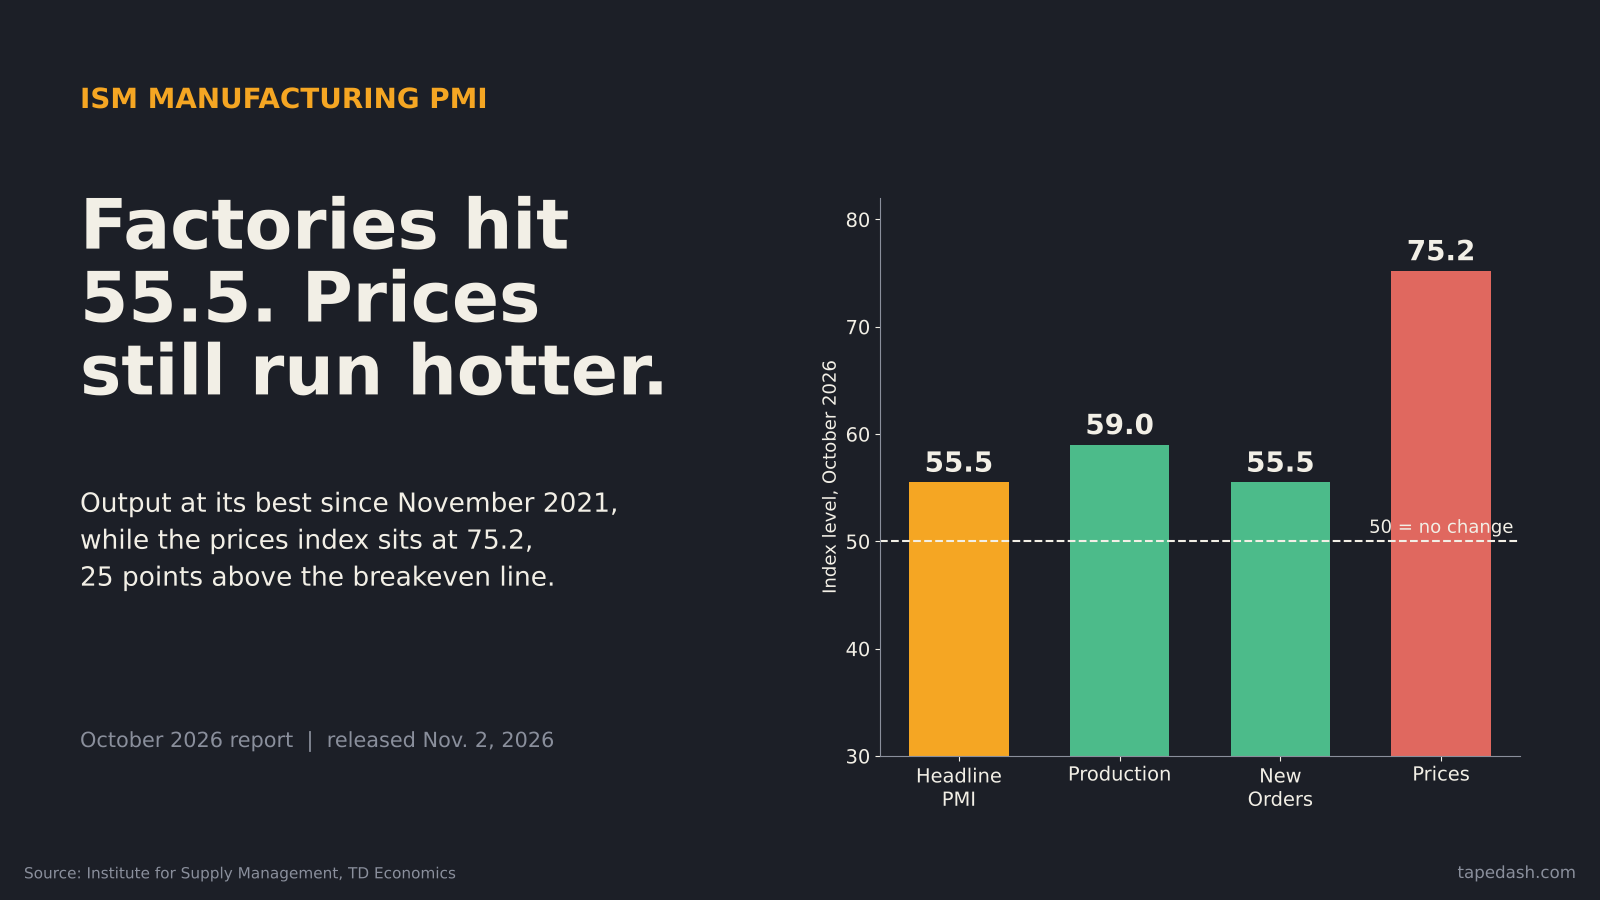
Manufacturing adding 19,000 jobs is the most interesting line for anyone who followed the factory data this week. The ISM manufacturing survey earlier in the week showed expansion with prices running hot, and the payroll data now back that up with actual hiring. Bloomberg’s write-up, carried by CPA Practice Advisor, pointed to computer and electronic products as a bright spot, which fits with the data center buildout.
Why a strong jobs report raises Fed rate hike odds
This is the part that confuses people outside the bond market, so let me lay out the chain.
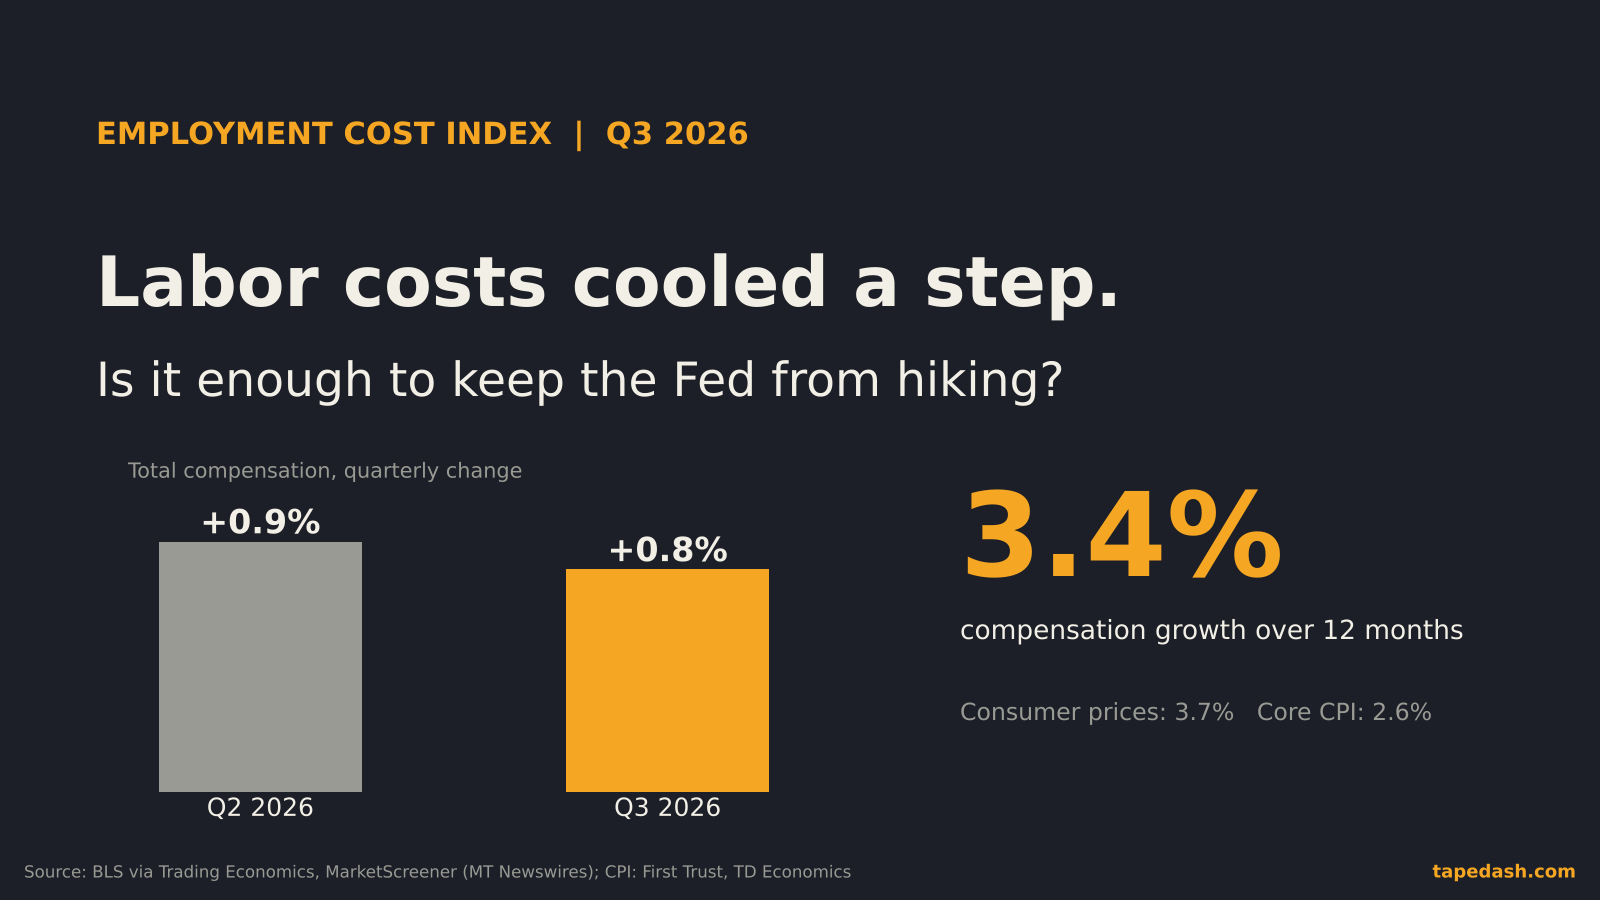
The Fed has two jobs: stable prices and maximum employment. When both are on target, it can sit still. When they pull in opposite directions, it has to choose. For most of this year, the debate was whether a soft job market would keep the Fed from responding to hot inflation. September CPI showed prices up 3.7% from a year earlier, up from 3.4% in August, with core CPI at 2.6% (Kiplinger, StockTitan). The Fed raised rates a quarter point in September to a 3.75% to 4.00% range and then held in October (The Motley Fool, Yahoo Finance).
That October hold bought time. Friday’s report took a lot of it away. If the labor market is adding jobs at three times its recent pace and unemployment is falling, the “we need to protect employment” argument gets weaker. Chair Kevin Warsh had already described job conditions as “quite positive” the week before (Kiplinger, CPA Practice Advisor), and he has said the Fed is focused on prices.
How the market priced it
The first move happened in futures. Odds of a December quarter-point hike rose to about 80% from about 67% on Thursday, per CME FedWatch data cited by GV Wire, while Reuters’ LSEG-based read was closer to 75% to 78% (Finimize, Yahoo Finance). Different snapshots at different times give slightly different readings. The direction is what counts: a December hike went from likely to the base case.
Then the 2-year Treasury, the maturity most tied to the Fed’s next few moves, climbed to about 4.52% (Yahoo Finance, GV Wire, Finimize). The 10-year moved less, ending near 4.85% to 4.88%. When the short end rises more than the long end after a data release, the market is telling you it expects the Fed to act soon, not that it fears long-run inflation. The dollar index rose about 0.7% to roughly 102.2 (Yahoo Finance, GV Wire), which is what you’d expect when US rates are expected to rise relative to everyone else’s.
Stocks were mixed. Thursday had been a brutal session for chip and AI stocks, which I covered in yesterday’s post on the Nasdaq correction, and Friday saw a partial bounce in tech while the Dow lagged. A strong jobs number is good news for earnings and bad news for the discount rate on those earnings. On any given day, either one can win.
How to read a jobs report like a rates trader
This is the part I’d want a newer trader to take away, because the same framework works every first Friday.
1. Compare the headline to the forecast, not to zero. Markets trade surprises. A 165,000 print against a 65,000 forecast is a big upside surprise. The same 165,000 against a 250,000 forecast would have been read as weak.
2. Add the revisions to the headline. I think of it as the “net surprise”: the headline miss plus the revision total. This month that is roughly 100,000 on the headline plus 84,000 in revisions. That number gives you a better sense of how much the trend changed than the headline alone.
3. Check whether the household survey agrees. When payrolls are strong and unemployment falls, the signal is clean. When they disagree, expect a messier reaction and a faster fade.
4. Look at wages next to inflation. Average hourly earnings rose 0.4% in October to $38.00 and are up 3.1% over 12 months (BLS, StockTitan). A 0.4% month annualizes to about 5%, which gets the Fed’s attention. But the yearly figure is still below September’s 3.7% CPI rate, so real pay is shrinking.
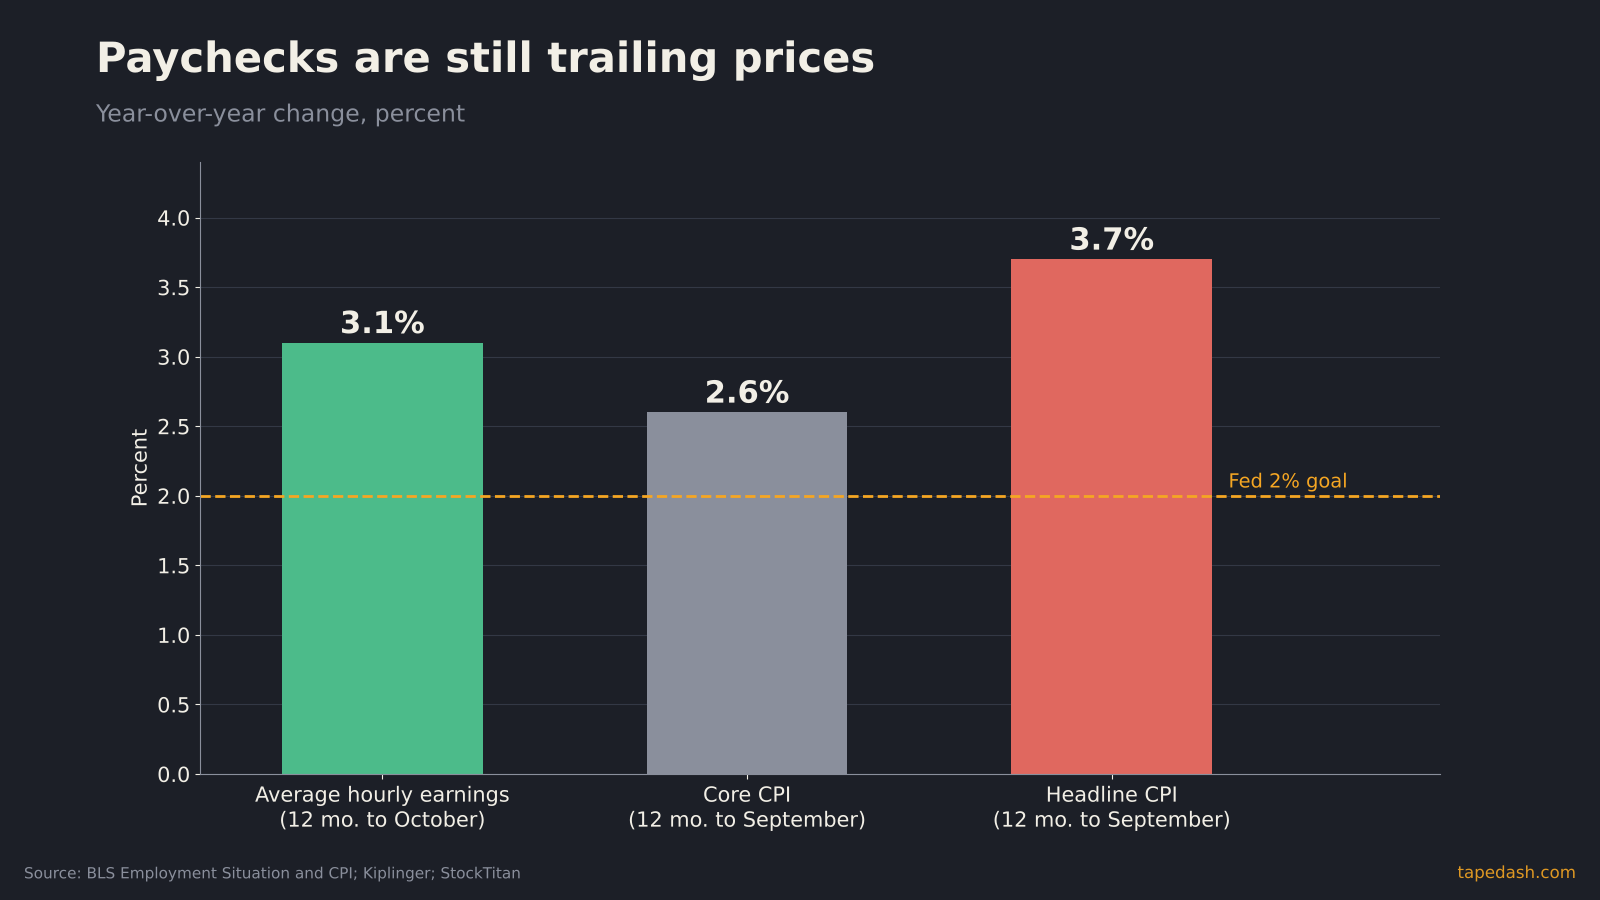
That wage chart is why I don’t think this is a wage-price spiral story yet. Pay is not outrunning prices. The Fed’s worry is that a tight labor market lets companies pass on higher costs, and that strong hiring keeps demand hot enough for those price increases to stick.
5. Watch the 2-year, not the S&P 500, for the verdict. Stocks have too many other things going on. The 2-year yield is the cleanest read on how much the report changed the Fed outlook. If it holds its gains through the next CPI print, the market believes the report.
For the mechanics of turning futures prices into hike probabilities, see How to Read CME FedWatch and Fed Funds Futures.
December Fed meeting scenarios after the jobs report
The jobs report raised the odds, but it doesn’t settle the December decision. The Fed will see one more jobs report and two inflation reports before it votes, and one of those inflation reports lands the day after the decision. Here is how I’d frame the paths.
| Scenario | What the data would show | Likely Fed read | What traders would watch |
|---|---|---|---|
| Hot CPI, strong November jobs | October CPI monthly change near or above September’s 0.6%, payrolls well above 100,000 | Quarter-point hike looks locked in; talk of more in 2027 | 2-year pushing higher, dollar firm, pressure on long-duration growth stocks |
| Mixed data | CPI cools some, jobs hold up | Hike still likely but the guidance gets softer | Curve shape, whether futures price a pause after December |
| Cool CPI, weak November jobs | CPI monthly change drops sharply, payrolls fall back toward the 48,000 trend | Fed could hold again and wait for January | 2-year falls fast, hike odds slide, small caps and rate-sensitive sectors bounce |
A note on October’s CPI that most previews skip: the November 10 report will not have a 12-month headline inflation rate. BLS could not collect October 2025 prices during last year’s government shutdown, so there is no base month to compare against (BLS, StockTitan). The monthly changes will still be published. That means the number that moves markets on Tuesday will be the month-over-month change, especially core. If you are used to anchoring on the yearly figure, adjust for one month. My guide to reading the CPI report covers which lines to watch first.
What to watch next: dates and data releases
Here is the calendar between now and the December decision, with each date checked against the BLS schedule and a second calendar.
- Tuesday, Nov. 10, 8:30 a.m. ET: October CPI (BLS, StockTitan). Focus on the monthly headline and core changes, since the yearly headline will not be published.
- Friday, Nov. 13, 8:30 a.m. ET: October Producer Price Index (BLS, StockTitan). Pipeline pressure on goods prices, including anything from energy.
- Friday, Dec. 4, 8:30 a.m. ET: November jobs report (BLS, Thrive in Markets). The last labor print before the Fed. Watch whether October’s strength gets revised away.
- Tuesday and Wednesday, Dec. 8 and 9: FOMC meeting, decision on Dec. 9 (The Motley Fool, Yahoo Finance).
- Thursday, Dec. 10, 8:30 a.m. ET: November CPI (BLS, StockTitan). It arrives a day after the decision, so it shapes January expectations, not December’s vote.
The order is awkward for the Fed. It votes with October inflation data and November jobs data in hand, but without November inflation. That makes Tuesday’s CPI unusually important. It is the last full inflation read the committee sees before it decides.
Tracking the jobs report and Fed hike odds with TapeDash
If you want to watch whether this report actually sticks, the questions are simple. Does the 2-year hold above where it closed Friday into CPI? Do hike odds stay above 70%? And do rate-sensitive groups like homebuilders, regional banks and small caps keep lagging while the market waits?
That is what we built the TapeDash Terminal to show on one screen: rates, sector rotation and the options flow underneath it. On data days I watch whether the flow in rate-sensitive ETFs and the big index names lines up with what the bond market is saying. When the flow and the 2-year agree, the move tends to have legs. When they disagree, I assume the first reaction is wrong until proven otherwise. The Live Scanner flags unusual activity as it happens, so you can see positioning before Tuesday’s CPI rather than after.
If you’d rather just get the read each morning, the free TapeDash Daily covers the data calendar and what moved overnight. For anyone thinking about going further, the first 200 members lock Pro at $69.99 a month on their account, even if they cancel and come back later.
FAQ: October 2026 jobs report
How many jobs were added in October 2026?
Employers added 165,000 jobs in October 2026, according to BLS. Economists had expected roughly 59,000 to 65,000, depending on the survey. August and September were also revised up by a combined 84,000.
What is the unemployment rate after the October jobs report?
The unemployment rate fell to 4.1% in October from 4.2% in September. It has stayed between 4.1% and 4.3% since March, per BLS.
Will the Fed raise rates in December 2026?
Nobody knows yet. After the report, futures priced roughly a 75% to 80% chance of a quarter-point hike at the Dec. 8 to 9 meeting. The October CPI on Nov. 10 and the November jobs report on Dec. 4 will move those odds in either direction.
The one thing to remember
The October jobs report did not show a labor market that is overheating. Wages still trail prices and underemployment ticked up. What it did was take away the Fed’s best reason to wait. With inflation at 3.7% and job growth back above trend, the burden of proof now sits on the inflation data. Watch Tuesday’s monthly CPI number and the 2-year yield. Those two will tell you more about December than any Fed speech between now and then.
See it on the tape, not just in the headlines
TapeDash is the research desk for traders and investors: live options flow, dealer positioning, a real-time market scanner and trade alerts graded in public. Memberships open Black Friday, November 27, and the first 200 members lock Pro at $69.99 a month on their account, even if they cancel and come back later.
Join the waitlistClick through the terminalSee the track recordSources
- BLS: The Employment Situation, October 2026 (Nov 6, 2026)
- Yahoo Finance: Strong October jobs report sends yields higher (Nov 6, 2026)
- GV Wire / Reuters: Dollar jumps after strong US payrolls report (Nov 6, 2026)
- Finimize: Strong US jobs report pushed Treasury yields higher (Nov 6, 2026)
- Kiplinger: What to expect from the October jobs report (Nov 6, 2026)
- Gray DC / WSAW: U.S. adds 165,000 jobs in October as hiring rebounds (Nov 6, 2026)
- CPA Practice Advisor / Bloomberg: U.S. adds 165,000 jobs, topping all forecasts (Nov 6, 2026)
- StockTitan: October 2026 jobs report (Nov 6, 2026)
- StockTitan: Next CPI report will have no yearly inflation rate for overall prices
- Kiplinger: September CPI report shows inflation remains red-hot
- The Motley Fool: The Fed is suddenly on hold. When could it start hiking again? (Nov 2, 2026)
- Yahoo Finance: When is the next Fed meeting? Full 2026 schedule
- BLS: November 2026 release schedule
- BLS: CPI release schedule
- BLS: 2025 federal government shutdown impact on the CPI
- Thrive in Markets: CPI and NFP release dates 2026
This article is for educational and informational purposes only. It is not financial, investment, medical or legal advice, and it is not a recommendation to buy or sell any security. Figures come from the sources listed and were checked on the date of publication; markets change quickly. Options trading involves substantial risk of loss.