ISM Manufacturing PMI Hits 55.5: Why the Prices Index Matters More
The ISM manufacturing PMI rose to 55.5 in October 2026 with output at a 2021 high. Why the 75.2 prices index is the number the Fed and traders will watch.
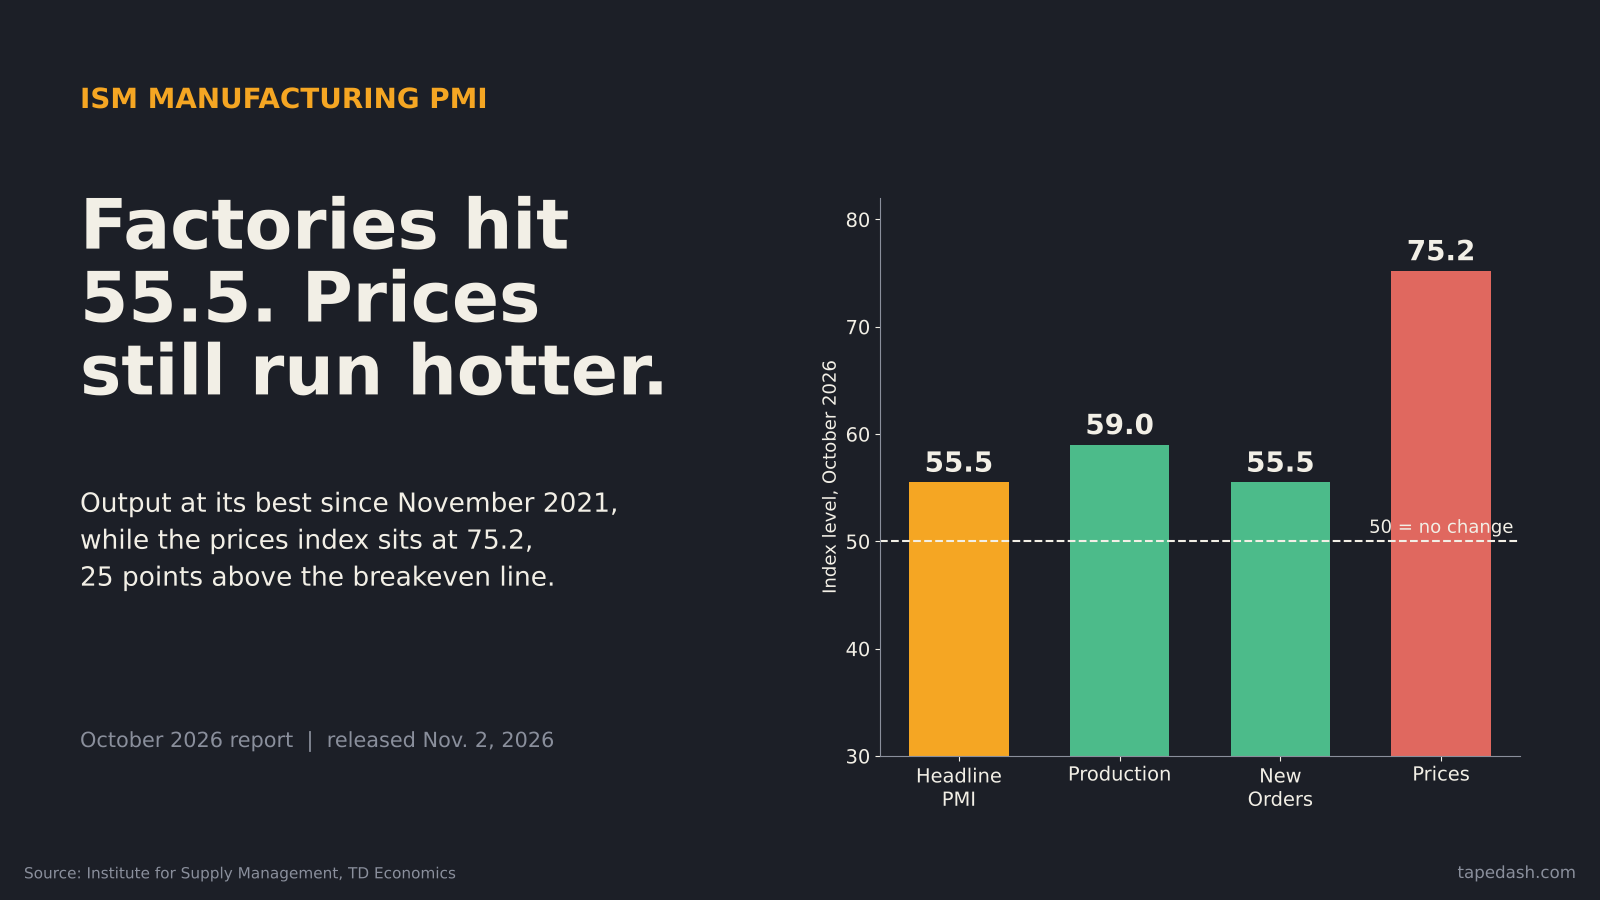
The ISM manufacturing PMI rose to 55.5 in October, up a full point from 54.5 in September and above the 54.6 consensus, according to the Institute for Supply Management and TD Economics. It was the tenth straight month above 50. The production index jumped to 59.0, its highest reading since November 2021.
That is a strong factory report by any standard, and the market barely cared. The S&P 500 closed down 0.5% and the Nasdaq fell about 1.1% on Monday, per AP and Yahoo Finance, as tech kept sliding and Brent crude dropped more than 7% on hopes of a diplomatic opening in the Iran war.
So what does a 55.5 ISM manufacturing PMI actually tell you? The short answer: demand and output are real, but the part of this report that moves rates is the prices index, which eased to 75.2 from 77.9 and is still about 25 points above neutral. Below I’ll walk through how the PMI is built, why the prices gauge is the number I care about most this month, and how to read the next few reports without getting fooled by the headline.
- The ISM manufacturing PMI rose to 55.5 in October 2026 from 54.5, beating the 54.6 consensus. It is the tenth straight month of expansion.
- Production hit 59.0, the best since November 2021. New orders held at 55.5 and inventories flipped back into growth at 51.4.
- The prices index eased to 75.2 from 77.9 but has now been above 50 for 25 months. That gauge, more than the headline, feeds the Fed’s inflation worry.
- Supplier deliveries at 59.1 add to the headline, but slow deliveries in a supply shock are partly a symptom of strain, not only strength.
- Next tests: ISM services on Nov. 4, the October jobs report on Nov. 6, CPI on Nov. 10 and the Fed on Dec. 8 to 9.
What the ISM manufacturing PMI showed in October 2026
Start with the components, because the headline hides as much as it shows. ISM’s survey asks purchasing managers whether ten things got better, worse or stayed the same. Five of those answers get averaged into the PMI. The other five are published alongside it and are often more useful.
Here is the full October board, cross-checked between the ISM release and TD Economics:
| ISM index | October 2026 | September 2026 | Change | In the PMI? |
|---|---|---|---|---|
| Manufacturing PMI | 55.5 | 54.5 | +1.0 | Headline |
| New Orders | 55.5 | 55.3 | +0.2 | Yes |
| Production | 59.0 | 56.7 | +2.3 | Yes |
| Employment | 52.4 | 52.7 | -0.3 | Yes |
| Supplier Deliveries | 59.1 | 59.0 | +0.1 | Yes |
| Inventories | 51.4 | 48.6 | +2.8 | Yes |
| Customers’ Inventories | 41.6 | 41.6 | 0.0 | No |
| Prices | 75.2 | 77.9 | -2.7 | No |
| Backlog of Orders | 54.6 | 56.4 | -1.8 | No |
| New Export Orders | 51.2 | 50.9 | +0.3 | No |
| Imports | 52.9 | 51.0 | +1.9 | No |
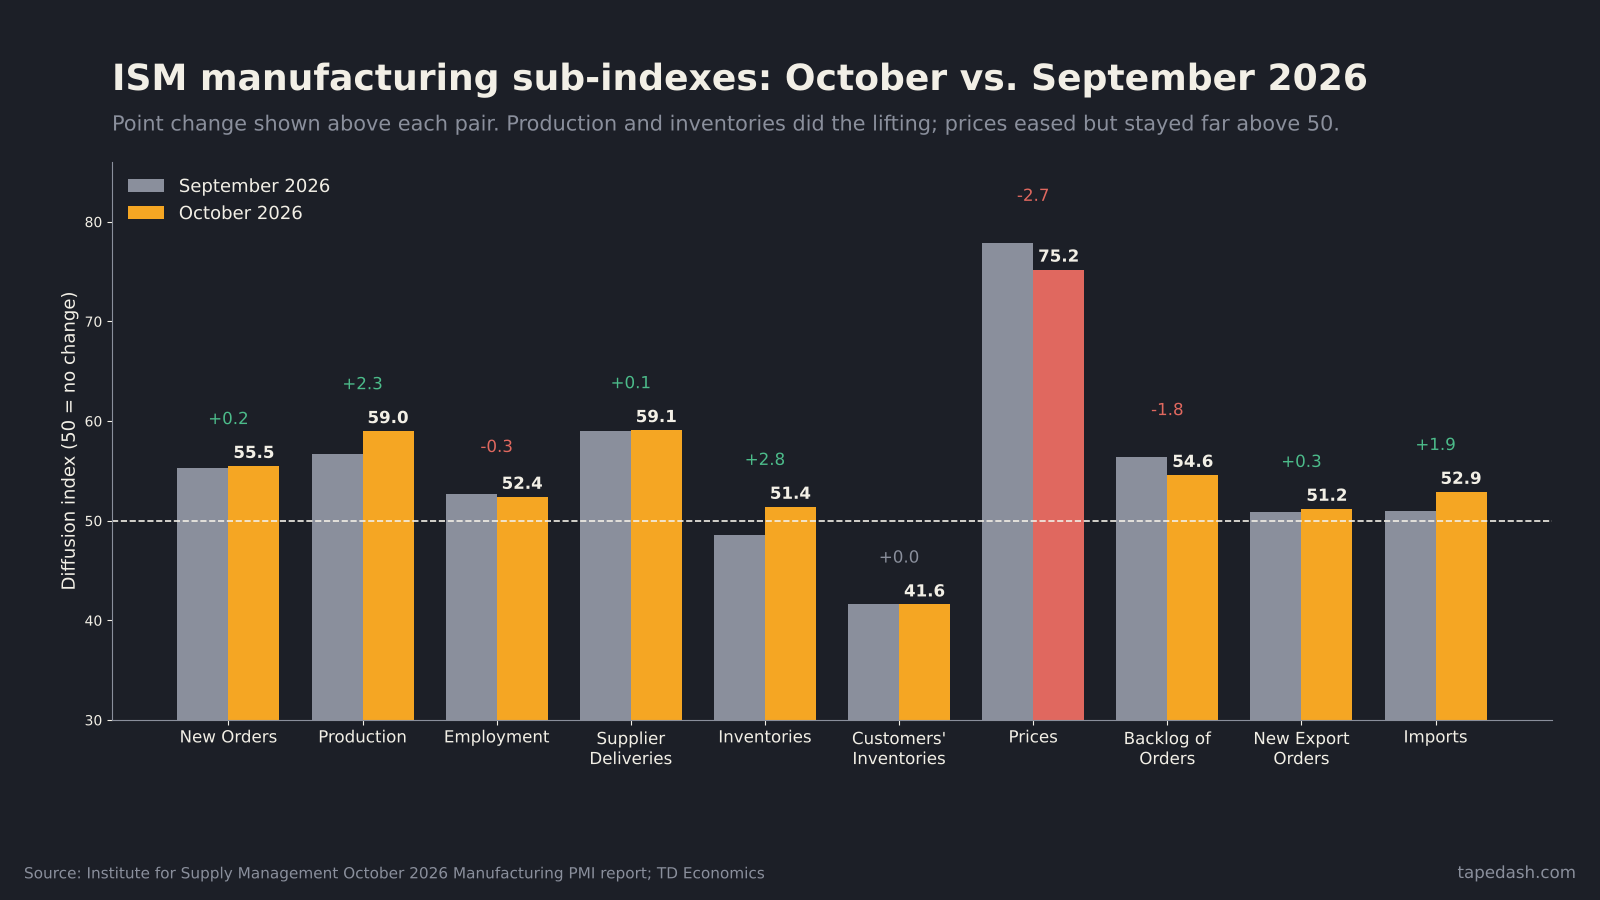
Three things jump out. First, the gain was driven by production and inventories, not by a surge in fresh demand. New orders only ticked up 0.2 points. Second, backlogs fell 1.8 points while production rose, which is what you’d expect when factories work through orders they already have. Third, customers’ inventories stayed at 41.6. ISM reads anything under 50 on that question as customers holding too little stock, which tends to support orders in the months ahead.
Employment is the soft spot. At 52.4 it’s still growing, and Bloomberg via Transport Topics notes it is the fourth straight month of factory hiring gains. But it slipped from September. Factories are getting more out of the people they have before adding more.
How the ISM PMI is calculated (and the quirk in supplier deliveries)
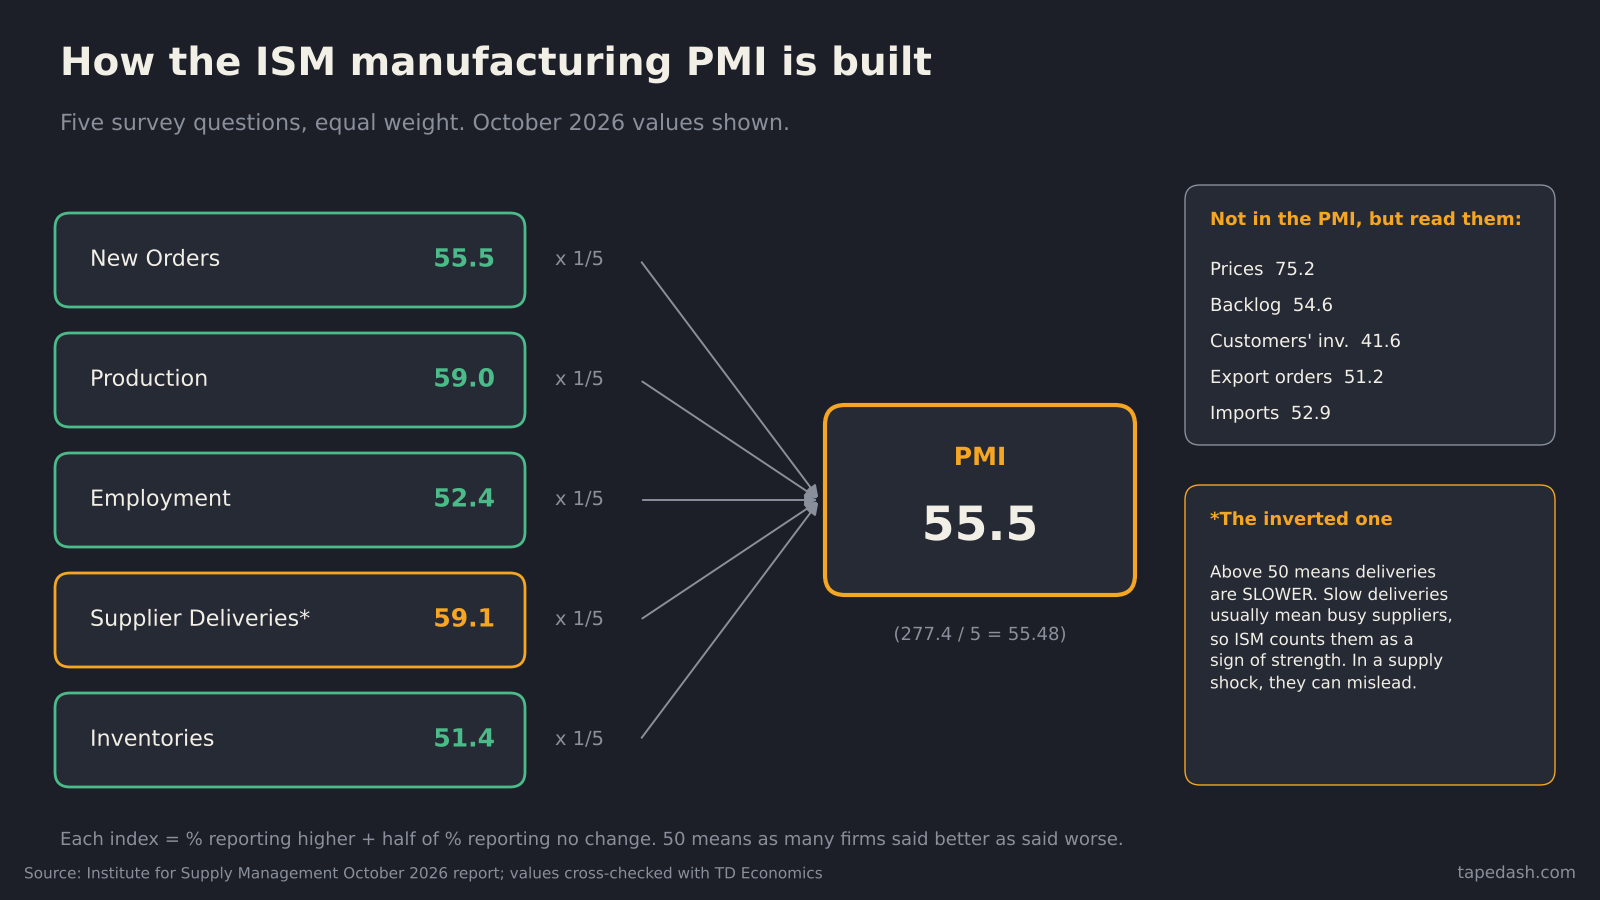
A lot of people treat 55.5 as if it were a percentage growth rate. It isn’t. Each ISM index is a diffusion index: the share of respondents reporting an increase, plus half the share reporting no change. A reading of 50 means as many firms said “higher” as said “lower.” So 55.5 tells you breadth, not size. A month where many firms grow a little can print the same number as a month where fewer firms grow a lot.
The headline PMI is a simple equal-weighted average of five components. You can check it with October’s numbers: 55.5 + 59.0 + 52.4 + 59.1 + 51.4 = 277.4, and 277.4 divided by five is 55.48, which rounds to 55.5. (Some older explainers still list a 30/25/20/15/10 weighting. That was an older formula ISM dropped years ago. The arithmetic above shows the current one.)
Why supplier deliveries can flatter the headline
Supplier deliveries is the inverted one. A reading above 50 means deliveries are getting slower. In a normal cycle that’s a sign of strength: suppliers are slow because they’re busy. ISM counts it as positive for that reason.
The catch is what happens during a supply shock. If tariffs, a war and shipping disruption are stretching lead times, deliveries slow down without any extra demand behind it. That still pushes the PMI up. October’s supplier deliveries index of 59.1 contributed more to the headline than new orders did. ISM’s own commentary blamed high prices on steel and aluminum, tariffs and petroleum-based inputs tied to the Middle East conflict, and Bloomberg’s write-up lists tariffs, supply chain disruptions and the Iran war as the main headwinds for manufacturers.
When I read a PMI during a supply shock, I strip supplier deliveries out and average the other four. For October that’s (55.5 + 59.0 + 52.4 + 51.4) / 4, or about 54.6. Still clearly expanding. Just less dramatic than the headline.
Why the ISM prices index matters more than the headline
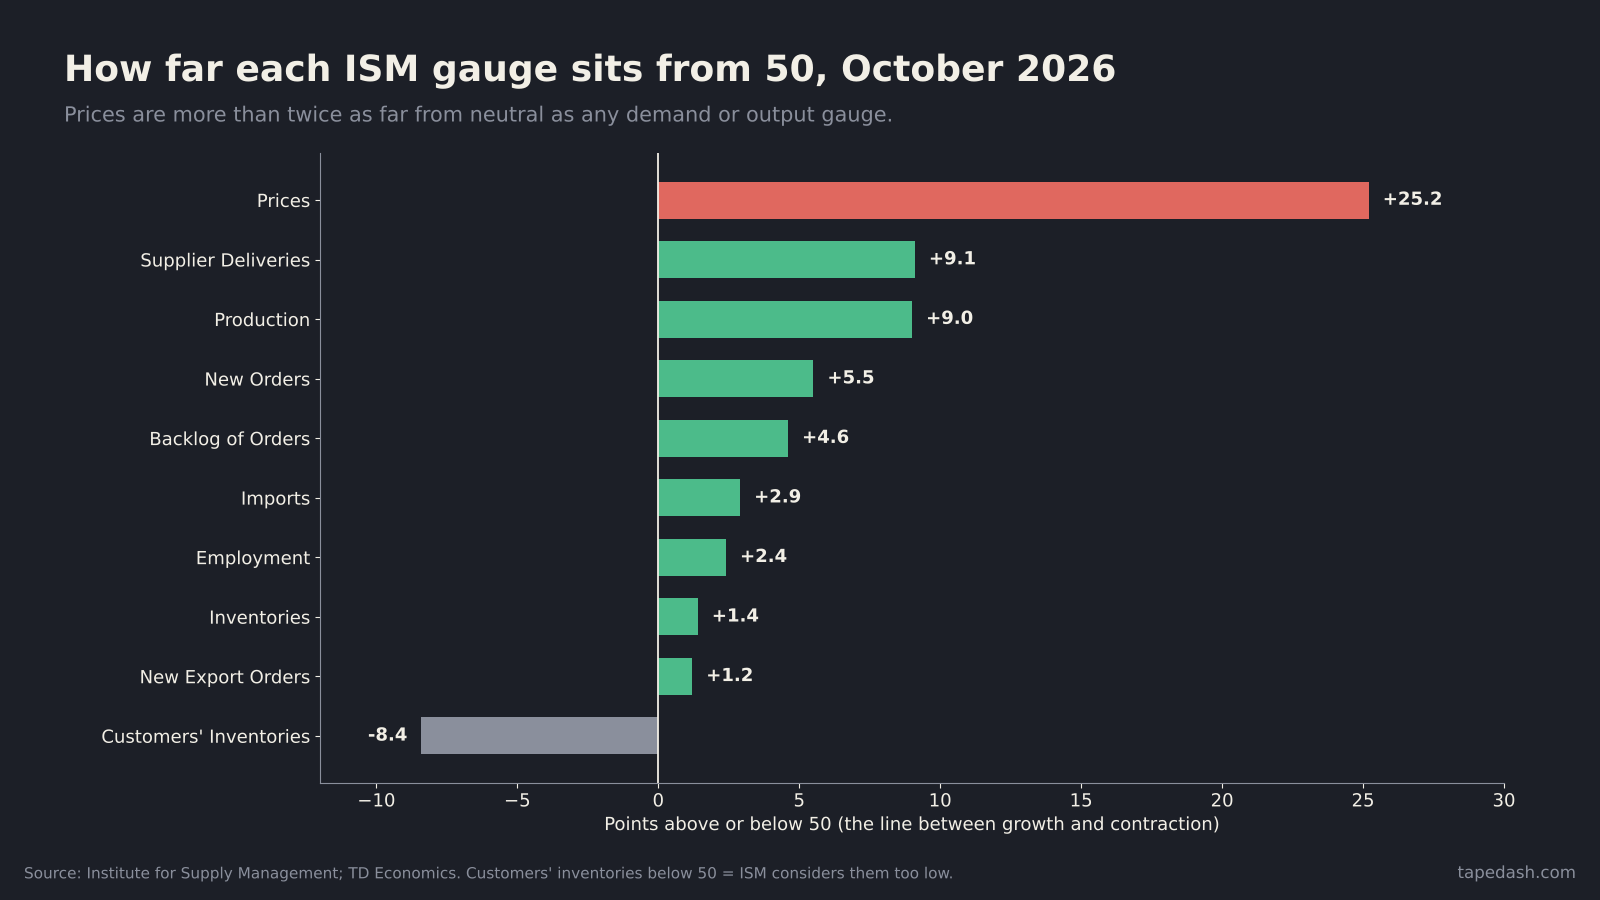
If you only remember one number from this report, make it 75.2.
The prices index asks whether the cost of the things factories buy went up, down or stayed flat. At 75.2, reports of rising costs overwhelm reports of falling ones by a wide margin. It has been above 50 for 25 straight months, per ISM and Fat Tail. The drop from 77.9 was welcome, and TD’s economists called it a good sign for goods inflation. They also said the problem shouldn’t be considered solved, which is the right read.
How input prices reach the CPI
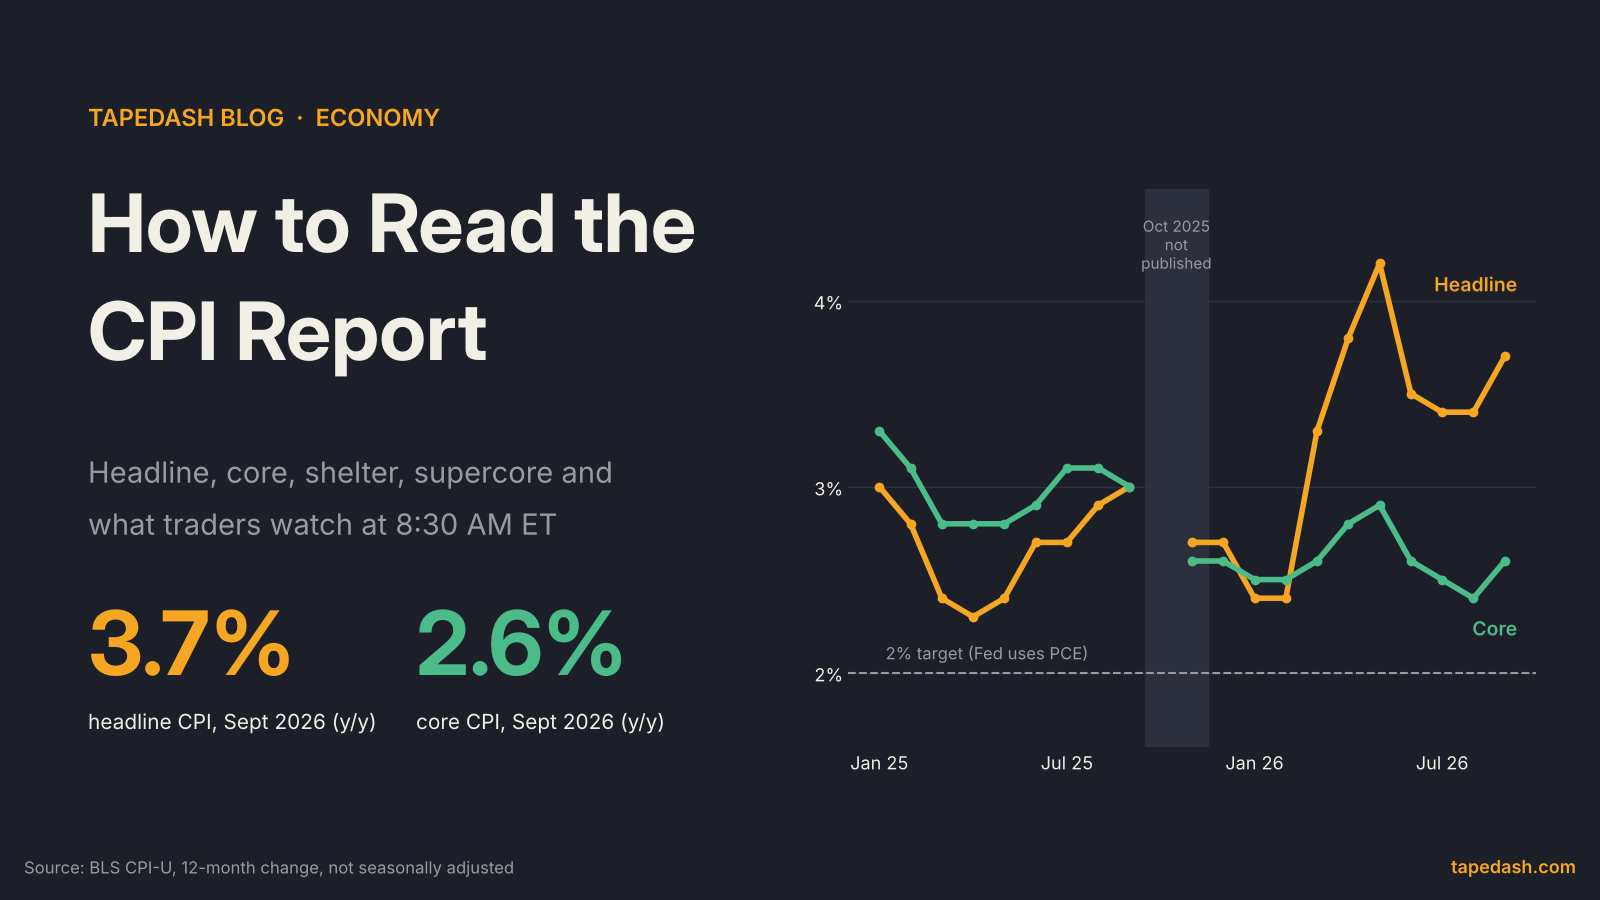
The path from a purchasing manager’s survey answer to your grocery bill is slow and leaky, but it’s real. Factories pay more for steel, resin and freight. Some of that gets absorbed in margins. Some gets passed to wholesalers and shows up in the producer price index a month or two later. A slice of that reaches consumer goods prices in the CPI. The ISM prices gauge is one of the earliest reads on the top of that pipe.
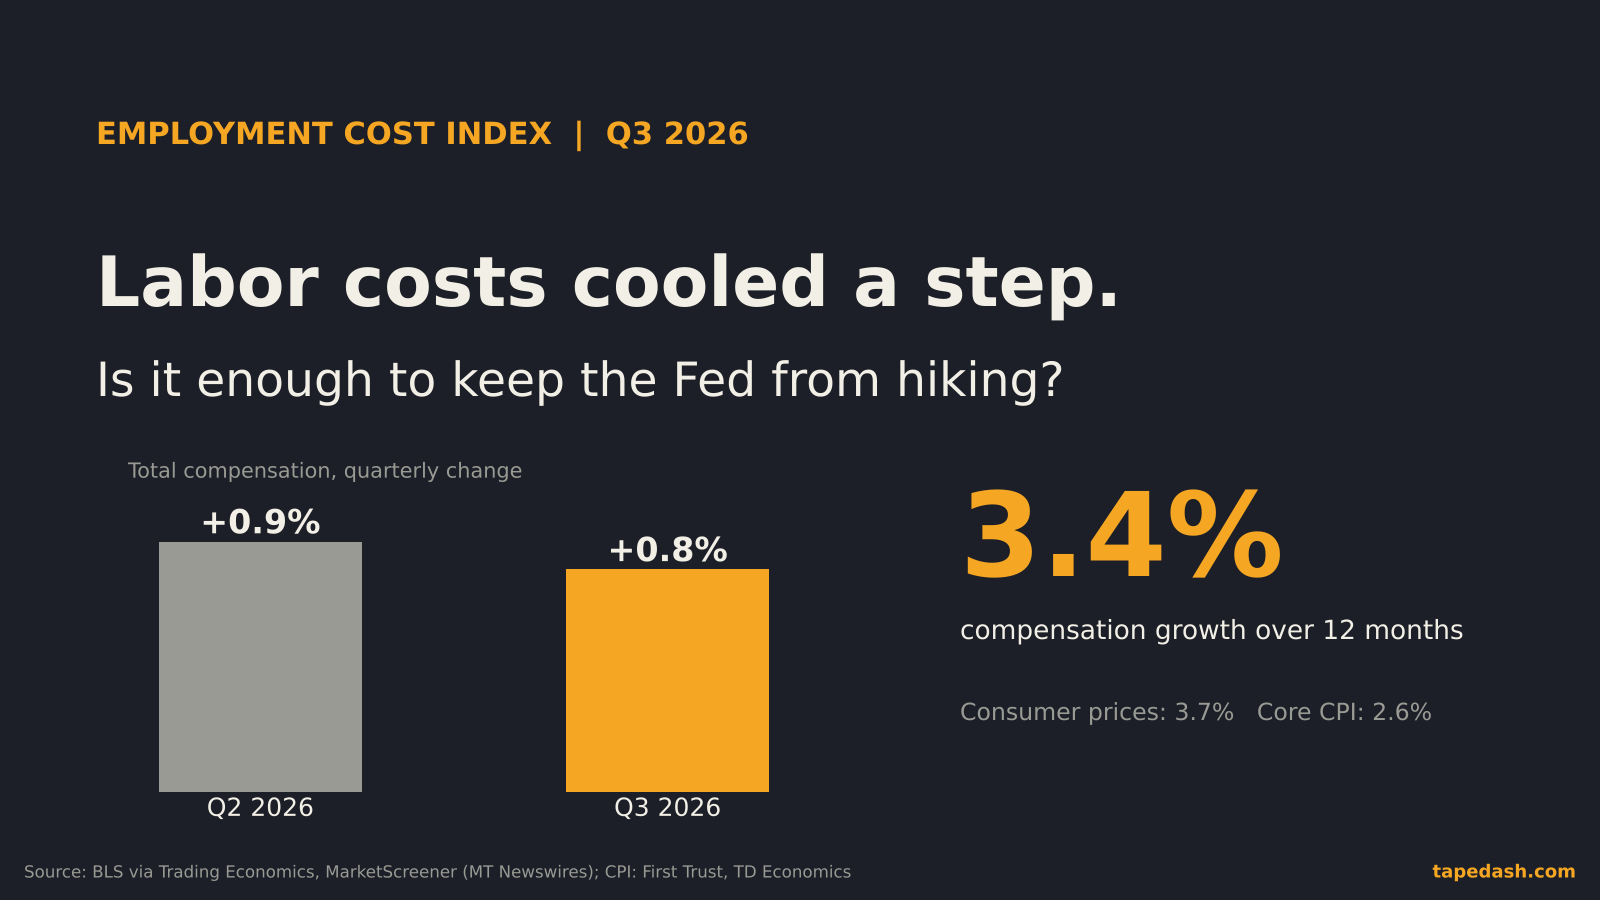
That’s why the Fed watches it. The Fed’s preferred inflation gauge is still well above its 2% goal (I covered the cost side of that in the Employment Cost Index breakdown), and the October meeting ended in what we called a hawkish hold. A factory sector running hot with input costs this high doesn’t give the committee much room to relax.
What Monday’s oil drop changes
Brent fell more than 7% on Monday. If that sticks, it matters for the prices index, because petroleum-based inputs were one of the main drivers ISM cited. But one day of oil weakness doesn’t rewrite a month of survey answers. The November survey closes later this month, and oil has been moving in both directions on war headlines. I covered the supply side in yesterday’s OPEC+ piece. The short version: when the constraint is shipping through Hormuz, price relief can reverse quickly.
Who wins and who loses from a hot factory sector
The industry breadth was wide. ISM reported 12 industries growing in October and three contracting (printing, paper and nonmetallic mineral products), a split also reported by Breitbart Business. The growth list leads with plastics and rubber, electrical equipment, machinery and computer and electronic products.
That mix lines up with the spending story of 2026. A machinery respondent in the ISM report pointed to data centers, municipal water infrastructure and mining as the sources of strength. Another respondent said commodities linked to AI and data centers are in short supply and getting more expensive. If you’ve read our AI capex explainer, this is the same money showing up one layer down: transformers, switchgear, cooling, copper and steel.
The losers are the buyers of inputs with no pricing power. A fabricated metals respondent said customers only commit to the shortest possible terms because of policy uncertainty. A transportation equipment respondent said the usual fourth-quarter budget bump isn’t showing up this year. When costs run hot and customers hesitate, margins get squeezed in the middle of the supply chain.
For markets, a strong ISM with sticky prices is a mixed signal. It’s good for industrials, materials and anything tied to physical buildout. It’s less friendly to long-duration growth stocks, because it keeps the case for higher rates alive. On Monday the Dow rose about 0.4% while the Nasdaq fell, which fits that pattern, though tech had its own reasons to be weak after last week’s sell-off.
How to read the ISM report like a trader
Here’s the checklist I use each first business day of the month. It takes about five minutes and keeps me from trading the headline.
- Check new orders minus inventories. A wide positive gap means demand is outrunning stock, which tends to pull production up in coming months. October’s gap is 4.1 points (55.5 minus 51.4), narrower than September’s 6.7 because inventories rebuilt.
- Strip supplier deliveries in a supply shock. If deliveries are doing heavy lifting, the headline overstates demand.
- Read prices against the consensus, not just the prior month. Economists publish forecasts for the prices index too (see Verified Investing for October’s). Rates care about the surprise, not the level.
- Look at backlogs and customers’ inventories for the next two months. Falling backlogs with low customer stock usually means steady, not accelerating, demand.
- Read the respondent comments. They’re anecdotal, but they tell you why a number moved. This month they pointed at tariffs, the Middle East and data centers.
The scenarios for November
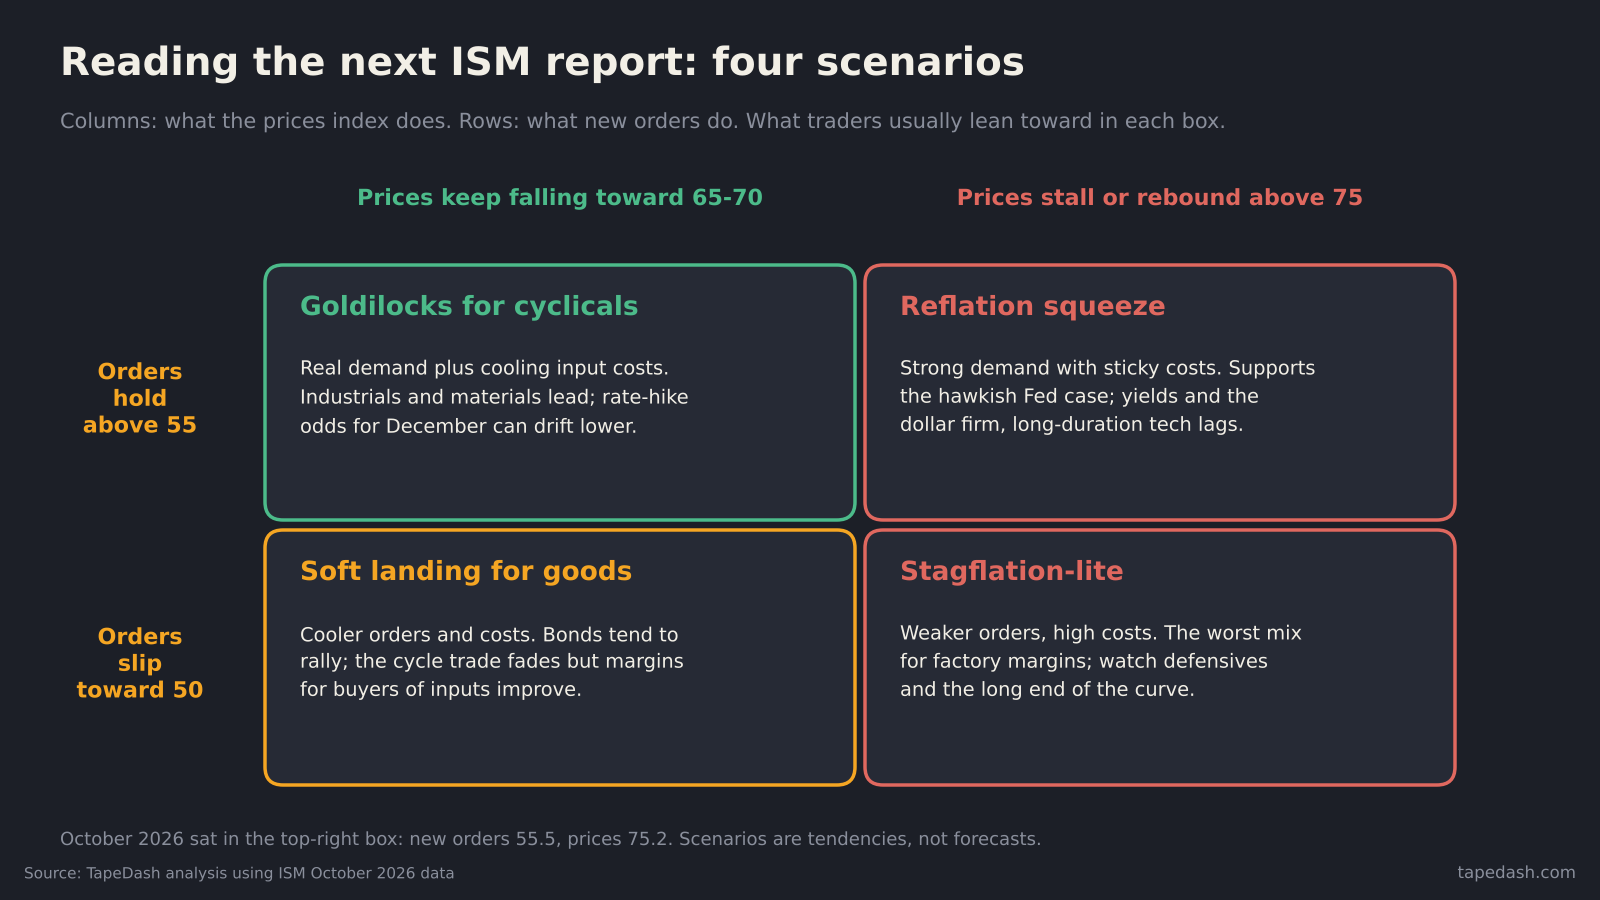
If new orders hold above 55 and prices keep falling toward the high 60s, that’s the friendliest setup for cyclical stocks and would take some pressure off the Fed. If orders hold but prices stall above 75, that’s a reflation squeeze. Traders will watch yields and the dollar firm up and long-duration tech lag. If orders slip toward 50 while prices stay high, that’s the worst mix for factory margins. These are tendencies, not forecasts. The way I use the matrix is to decide in advance which assets should react to which number, so I’m not making it up at 10:01 AM.
ISM vs. other manufacturing data: how they compare
ISM isn’t the only factory survey, and it doesn’t always agree with the hard data. It’s worth knowing what each series is good for.
| Indicator | What it measures | Release timing | Best use |
|---|---|---|---|
| ISM manufacturing PMI | Breadth of change reported by factory purchasing managers | First business day of the month | Earliest national read on direction and prices |
| S&P Global U.S. manufacturing PMI | Similar survey, different panel and weighting | Flash late in the month, final on the first business day | Cross-check on ISM; flash gives an early look |
| Regional Fed surveys (Empire, Philly, Richmond, Dallas, Kansas City) | Local diffusion indexes | Mid to late month | Previewing ISM before it prints |
| Industrial production (Fed) | Actual output volume | Mid-month | Confirming whether survey strength shows up in real output |
| Durable goods orders (Census) | Dollar value of new orders | Late month | Confirming capex demand in dollars |
The survey data leads. The hard data confirms or embarrasses it. A string of 55-plus ISM prints without a matching lift in industrial production would make me suspect the survey is picking up price and delivery stress more than physical volume.
What to watch next: ISM, jobs, CPI and the Fed
The next five weeks are packed. All dates below are from the BLS release schedule, the Fed calendar and cross-checked against FedRateCalc, The Right Trader and FinanceCalendar. ISM dates are listed as estimates until ISM confirms them.
- Tuesday, Nov. 3, 10:00 AM ET: JOLTS for September. Openings tell you whether the hiring softness in the ISM employment gauge is broad.
- Wednesday, Nov. 4, 10:00 AM ET: ISM services PMI. Services is most of the economy. Watch its prices index next to today’s 75.2.
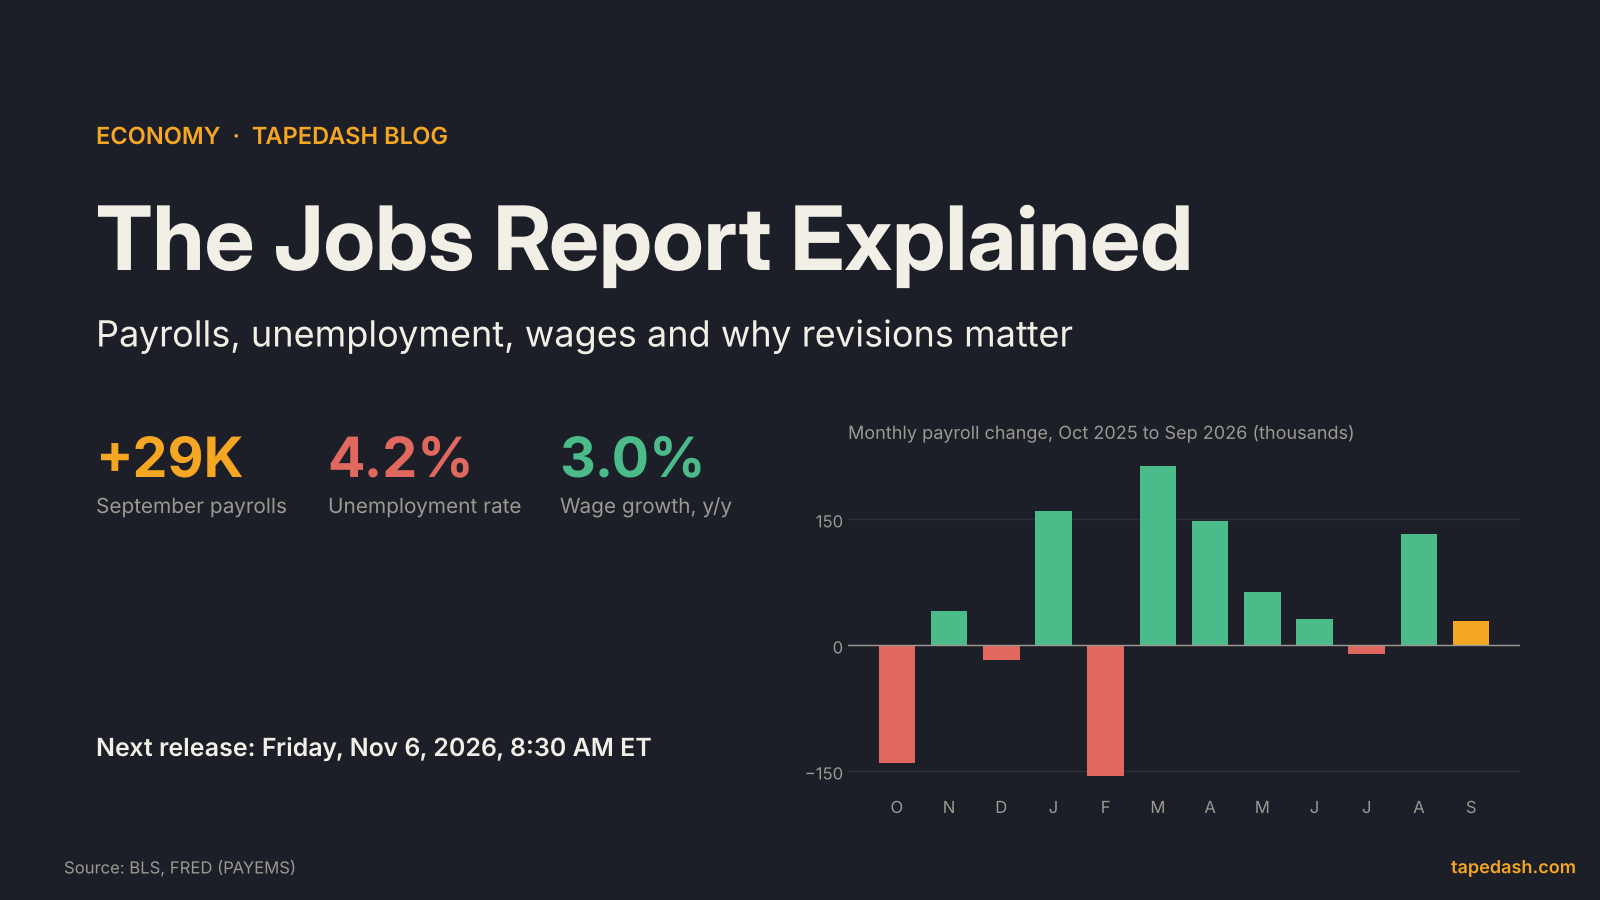
- Friday, Nov. 6, 8:30 AM ET: October jobs report. Manufacturing payrolls should line up with ISM employment above 50.
- Tuesday, Nov. 10, 8:30 AM ET: October CPI. Look at core goods for signs of factory costs passing through. Our CPI reading guide covers which lines matter.
- Friday, Nov. 13, 8:30 AM ET: October PPI. The middle of the pipeline between ISM prices and CPI.
- Tuesday, Dec. 1, 10:00 AM ET: November ISM manufacturing. The next read on whether prices keep cooling.
- Tuesday and Wednesday, Dec. 8 to 9: FOMC meeting, with a new Summary of Economic Projections.
Frequently asked questions
What does an ISM manufacturing PMI of 55.5 mean?
It means more purchasing managers reported improvement than deterioration across new orders, output, hiring, deliveries and inventories. Anything above 50 signals expansion in manufacturing. A 55.5 reading points to broad growth, but it measures how widespread the gains are, not how big they are.
Is the ISM prices index a measure of inflation?
Not directly. It measures how many manufacturers are paying more for inputs, not by how much. It tends to lead the producer price index and goods inflation in the CPI by a few months, which is why economists and the Fed treat it as an early warning signal.
When is the next ISM manufacturing report?
The November 2026 report is scheduled for Tuesday, Dec. 1, 2026 at 10:00 AM ET, based on ISM’s first-business-day pattern. ISM services for October comes out Wednesday, Nov. 4.
How we track the ISM story at TapeDash
If you want to follow whether this factory strength turns into a rates problem, the trick is watching the reaction across markets, not just the print. On the desk we line up three things on ISM mornings: the move in Treasury yields in the first 15 minutes, how industrials and materials trade against the Nasdaq, and whether options traders start paying up for downside protection in rate-sensitive names.
The TapeDash Terminal Preview puts the economic calendar, sector moves and unusual options activity on one screen, so you can see whether a hot prices index is getting priced into yields and growth stocks in real time. The Live Scanner flags the industrial and materials names seeing the heaviest call or put flow after a release like this. If you’d rather get the morning version in your inbox, the free TapeDash Daily covers each week’s key releases and what moved. And for anyone thinking about going further, the first 200 members lock Pro at $69.99 a month on their account, even if they cancel and come back later.
The one thing to remember
October’s ISM report says American factories are busy, and the breadth is real. Production is at its highest since November 2021 and twelve industries grew. But the headline is the easy part to read. The prices index at 75.2 is the part that decides how the Fed sees this strength. Watch whether it keeps falling on Dec. 1. If it does, a strong factory sector is good news. If it doesn’t, it’s a reason for rates to stay higher for longer.
See it on the tape, not just in the headlines
TapeDash is the research desk for traders and investors: live options flow, dealer positioning, a real-time market scanner and trade alerts graded in public. Memberships open January 1, 2027, and the first 200 members lock Pro at $69.99 a month on their account, even if they cancel and come back later.
Join the waitlistClick through the terminalSee the track recordSources
- ISM via PR Newswire: Manufacturing PMI at 55.5%; October 2026 ISM Manufacturing PMI Report (Nov 2, 2026)
- TD Economics: U.S. ISM Manufacturing Index, October 2026 (Nov 2, 2026)
- Bloomberg via Transport Topics: Factory production grows most since 2021 (Nov 2, 2026)
- Verified Investing: ISM Manufacturing PMI October 2026, 55.5 beat, prices still at 75.2 (Nov 2, 2026)
- Breitbart Business: U.S. manufacturing beats forecasts as production accelerates (Nov 2, 2026)
- Yahoo Finance: Stock market today, Monday November 2 (Nov 2, 2026)
- AP via KRMG: How major US stock indexes fared Monday 11/2/2026
- Fat Tail: ISM Manufacturing October 2026, factories expand (Nov 2, 2026)
- Bureau of Labor Statistics: 2026 release schedule
- Federal Reserve: FOMC meeting calendars
- FedRateCalc: U.S. economic calendar, November 2026
- The Right Trader: ISM Services PMI release dates 2026
- The Right Trader: ISM Manufacturing PMI release dates 2026
- FinanceCalendar: US ISM Manufacturing PMI schedule
This article is for educational and informational purposes only. It is not financial, investment, medical or legal advice, and it is not a recommendation to buy or sell any security. Figures come from the sources listed and were checked on the date of publication; markets change quickly. Options trading involves substantial risk of loss.