Employment Cost Index Q3 2026: What Cooler Labor Costs Mean for the Fed
The Employment Cost Index rose 0.8% in Q3 2026 as wage growth cooled. What the ECI measures, why the Fed watches it, and what it means for December.
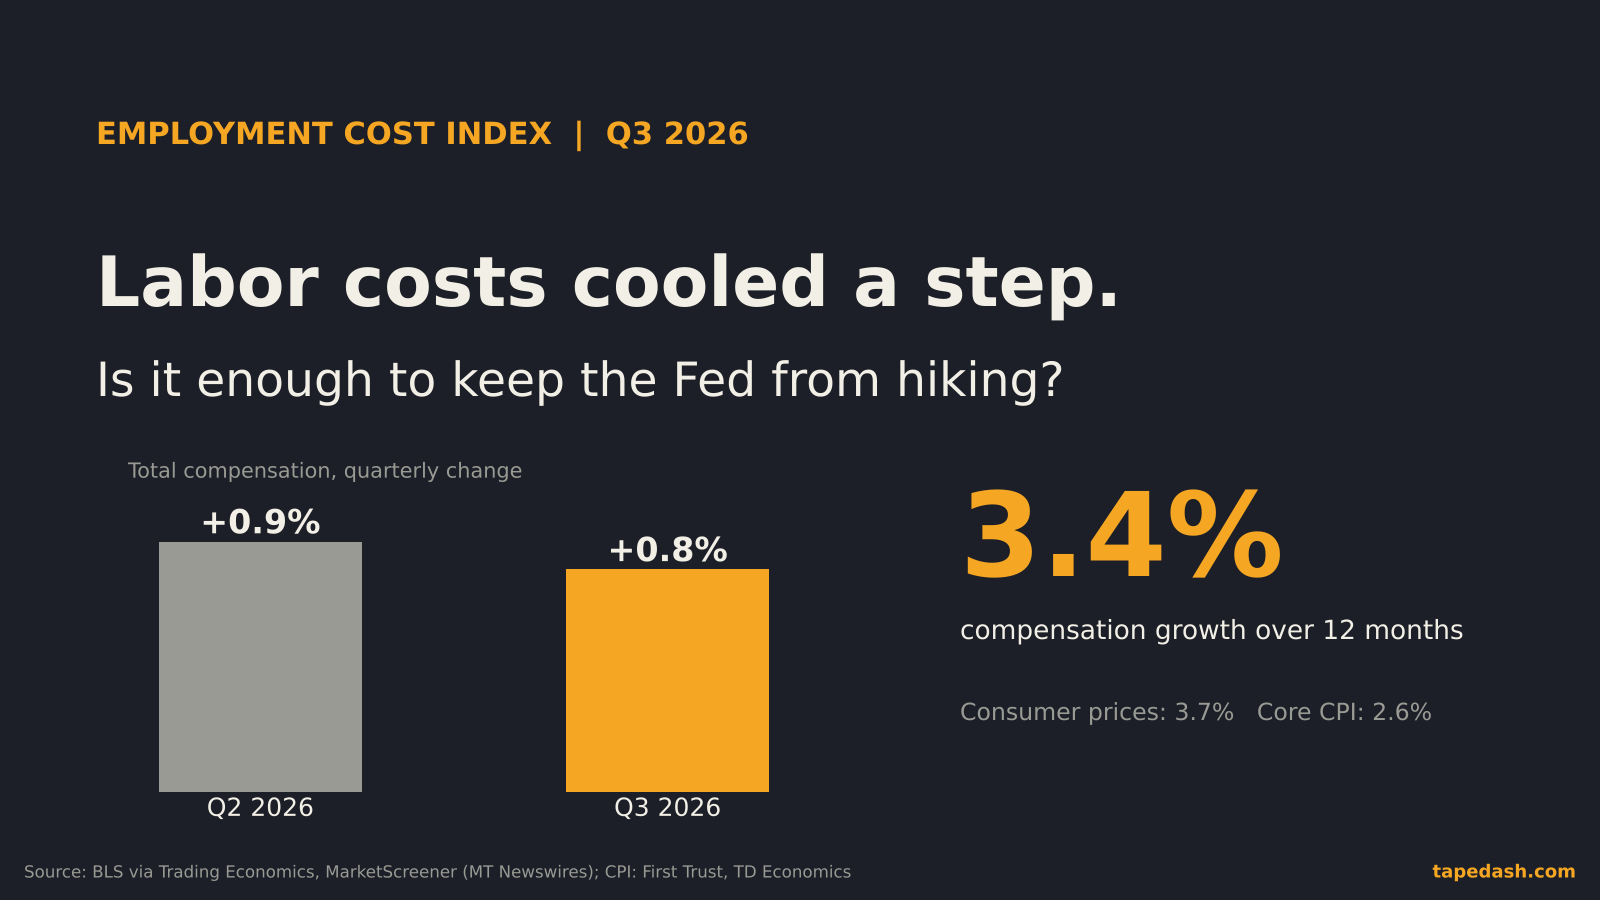
The Employment Cost Index rose 0.8% in the third quarter of 2026, the Bureau of Labor Statistics reported Friday morning. That matched what economists expected and was a small step down from 0.9% in the second quarter. Over the past 12 months, the cost of employing a civilian worker, counting both pay and benefits, rose 3.4%, according to Trading Economics and TokenPost.
On a day when Intel’s warning took the chip stocks apart, almost nobody on a trading floor talked about this report. That is a mistake I see every quarter. The ECI is the labor-cost number the Federal Reserve trusts most, and the Fed is now openly weighing a rate hike at its December 8 to 9 meeting. Friday’s report is one of the inputs that decides it.
The short answer to what it means: labor costs are cooling, slowly, and wage growth in particular slowed more than the headline shows. That makes it harder to argue that wages are pushing inflation higher. It does not take a December hike off the table, because the Fed’s problem this fall is energy-driven headline inflation, not runaway pay. This piece covers what the ECI measures, why it differs from the wage number in the jobs report, how to read it, and what comes next.
- The Employment Cost Index rose 0.8% in Q3 2026, in line with forecasts and down from 0.9% in Q2. Over 12 months, compensation rose 3.4%.
- Wages and salaries slowed the most, to 0.7% for the quarter from 0.9%, and are up 3.1% from a year earlier.
- Pay is running behind consumer prices (3.7%) but ahead of core inflation (2.6%), so the wage-price story is mixed rather than alarming.
- The ECI matters because it holds the job mix fixed and includes benefits, which makes it the Fed’s cleanest read on labor costs.
- Next tests: the October jobs report on Nov 6, October CPI on Nov 10, then the Fed’s decision on Dec 9.
What the Employment Cost Index measures
The Employment Cost Index is a quarterly survey of employers run by the Bureau of Labor Statistics. It asks what businesses and state and local governments pay for labor: wages and salaries, plus the cost of benefits such as health insurance, retirement contributions and paid leave. The result is an index of total compensation cost, published for civilian workers, private industry and state and local government, with wages and benefits broken out separately.
What makes the ECI different is that it follows the same set of jobs over time. It holds the mix of occupations and industries constant, so it answers a narrow question: what does it cost to employ the same kind of worker in the same kind of job as it did last quarter? That sounds like a technicality. It is the reason the Fed pays attention to it.
Two economists quoted by Marketplace made the same point from different angles: the ECI captures total compensation rather than wages alone, and it tends to lead inflation by months, because employers pass higher labor costs through to prices and higher pay feeds spending.
Employment Cost Index Q3 2026: the numbers
Here is the report in plain terms. Every component slowed.
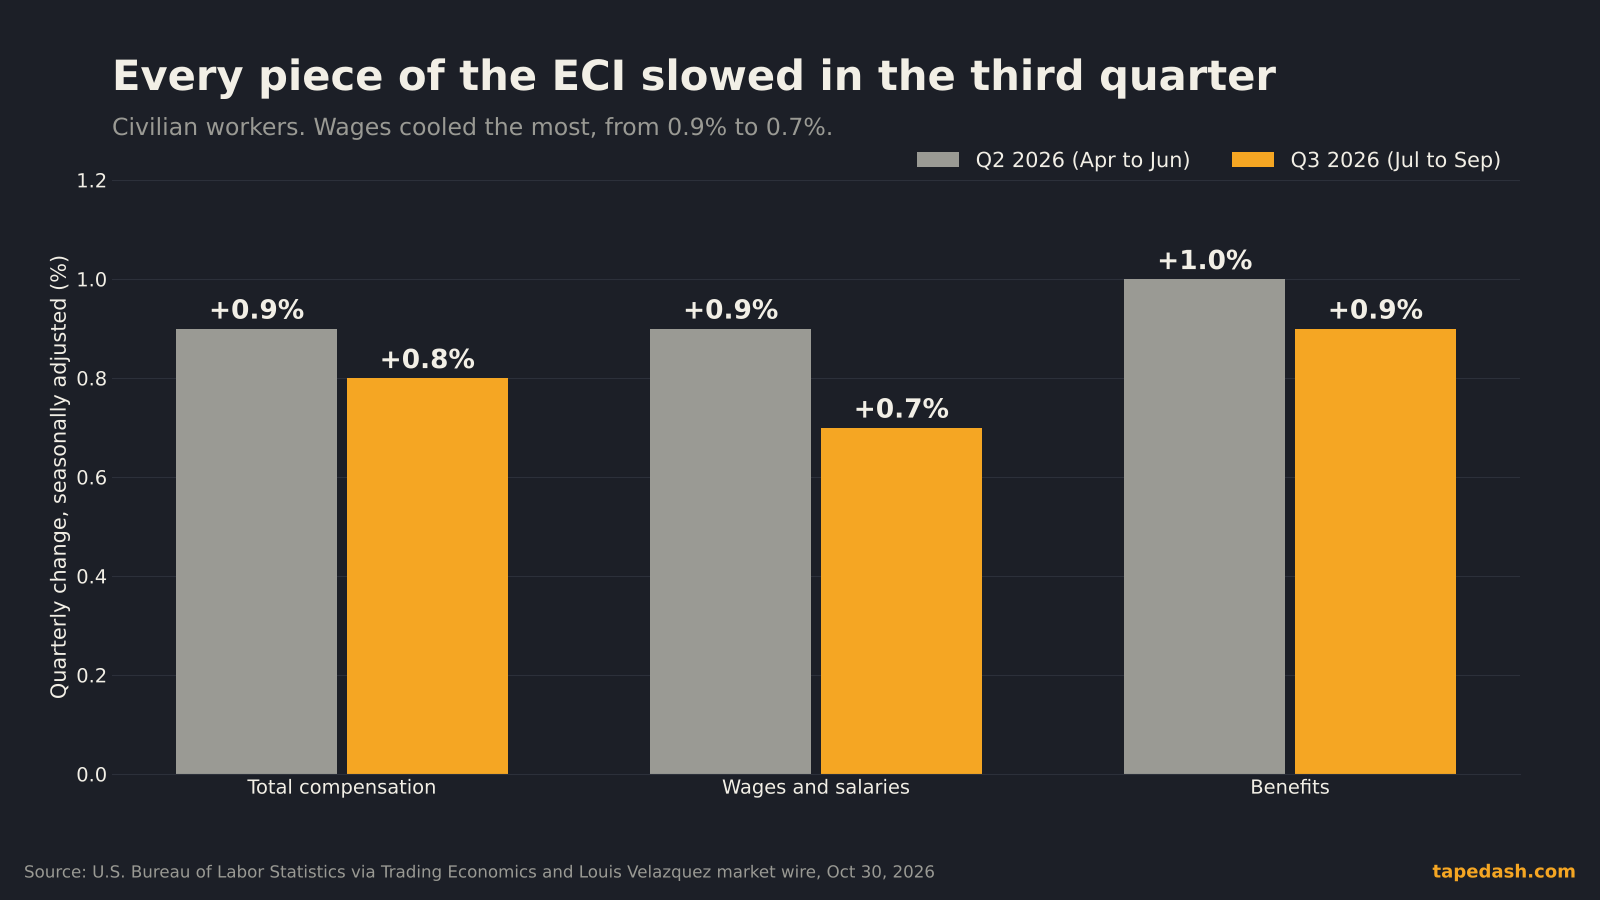
Total compensation for civilian workers rose 0.8% for the quarter, down from 0.9%. Wages and salaries, the largest piece, rose 0.7% after 0.9%. Benefits rose 0.9% after 1.0%. Private industry compensation, the part most tied to business pricing decisions, rose 0.8% after 0.9%. Those quarterly figures come from Trading Economics and the Louis Velazquez market wire, and the 0.8% headline matched the consensus forecast reported by MarketScreener.
On a 12-month basis, total compensation was up 3.4% and wages and salaries were up 3.1%.
| ECI measure (civilian workers) | Q2 2026, quarterly | Q3 2026, quarterly | 12 months to September |
|---|---|---|---|
| Total compensation | 0.9% | 0.8% | 3.4% |
| Wages and salaries | 0.9% | 0.7% | 3.1% |
| Benefits | 1.0% | 0.9% | Not two-sourced |
| Private industry, total compensation | 0.9% | 0.8% | Not two-sourced |
The detail I would underline is the gap between wages and benefits. Wages slowed by two tenths in one quarter. Benefits slowed by one. When benefits run hotter than wages, it usually points to health insurance and other non-wage costs, which employers feel but workers rarely see in a paycheck. Those costs still show up in prices.
ECI vs average hourly earnings: why the Fed prefers the ECI
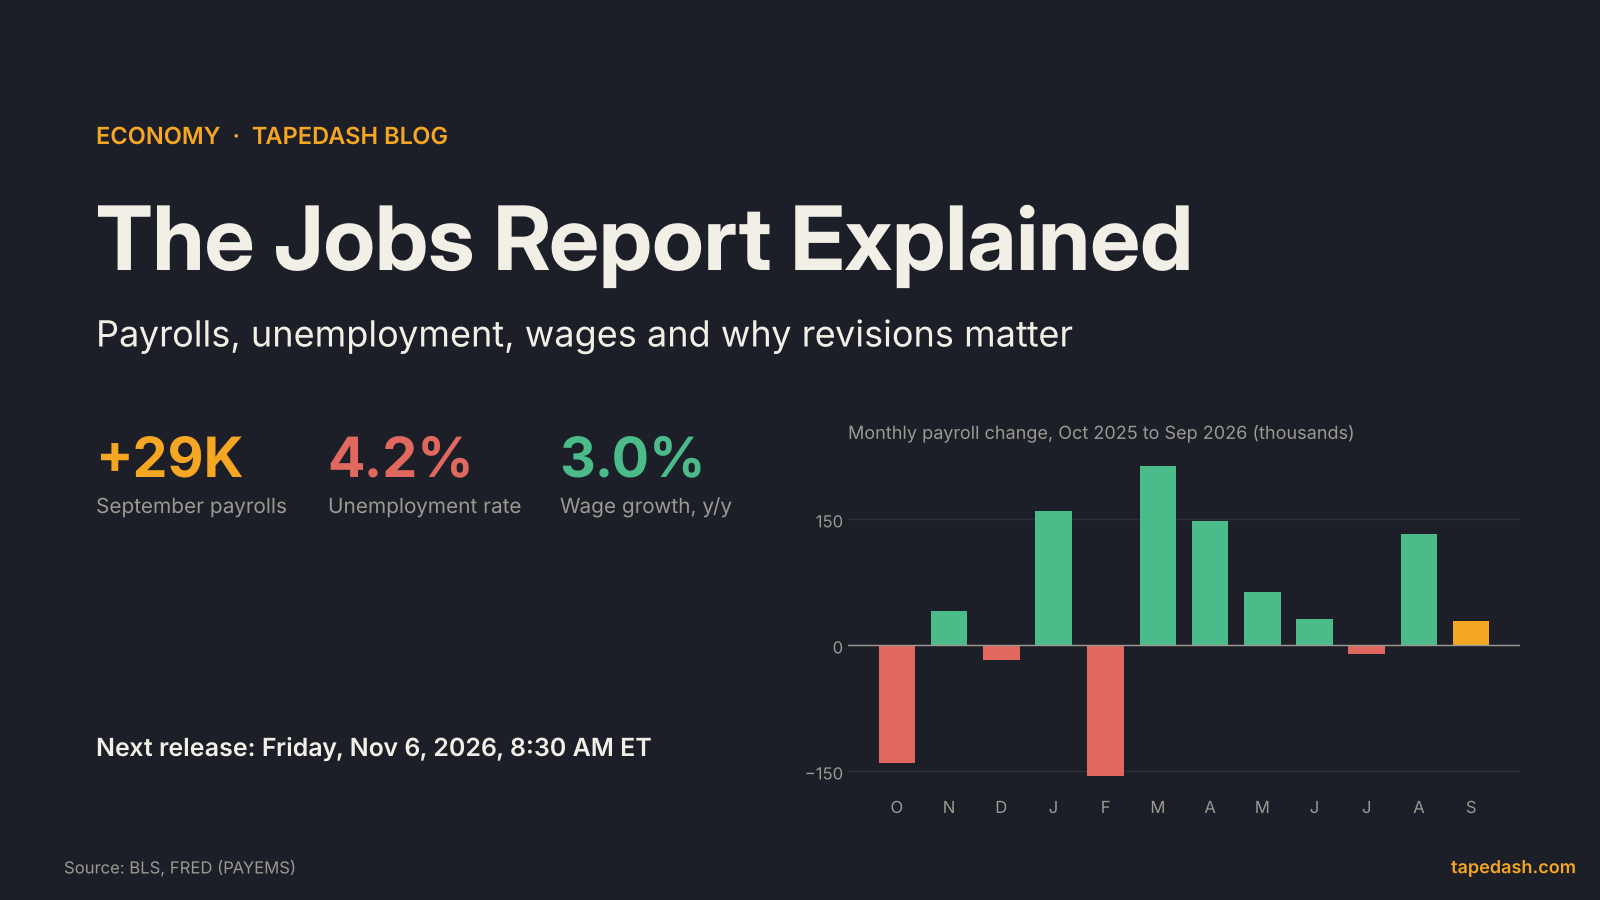
Most people get their wage news from the monthly jobs report, which includes average hourly earnings. In September, average hourly earnings were up 3.0% from a year earlier, which we covered in our jobs report explainer. So why does a quarterly survey that arrives a month after the quarter ends carry more weight with the Fed?
The composition problem
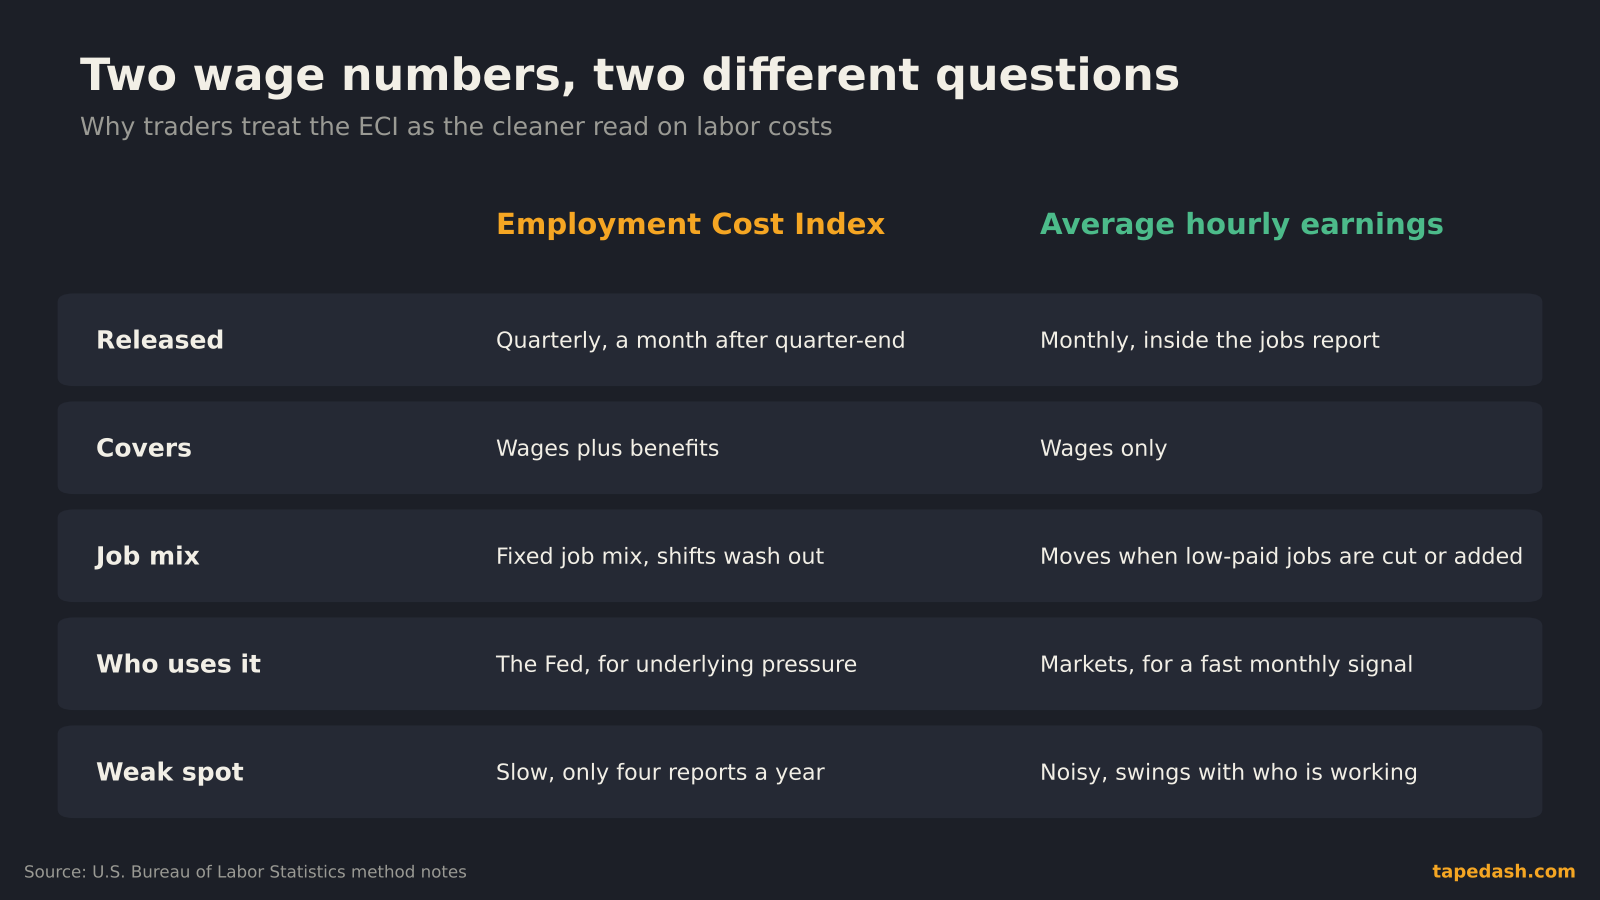
Average hourly earnings is a simple average across everyone on a payroll. If a wave of low-paid workers loses their jobs, the average rises even though nobody got a raise. That happened in 2020, when average hourly earnings jumped as lower-paid service jobs disappeared. The ECI does not have that problem, because it holds the job mix fixed. When the ECI rises, it means the same job costs more.
Benefits count
Health insurance, retirement contributions and paid leave are real labor costs. Average hourly earnings ignores them. The ECI includes them. For a company setting prices, the full cost of an employee is what matters, so the ECI is closer to the number a CFO actually budgets.
The tradeoff
The ECI is slow. Four reports a year, each covering a quarter that ended a month earlier. That is why markets still react more to average hourly earnings on jobs day. The two are best used together: the jobs report for speed, the ECI to confirm whether the trend is real.
| Measure | How often | Covers | Main strength | Main weakness |
|---|---|---|---|---|
| Employment Cost Index | Quarterly | Wages plus benefits | Fixed job mix, full cost | Slow, few data points |
| Average hourly earnings | Monthly | Wages only | Fast, inside the jobs report | Distorted by shifts in who is working |
| Consumer Price Index | Monthly | Prices paid by consumers | The inflation the public feels | Energy and food swing it |
| Core CPI | Monthly | Prices excluding food and energy | Closer to underlying inflation | Still noisy month to month |
Are wages causing inflation right now
This is the question the report was supposed to help answer, and the answer this quarter is: probably not much.
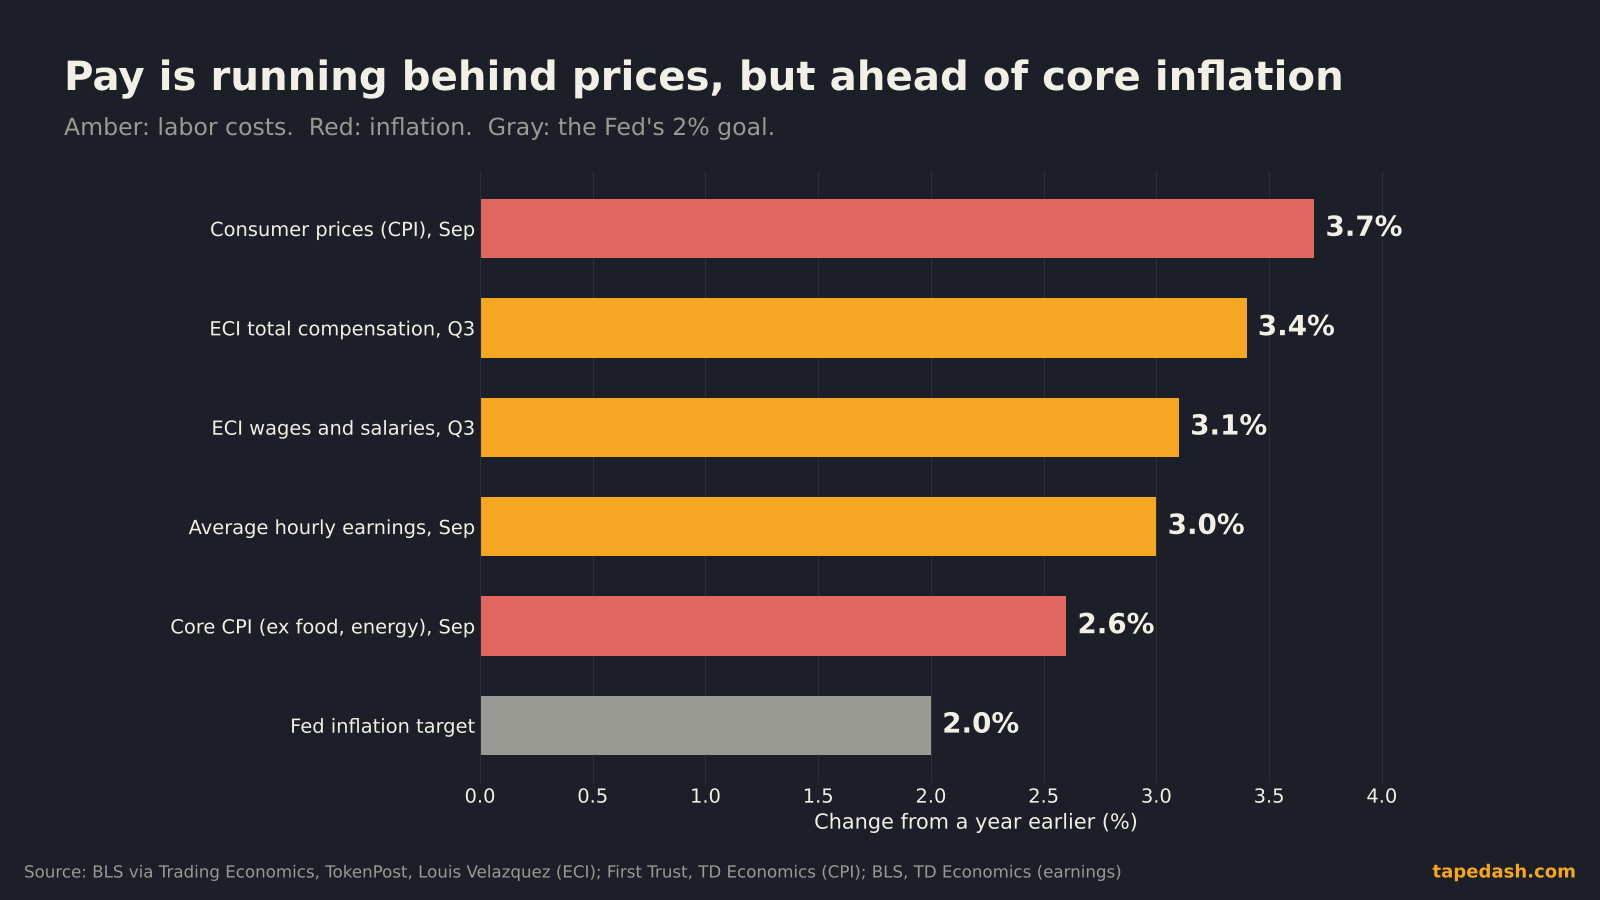
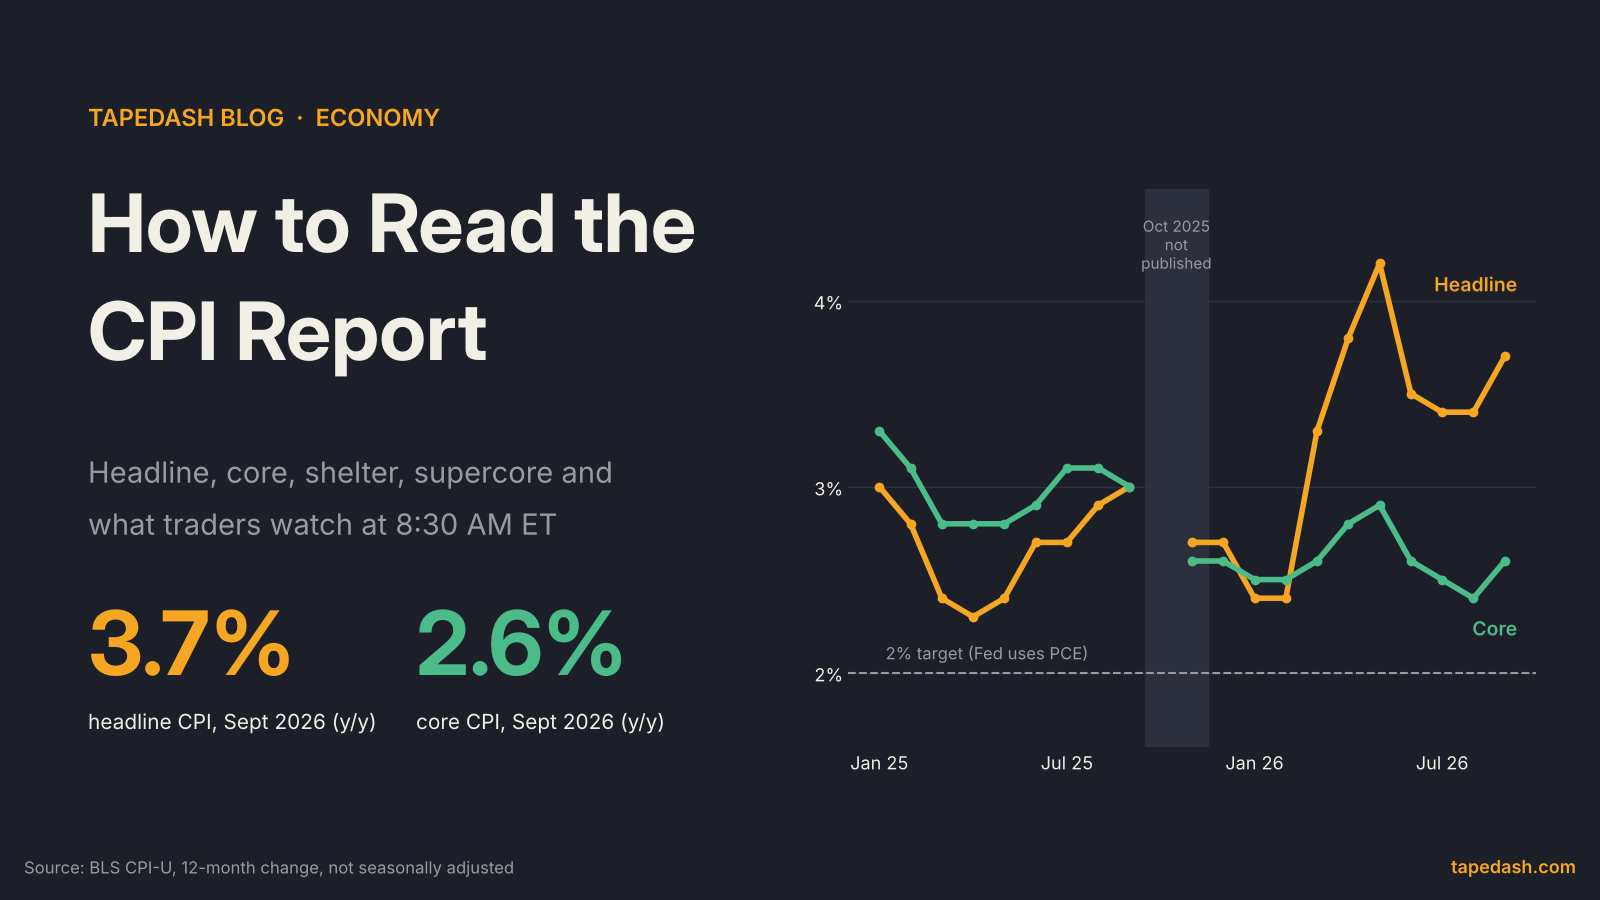
Look at where the numbers sit. Consumer prices rose 3.7% in the year to September, according to First Trust and TD Economics. Core CPI, which strips out food and energy, rose 2.6%. Labor costs fall between them: 3.4% for total compensation, 3.1% for wages, 3.0% for average hourly earnings.
If wages were driving inflation, you would expect pay to be running ahead of overall prices and pulling core inflation up behind it. That is not the picture. Pay is trailing headline inflation, which means many workers lost purchasing power over the past year. Headline inflation is being pushed up by energy, which wages cannot explain. Core inflation sits below wage growth, which is roughly what you would expect in a normal economy where productivity gains let pay rise faster than prices.
That last point deserves a careful word. Core inflation did tick up in September, from 2.4% to 2.6%, and it beat forecasts. Labor costs running near 3.4% leave some room for core to keep drifting higher if companies decide to rebuild margins. So the honest reading is “wages are not the fire, but they are not putting it out either.”
How labor costs turn into inflation
The link between pay and prices runs through a step most headlines skip: productivity.
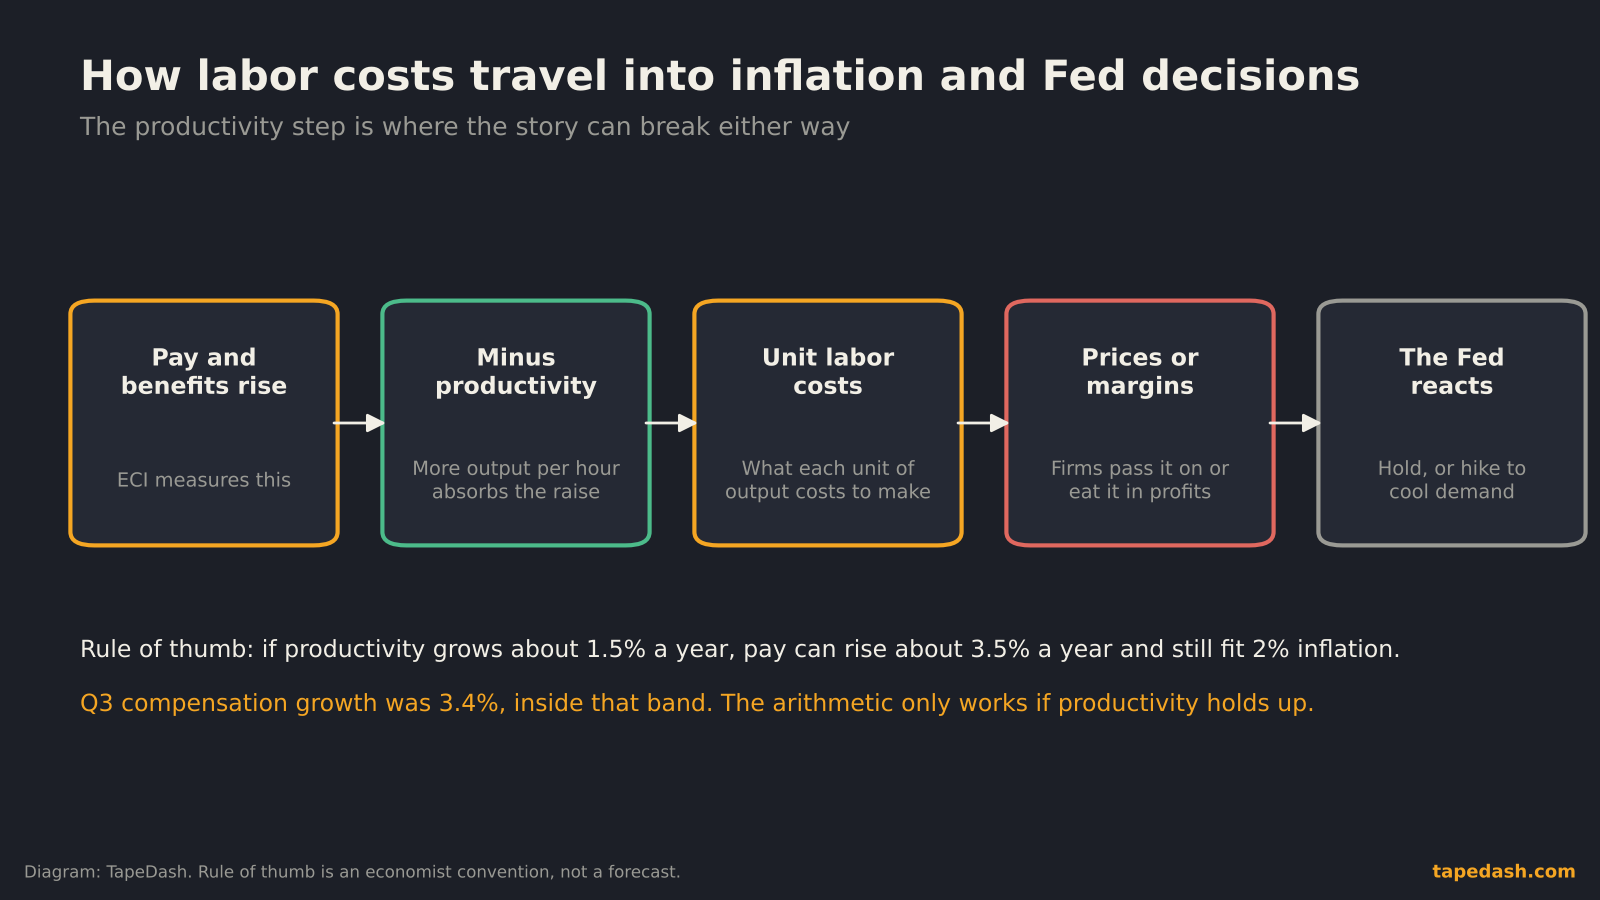
When workers produce more per hour, a company can pay them more without raising the cost of each unit it sells. Economists call the cost per unit of output “unit labor costs,” and that is the version of labor cost that actually pressures prices. A common rule of thumb goes like this: if productivity grows about 1.5% a year, pay can grow about 3.5% a year and still be consistent with 2% inflation. That is a convention, not a law, and productivity growth bounces around a lot. But it gives you a frame.
By that frame, 3.4% compensation growth is roughly where it should be for a 2% inflation economy. In 2022, when labor costs were rising at their fastest pace in decades, the ECI was well outside that band, and the Fed treated it as a central reason to keep hiking. This quarter’s number does not look like that.
The other exit in the diagram is margins. If companies cannot raise prices, they absorb higher labor costs and profits shrink. Either outcome matters to investors. Higher prices keep the Fed tight. Thinner margins hit earnings. When I read an ECI report, I am asking which of those two the market should worry about next.
What this means for a December rate hike
The Fed held its target range at 3.75% to 4.00% on October 28 after raising it in September, according to Admiral Markets and Raisin. Futures traders continue to treat a December hike as more likely than not. We walked through that setup in our piece on the October Fed decision.
Friday’s ECI fits a slightly softer story. A hawk at the Fed wants to see wages accelerating, because that suggests inflation will stick even after energy calms down. This report shows the opposite: wage growth slowing, benefits slowing, the headline in line. It is the kind of number a dovish official cites when arguing that the September hike may be enough.
It is not decisive, for two reasons. First, the Fed’s concern this fall has been headline inflation near 3.7%, and energy drove much of that. The ECI does not speak to energy at all. Second, one quarter of slowing is one data point. The Fed will want to see whether October’s jobs report and October’s CPI agree with it.
Three ways the next five weeks can go
Labor and inflation both cool. October payrolls stay soft, average hourly earnings slow, and core CPI holds near 2.6%. The case for a December hike weakens, and the bond market would likely start pricing a hold. Rate-sensitive stocks such as homebuilders and small caps tend to benefit in that setup.
Labor cools, inflation does not. Wages stay calm but CPI rises again on energy. That is the uncomfortable mix the Fed faced in October. A hike stays likely, but the message would focus on inflation expectations rather than wages.
Labor reheats. Average hourly earnings jump and payrolls surprise higher. Then Friday’s ECI looks stale, and the hawks have their argument. Short-term Treasury yields would likely move up first, and the dollar with them.
How to read an ECI report yourself
The release comes out at 8:30 AM ET, four times a year. It is dense, but you only need a handful of lines.
Start with civilian total compensation, quarterly change, seasonally adjusted. That is the headline. Compare it with the consensus forecast and the prior quarter. A miss of one tenth matters more for the ECI than for most data, because the series is smooth.
Then split wages from benefits. If benefits are driving the number, look to health care costs. If wages are driving it, the labor market is tighter than the jobs report suggests.
Check private industry wages and salaries. This is the piece most closely tied to how businesses price their goods and services. Fed officials often cite it on its own.
Compare the 12-month change with core inflation. If labor costs run well above core inflation plus a reasonable productivity allowance, expect pressure on prices or margins later. If they run near it, the labor market is not the problem.
Finally, watch the two-year Treasury yield in the first 30 minutes. The two-year is the market’s best read on near-term Fed policy. If it barely moves on an in-line ECI, the report confirmed what the market already believed. A sharp move means the number changed someone’s view of the next meeting.
What to watch next
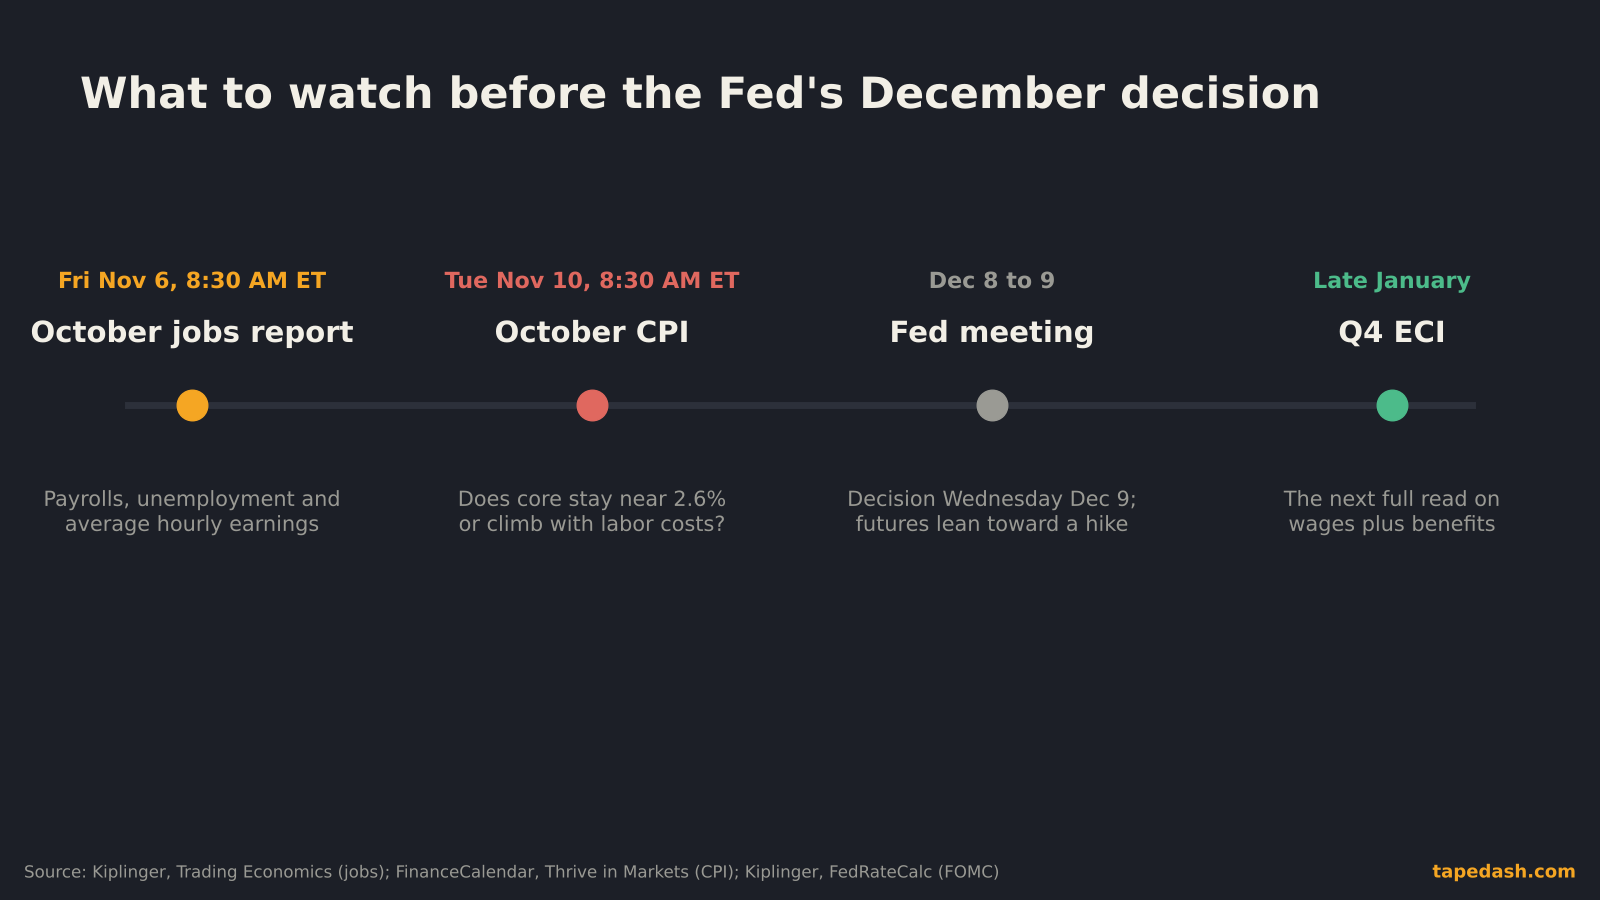
Friday, Nov 6, 8:30 AM ET: the October jobs report. Payrolls, the unemployment rate and average hourly earnings. September’s unemployment rate was 4.2%, according to the Bureau of Labor Statistics and TD Economics. The wage line is the direct follow-up to Friday’s ECI. The date is on both the Kiplinger and Trading Economics calendars.
Tuesday, Nov 10, 8:30 AM ET: October CPI. Confirmed by FinanceCalendar and Thrive in Markets. Watch core CPI first. If it climbs again from 2.6%, the softer ECI will matter less. If you want a refresher on the release itself, our guide to reading the CPI report breaks down each line.
December 8 to 9: the Fed’s final meeting of 2026. The decision comes on Wednesday, December 9, per Kiplinger and FedRateCalc. This meeting also brings updated economic projections.
Late January: the fourth-quarter ECI. It will be the first full read on labor costs after whatever the Fed decides in December. The BLS release schedule lists the exact date.
How to track this on TapeDash
If you want to follow whether labor costs and inflation keep moving apart, this is what we watch. The economic calendar inside the Terminal Preview lists each release with its forecast and prior reading, so you can see the bar a report has to clear before 8:30 AM. On data mornings, the Live Scanner shows which sectors react first, which is usually the quickest way to tell whether the market read a number as a Fed story or a growth story.
On the positioning side, Flow Signals and Large Prints show when large traders put on bets in rate-sensitive names and Treasury ETFs ahead of data like this, and every trade alert we publish is graded in public on our track record, wins and losses included. The free TapeDash Daily covers reports like the ECI each weekday evening in plain English.
FAQ
What is the Employment Cost Index?
The Employment Cost Index is a quarterly Bureau of Labor Statistics survey of what employers pay for labor, including wages, salaries and benefits. It holds the mix of jobs constant, so it measures how much the cost of the same job changes over time.
What did the Q3 2026 ECI show?
Total compensation for civilian workers rose 0.8% in the third quarter, in line with forecasts and down from 0.9% in the second quarter. Wages and salaries rose 0.7%, and compensation was up 3.4% over 12 months.
Why does the Fed watch the Employment Cost Index?
Because it is the cleanest measure of labor-cost pressure. Unlike average hourly earnings, it is not distorted when low-paid or high-paid workers enter or leave the workforce, and it includes benefits. Fed officials use it to judge whether wage growth is consistent with 2% inflation.
The one idea to keep
Friday’s Employment Cost Index said labor costs are cooling at the edges, with wages slowing more than the headline. That weakens the argument that pay is driving inflation, but the Fed’s December decision now rests on whether energy-led inflation spreads into core prices. Watch the November 6 wage number and the November 10 core CPI. If both stay calm, Friday’s quiet report will look like the first sign the Fed’s hiking is close to done.
See it on the tape, not just in the headlines
TapeDash is the research desk for traders and investors: live options flow, dealer positioning, a real-time market scanner and trade alerts graded in public. Memberships open January 1, 2027, and the first 200 members lock Pro at $69.99 a month on their account, even if they cancel and come back later.
Join the waitlistClick through the terminalSee the track recordSources
- Trading Economics: United States Employment Cost Index (Q3 2026)
- MarketScreener (MT Newswires): Q3 US Employment Cost Index rises as expected, wages and benefits growth both slow
- Marketplace: The cost of employing a worker rose .8% in Q3. What's that mean for inflation?
- TokenPost: U.S. Employment Cost Index rises 0.8% in Q3, slowing from Q2
- Louis Velazquez: US employment cost index for Q3 +0.8% vs +0.8% expected
- Rallies: U.S. Q3 employment costs data
- U.S. Bureau of Labor Statistics: Schedule of releases for the Employment Cost Index
- First Trust: The Consumer Price Index rose 0.6% in September
- TD Economics: U.S. Consumer Price Index, September 2026
- TD Economics: U.S. Employment, September 2026
- U.S. Bureau of Labor Statistics: The Employment Situation, September 2026
- Admiral Markets: FOMC October 2026, Fed holds rates as markets price a December hike
- Raisin: Fed holds interest rates at 3.75% to 4.00%
- Kiplinger: October 2026 Fed meeting live updates and commentary
- FedRateCalc: FOMC meeting schedule, December 2026
- FinanceCalendar: US CPI report, November 2026
- Thrive in Markets: CPI release dates 2026
- Kiplinger: This week's economic calendar
- Trading Economics: Economic calendar, week of Nov 2, 2026
This article is for educational and informational purposes only. It is not financial, investment, medical or legal advice, and it is not a recommendation to buy or sell any security. Figures come from the sources listed and were checked on the date of publication; markets change quickly. Options trading involves substantial risk of loss.