October PPI 2026: Why Wholesale Inflation Hit a Four-Year High
October PPI rose 6.5% from a year ago, the most since 2022, even as the monthly pace cooled. What drove wholesale inflation and what it means for the Fed.
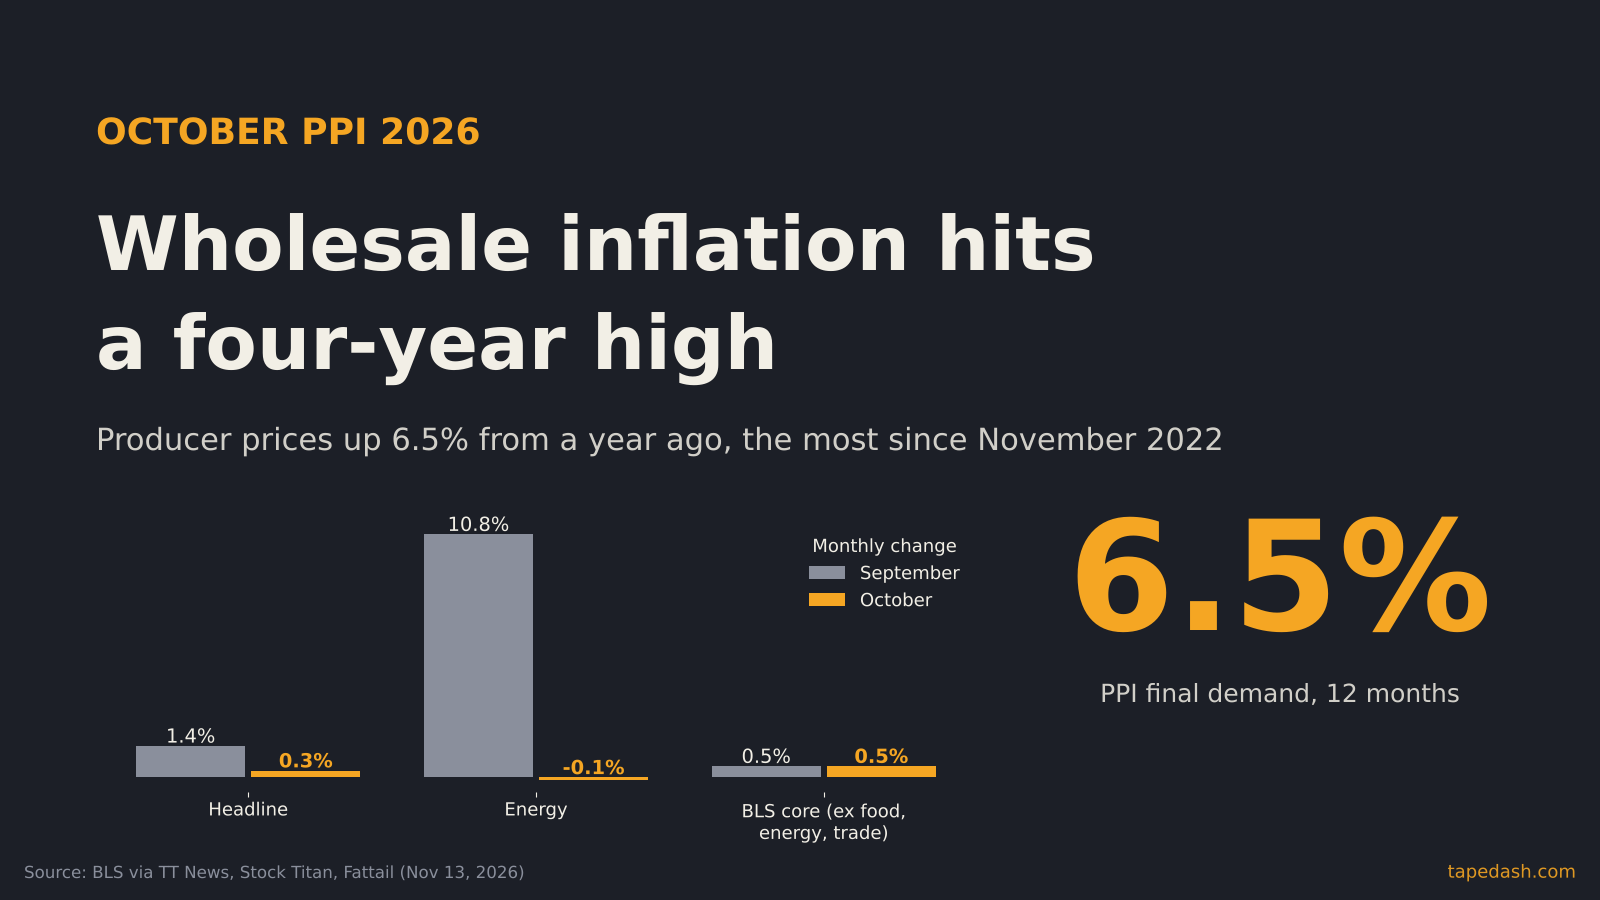
The October PPI report landed Friday morning with a split personality. Producer prices for final demand rose 0.3% in October, a tenth below what forecasters expected and a big step down from September’s revised 1.4% jump. But measured against a year earlier, wholesale inflation climbed to 6.5%, the fastest 12-month pace since November 2022 (Stock Titan, Fattail).
So which is it, cooling or heating? The short answer: the energy spike that drove September faded, but the prices underneath it did not. The Bureau of Labor Statistics’ preferred core measure, which strips out food, energy and trade margins, rose 0.5% for a second straight month and sits at 4.9% from a year ago (TT News, Trading Economics). Freight costs jumped even as diesel fell. That is what a cost shock looks like when it starts moving downstream.
For anyone positioned around the Federal Reserve’s December 9 meeting, this report matters less for its headline than for its plumbing. The question is no longer whether energy pushed prices up. It did. The question is how much of that push has already been passed along to the goods and services that show up in consumer inflation over the next few months.
- October PPI rose 0.3% on the month (forecasts were 0.4%) and 6.5% from a year earlier, the highest annual rate since November 2022.
- The BLS core measure, excluding food, energy and trade services, rose 0.5% for the second month in a row and is up 4.9% year over year.
- Energy prices slipped 0.1% after September’s 10.8% surge, but transportation and warehousing rose 2.0% and truck freight 3.9%. That is the energy shock moving downstream.
- Markets still price roughly a 90% chance of a quarter-point Fed hike on December 9. The October PCE report on November 25 is the next real test.
October PPI 2026: the numbers in plain English
The producer price index measures what domestic businesses receive for the goods and services they sell. “Final demand” is the headline bucket: goods, services and construction sold to consumers, businesses that invest, government and exporters. Decades ago it was called the Wholesale Price Index, which is why the press still calls it wholesale inflation, even though wholesaling is now a small slice of what it covers.
Here is what October looked like.
Headline final demand rose 0.3% after a revised 1.4% gain in September. Economists had expected 0.4% on the month and 6.6% on the year (Stock Titan, Brisk Markets). So on the surface this was a slight downside miss.
Goods prices rose 0.5% and services rose 0.2%, the fifth straight monthly gain for services (Brisk Markets, Fattail). Inside goods, food jumped 1.3% while energy dipped 0.1%. Inside services, trade margins fell 0.2%, which held the services number down, while transportation and warehousing rose 2.0% (TT News, Fattail).
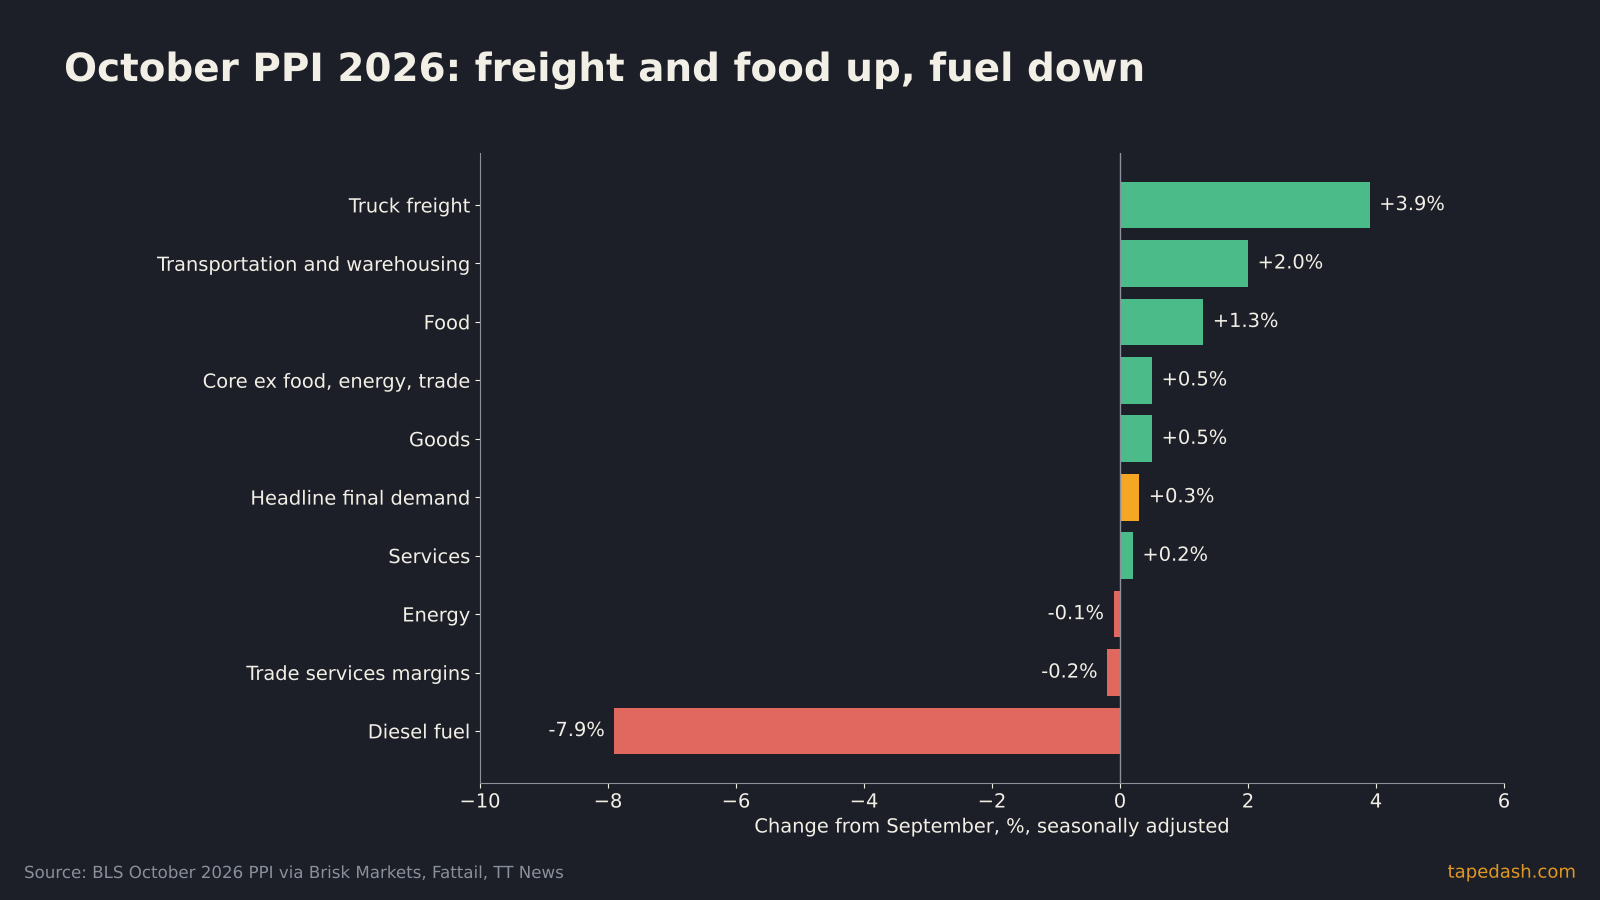
The single most telling pair of numbers in the release: diesel fuel fell 7.9% while truck freight transportation rose 3.9% (Brisk Markets, Fattail). The input got cheaper and the service that uses it got more expensive in the same month. Carl Weinberg of High Frequency Economics described transportation as the channel through which energy prices “bleed through” into core goods (TT News). October is a clean example.
Why wholesale inflation hit a four-year high while the monthly pace cooled
This is the part that confuses people every time, so it is worth slowing down.
The monthly figure you see in the headline is seasonally adjusted. The 12-month figure is not. They are calculated differently and answer different questions (Stock Titan preview, Fattail).
The yearly rate works like a rolling window. Every month, a new month enters the window and the same month from a year ago drops out. If the month coming in is bigger than the month going out, the yearly rate rises, even if the new month is smaller than the one right before it. October 2025 was a quiet month for producer prices. October 2026, at 0.3%, was not quiet enough to keep the yearly rate from rising, so the 12-month figure moved up from 6.3% in September to 6.5% (Trading Economics, TT News).
That is the “base effect,” and it is why I never trade a yearly inflation print without looking at what is about to roll off. If last year’s November and December were also soft, the 12-month rate can stay high even if the monthly pace keeps cooling. The base does a lot of the talking for the next two reports.
There is a second reason the 12-month number deserves attention right now. Consumer inflation had no clean yearly comparison this month. The October CPI report, released Tuesday, came without an annual rate because the 2025 government shutdown stopped most price collection for October 2025. PPI does have that comparison (Stock Titan preview, Fattail). I walked through that gap in October CPI 2026: Why There’s No Yearly Inflation Rate This Time. For now, PPI is one of the few official inflation gauges giving a full year-over-year read for October, so its 6.5% is carrying more weight in the narrative than it normally would.
The energy spike faded, but core PPI did not
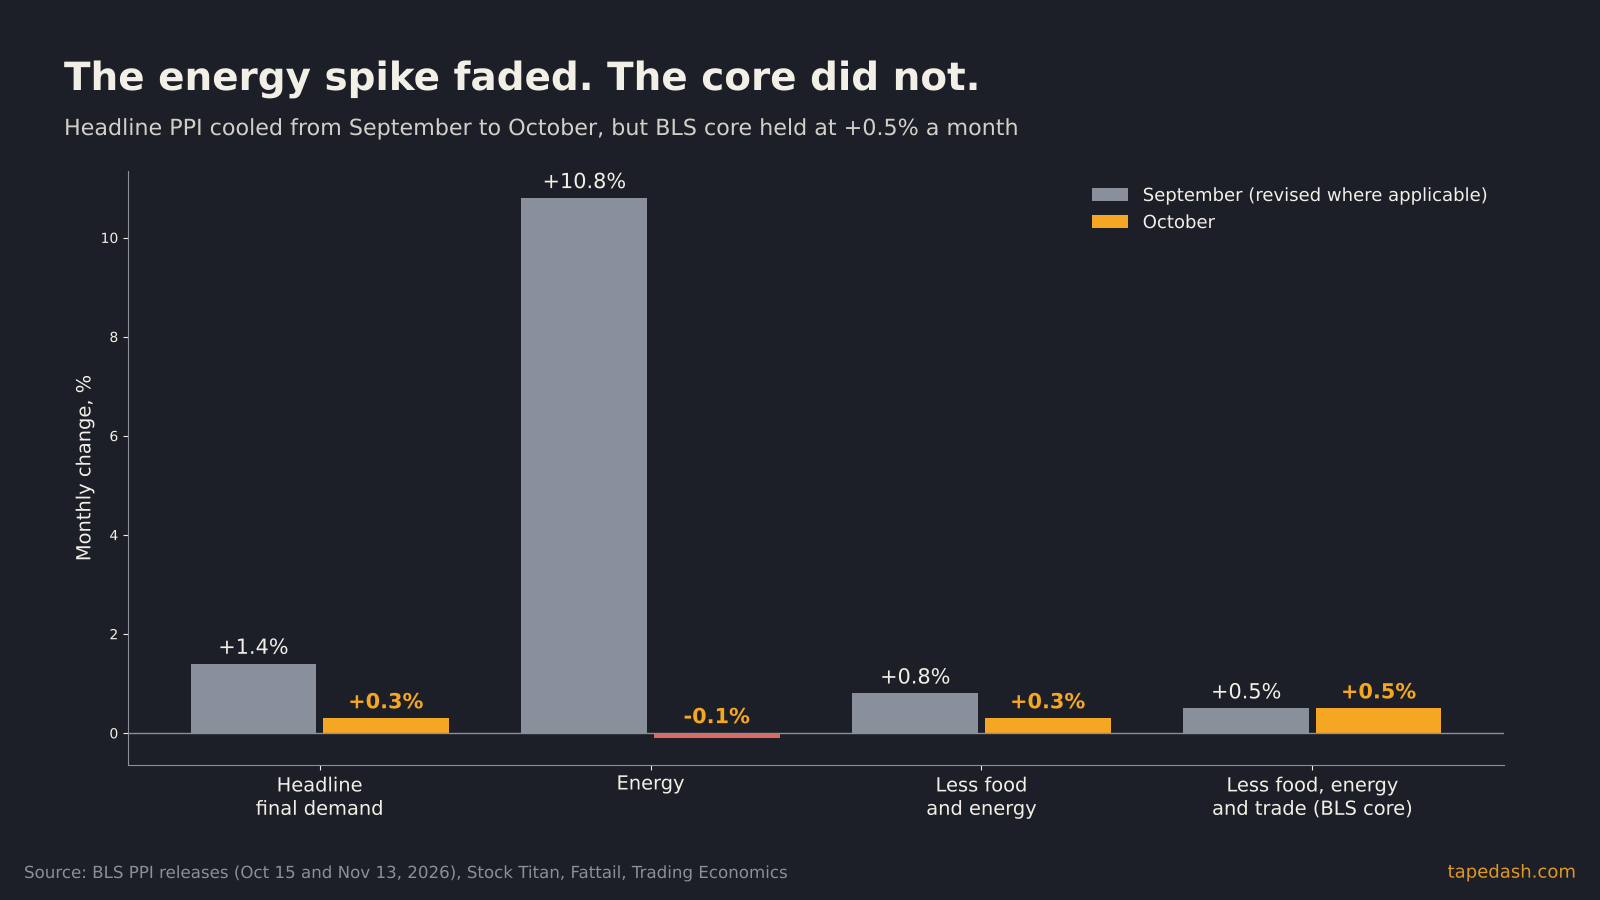
September’s report was an energy story. Final demand energy prices rose 10.8% that month and supplied the bulk of the goods increase (BLS, Stock Titan). In October that reversed slightly, with energy down 0.1%.
If energy were the whole story, core would have cooled along with the headline. It did not.
Three versions of core PPI, and which one to read
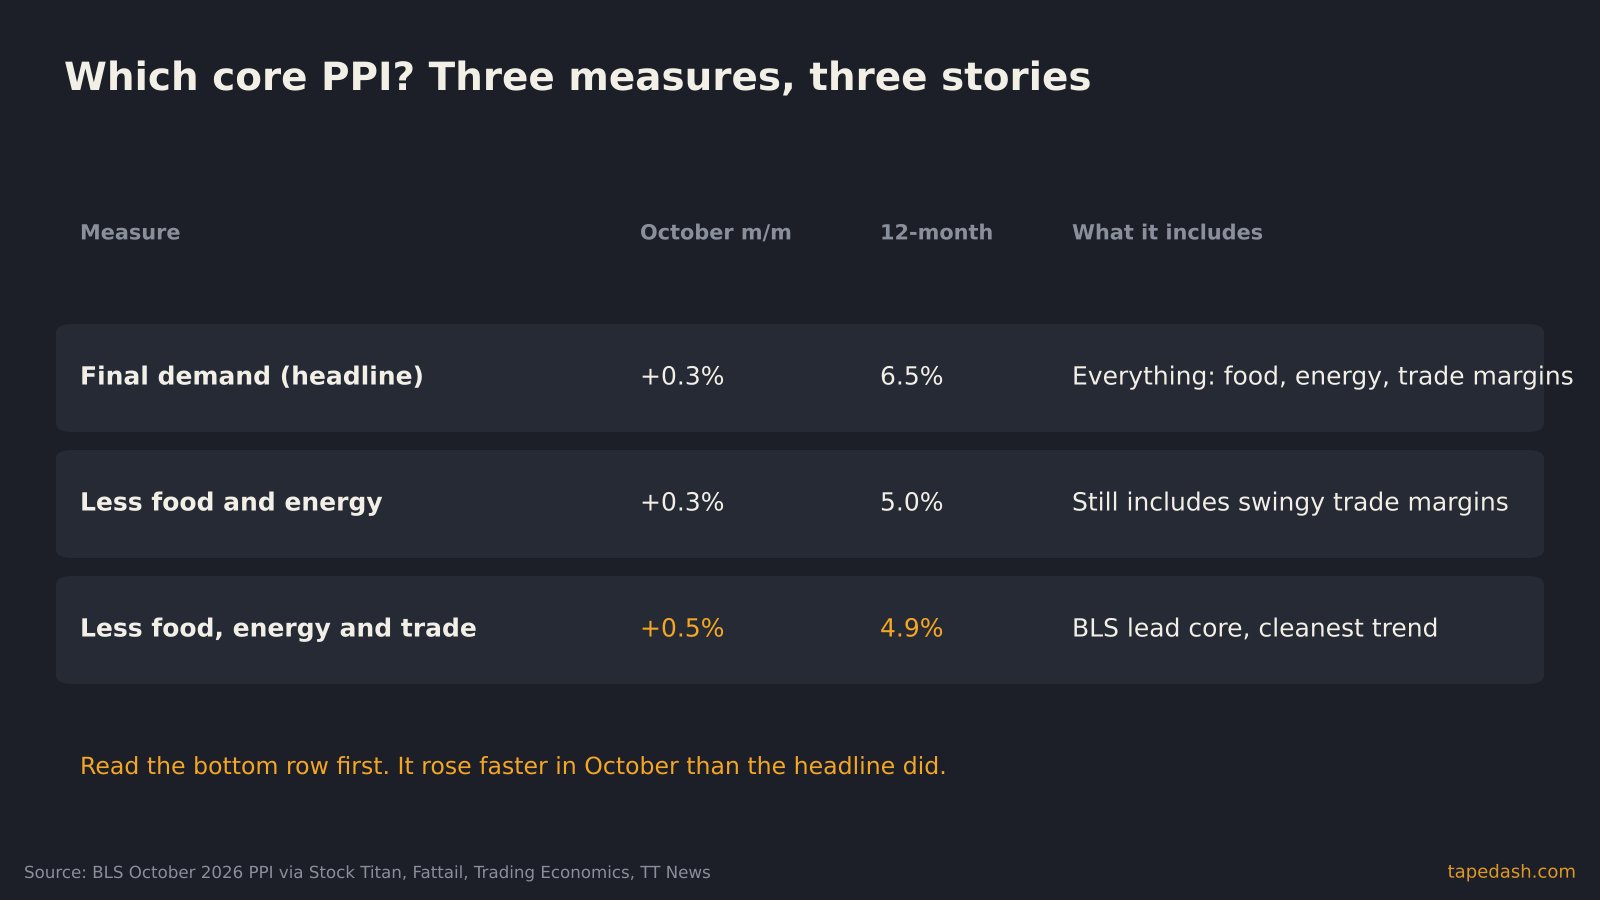
Part of the confusion in Friday’s headlines comes from the fact that there are two common “core” PPI measures, and they told different stories this month.
“Less food and energy” rose 0.3% in October and is up 5.0% from a year ago. “Less food, energy and trade services” rose 0.5% and is up 4.9% (Fattail, Trading Economics). The second one is the measure BLS leads with in its release. The difference is trade margins, which are the spread wholesalers and retailers earn between what they pay and what they charge. Those margins have whipsawed this year, with big drops and big gains in alternating months, and in October they fell 0.2% (Brisk Markets, Fattail).
When margins fall, it can mean businesses are absorbing cost increases instead of passing them on. That sounds good for inflation, but it rarely lasts if input costs keep climbing. Squeezed margins are often a leading indicator of price increases a few months later, once companies run out of patience. So a weaker trade-services number in October is not a reason to relax. It may be a reason to watch November and December more closely.
On the desk, when the two core measures split like this, we give more weight to the ex-trade version. It is less exciting and much more consistent month to month, which is exactly what you want from a trend gauge.
How energy prices pass through to core inflation
Here is the mechanism in one picture.
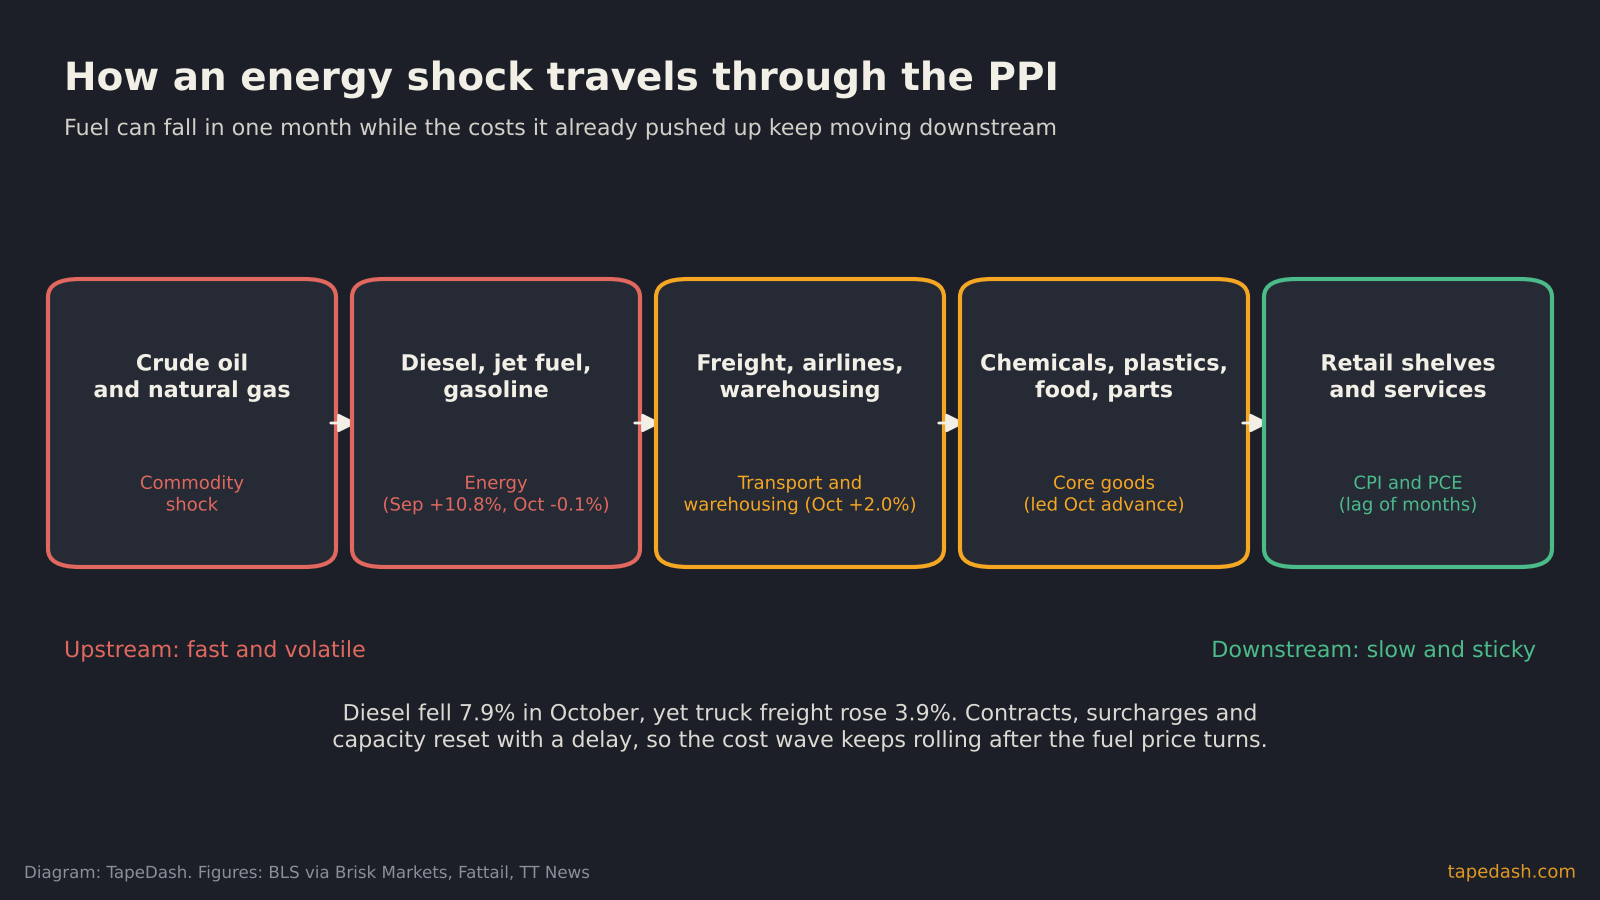
An oil or natural gas shock hits the first box within days. Refined fuels, the second box, follow within weeks. That is what September’s 10.8% energy jump captured.
Then the costs start traveling. Trucking companies renegotiate contract rates and add fuel surcharges. Shippers and warehouses reprice storage. Chemical makers pass higher feedstock costs into plastics and resins. Food processors pay more to move product. Each of those steps has a lag measured in weeks or months, because contracts reset on schedules, not on the day oil moves.
That is why October’s report showed freight, food and core goods rising while energy itself slipped. Goods excluding food and energy, the core goods bucket, did most of the lifting in the October advance (Stock Titan, TT News). In plain terms, the cost wave left the fuel tank and entered the factory.
The last box, consumer prices, moves slowest of all. Retailers have inventories bought at older prices. Service businesses adjust menus and fee schedules once or twice a year. So the October PPI is less a statement about October’s consumer prices and more a preview of what may show up in CPI and PCE over the winter. If you want the energy side of this story, I covered why the EIA still sees high crude prices in Oil Price Forecast: Why the EIA Still Sees $100 Brent as Prices Slide.
What the October PPI report means for the Fed’s December rate hike
The Fed held its target range at 3.75% to 4.00% at its October 28 meeting, and markets are pricing a hike on December 9 with high confidence. CME FedWatch-style pricing put the odds of a quarter-point increase near 90% this week, with the remainder on a half-point move and essentially nothing on a hold (Stock Titan preview, Fattail).
October CPI already pushed in that direction. Consumer prices rose 0.4% against a 0.3% forecast, and core CPI rose 0.3% against 0.2% (Economic Weekly, Stock Titan). Fed Governor Christopher Waller has said he leans toward a quarter-point hike and raised the idea of a larger move if core CPI came in around that level (Stock Titan preview, Stock Titan).
So where does PPI fit? Two ways.
First, the headline miss trims the case for a half-point hike. A 0.3% monthly print is not the kind of number that pushes a committee toward an outsized move. Brisk Markets made the same point after the release: the data may cool expectations for a larger increase (Brisk Markets).
Second, the Fed’s actual target is not CPI or PPI. It is the PCE price index, and some PCE components are pulled straight from PPI rather than CPI, including pieces of medical care and financial services. That is why economists rush to update their PCE estimates within minutes of a PPI release. Physician care and hospital outpatient care prices rose in October (TT News), which tends to lift the PCE translation, while other pieces pulled the other way. Several forecasters adjusted their core PCE estimates after Friday’s data, and the official answer arrives November 25 (TT News, Stock Titan).
My read: the report does not change the December base case of a quarter-point hike. It does make the January debate harder, because a 0.5% monthly pace on core producer prices, two months running, is the kind of persistence that keeps officials from declaring the job done.
How to read a PPI report like a trader
If you only check the headline, you get whipsawed. Here is the order I read a PPI release in, and why.
1. Start with the ex-food, energy and trade core. This is the trend line. A string of 0.4% or higher prints here means cost pressure is broad, not just an energy echo.
2. Then look at energy, but only to explain the gap. If the headline and core diverge, energy and food usually explain it. That tells you whether the headline will reverse next month.
3. Check transportation and warehousing. This is the pass-through gauge. When freight rises while fuel falls, as in October, the shock is spreading. When both fall together, it is fading.
4. Read trade margins as a pressure valve. Falling margins mean businesses are eating costs for now. That can hold the headline down for a while, but it is not a stable equilibrium.
5. Do the base-effect math on the yearly rate. Know what drops out of the 12-month window next month before you react to a yearly number.
6. Watch how bond yields and the dollar react in the first 30 minutes, then again at the close. The first move is often the algorithms reading the headline. The close is the market reading the details. On Friday, Treasury yields eased and stock futures rose after the release (Brisk Markets), which is the market grading the headline miss more than the sticky core.
For a fuller primer on the consumer side, see How to Read the CPI Report: Headline, Core and What Traders Watch.
September vs. October PPI at a glance
| Measure | September 2026 | October 2026 | What changed |
|---|---|---|---|
| Final demand, monthly | +1.4% (revised) | +0.3% | Energy spike faded |
| Final demand, 12-month | 6.3% | 6.5% | Highest since November 2022 |
| Energy, monthly | +10.8% | -0.1% | Fuel prices leveled off |
| Less food and energy, monthly | +0.8% | +0.3% | Trade margins swung lower |
| Less food, energy and trade, monthly | +0.5% | +0.5% | No improvement in the trend |
| Less food, energy and trade, 12-month | 5.0% | 4.9% | Barely moved |
Sources: BLS releases via Stock Titan, Fattail, Trading Economics and the BLS September release.
Who wins and who loses when wholesale inflation runs hot
Rising producer prices are not bad for everyone. They are a transfer.
Companies that sell the inputs tend to do well while costs are rising: freight carriers with pricing power, chemical producers, and anyone whose contracts reprice quickly. October’s 3.9% jump in truck freight is revenue for a carrier, even if it is a cost for the shipper.
The squeeze lands in the middle of the chain. Retailers and consumer brands that buy at producer prices and sell at consumer prices get caught when they cannot raise shelf prices fast enough. The falling trade margins in October are a sign of exactly that squeeze. It shows up later in earnings as gross-margin compression, which is why I pay attention to PPI ahead of retail earnings season.
Rate-sensitive assets lose if the data keeps the Fed hiking. Longer-term Treasury yields have been running high, a story I covered in 10-Year Treasury Yield Hits 5% Again: What the Hot CPI Changed. Small caps, homebuilders and long-duration growth stocks are the usual pressure points when the market prices more hikes.
What to watch next: PCE, Fed minutes and the December decision
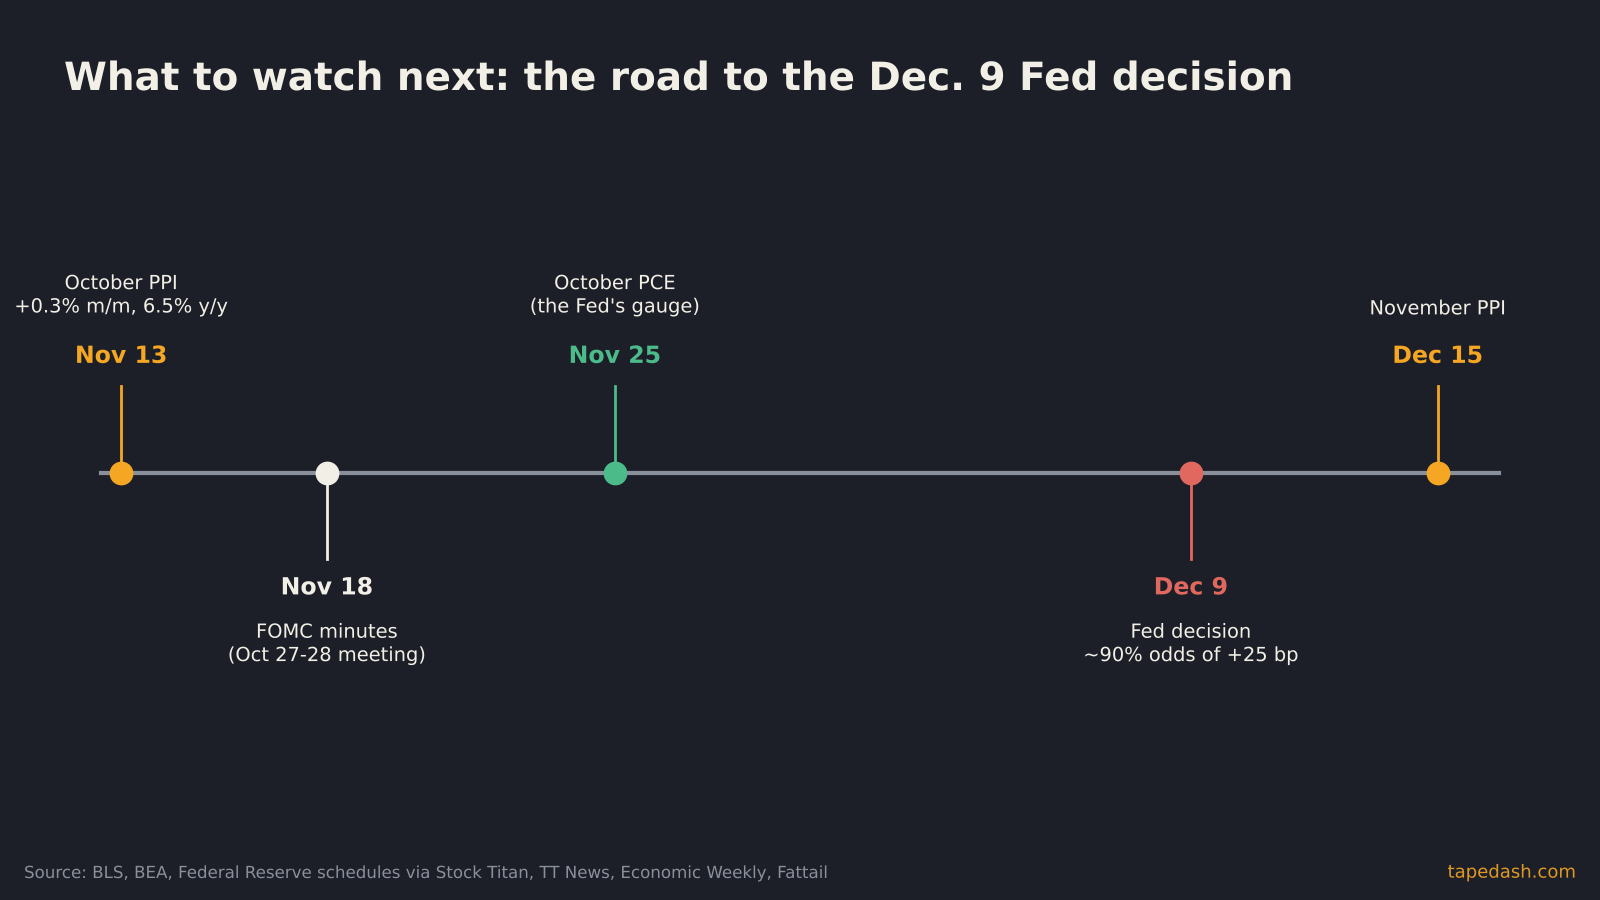
Wednesday, November 18: FOMC minutes. The minutes from the October 27-28 meeting will show how many officials were already close to voting for a hike, and whether pass-through from energy came up as a risk (Economic Weekly, Stock Titan).
Wednesday, November 25: October PCE. The Bureau of Economic Analysis publishes personal income and outlays, including the PCE price index (TT News, Stock Titan). This is the number the Fed’s 2% target is defined on, and it will show how much of today’s PPI detail carried through.
Wednesday, December 9: Fed decision. The end of the two-day meeting. A quarter-point hike is the base case in market pricing (TT News, Fattail). The new dot plot and the statement language on further hikes will matter more than the hike itself.
Tuesday, December 15: November PPI. The next producer price report (Stock Titan, Trading Economics). Watch whether BLS core prints a third straight 0.5%, and whether transportation keeps rising without help from fuel.
If transportation and core goods cool while energy stays flat, the pass-through story weakens and the Fed can talk about a pause after December. If freight and core goods keep climbing, traders will start pricing a hike in January too, and longer-dated yields will feel it first.
How TapeDash tracks inflation-driven moves
Inflation data days are where positioning gets exposed. The headline moves futures in seconds, then the details reprice sectors over the rest of the session. If you want to watch whether this PPI pass-through story is getting priced, this is what we track: rate-sensitive sectors like homebuilders and small caps, Treasury-sensitive ETFs, and unusual options activity in transport and retail names around data releases. The Live Scanner surfaces those flows as they hit the tape, and the Terminal Preview shows how we lay out the macro calendar next to the flow.
If you would rather get the takeaways in your inbox, the free TapeDash Daily recaps the market each evening, including what moved on data days like this one. And if you decide to go deeper, the first 200 members lock Pro at $69.99 a month on their account, even if they cancel and come back later.
October PPI FAQ
What is the PPI and how is it different from CPI?
The producer price index measures prices received by domestic businesses for what they sell. The consumer price index measures prices paid by households. PPI covers business-to-business sales, exports and government purchases that CPI misses, and CPI includes items like owners’ equivalent rent that PPI does not. They overlap but are not the same basket.
Does PPI predict CPI?
Sometimes, and mostly through goods. When producer prices for food, materials and freight rise, consumer goods prices tend to follow with a lag. Services inflation, which is most of CPI, follows its own drivers such as wages and rent, so PPI is a weaker guide there.
Why does the Fed care about PPI if it targets PCE?
Because several PCE components, especially in medical care and financial services, are built from PPI data rather than CPI data. Economists use the PPI release to finalize their PCE forecasts, which is why bond markets react to it even though it is not the Fed’s target measure.
The one thing to remember
October’s PPI cooled at the top and held firm underneath. The headline miss is the part markets cheered on Friday. The steady 0.5% in BLS core, and freight rising while diesel fell, are the parts that will decide whether the Fed stops in December or keeps going. Read the plumbing, not the headline.
See it on the tape, not just in the headlines
TapeDash is the research desk for traders and investors: live options flow, dealer positioning, a real-time market scanner and trade alerts graded in public. Memberships open Black Friday, November 27, and the first 200 members lock Pro at $69.99 a month on their account, even if they cancel and come back later.
Join the waitlistClick through the terminalSee the track recordSources
- TT News: Wholesale inflation picks up to fastest pace since 2022 (Nov 13, 2026)
- Stock Titan: PPI report shows producer prices rose only 0.3%, less than expected, and 6.5% over a year (Nov 13, 2026)
- Fattail: October 2026 PPI, headline +0.3%, BLS core still +0.5% (Nov 13, 2026)
- Brisk Markets: US PPI report slows to 0.3% but annual prices hit four-year high (Nov 13, 2026)
- Trading Economics: United States core producer prices YoY (Nov 13, 2026)
- Economic Weekly: Economic Weekly, November 13, 2026
- Stock Titan: The PPI report comes Friday, with economists expecting a 6.6% yearly rise (Nov 11, 2026)
- U.S. Bureau of Labor Statistics: Producer Price Indexes, September 2026 (Oct 15, 2026)
This article is for educational and informational purposes only. It is not financial, investment, medical or legal advice, and it is not a recommendation to buy or sell any security. Figures come from the sources listed and were checked on the date of publication; markets change quickly. Options trading involves substantial risk of loss.