10-Year Treasury Yield Hits 5% Again: What the Hot CPI Changed
The 10-year Treasury yield is back at 5% after a hot October core CPI. Why bonds sold off, what it means for the Fed, mortgages and stocks, and what's next.
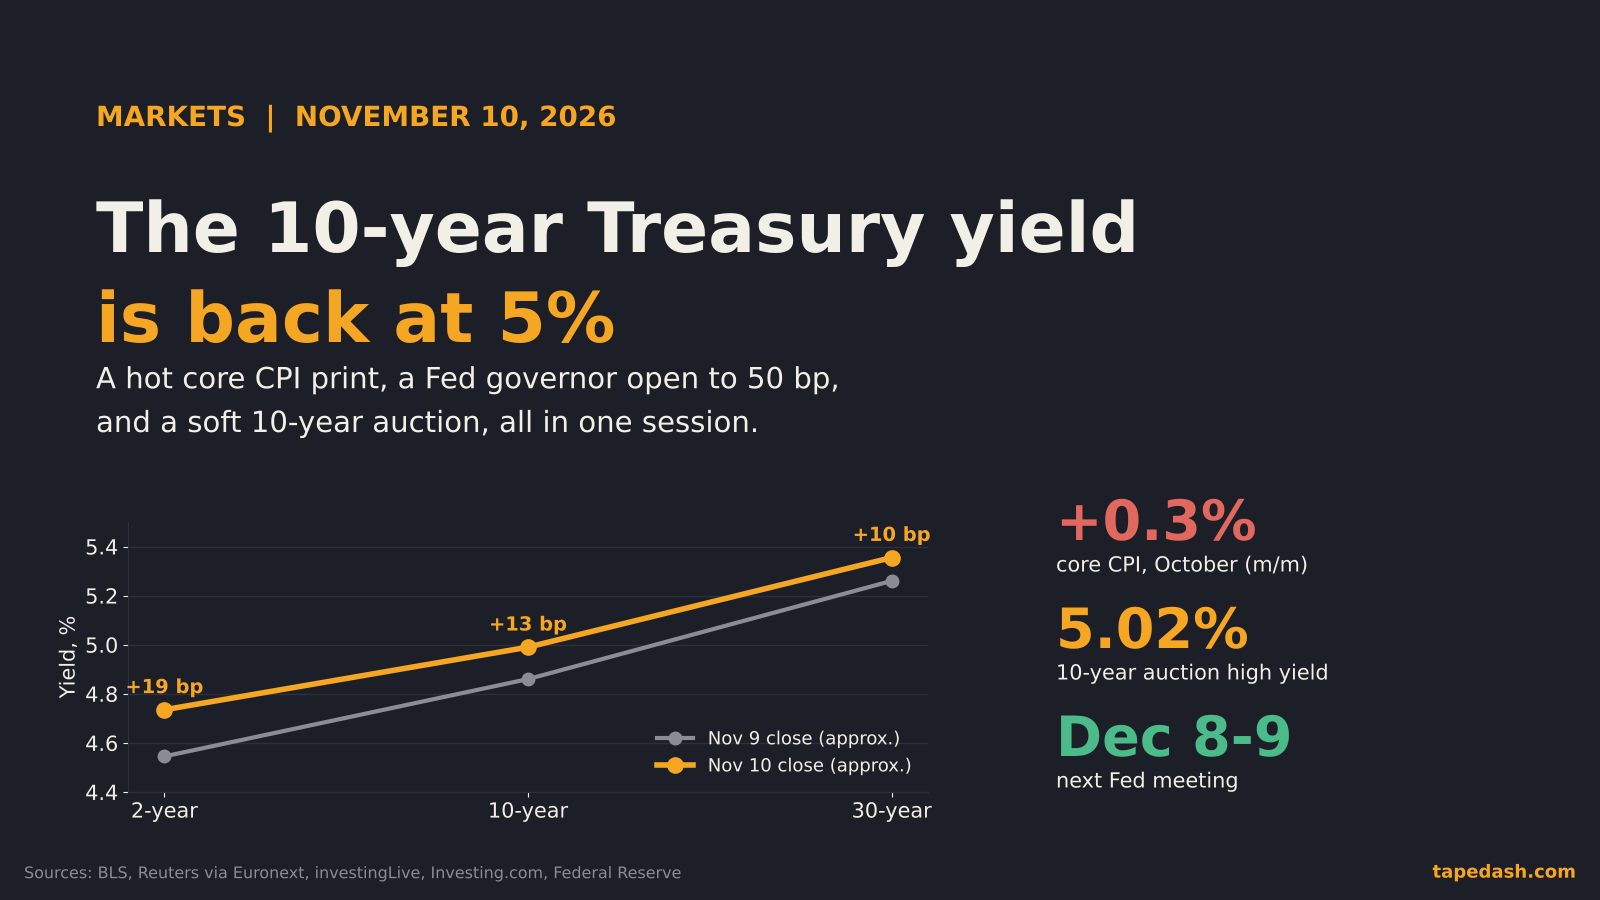
The 10-year Treasury yield is back at 5%. On Tuesday, November 10, it jumped about 13 basis points to roughly 4.99% and traded briefly above 5% during the session, after the October consumer price index came in hotter than expected (Reuters via Euronext, investingLive). At 1 p.m. the Treasury sold $42 billion of new 10-year notes at 5.02%, so the government literally locked in a 5% handle on a decade of borrowing (investingLive, Helious).
The short answer to why: core inflation rose 0.3% for the third month in a row, against a 0.2% forecast, and a Fed governor had said the day before that a 0.3% print would put a half-point hike on the table in December (BLS, Stock Titan). The bond market did the arithmetic fast. The 2-year yield, the maturity most tied to the Fed, rose about 19 basis points, its biggest one-day jump since the April 2025 tariff shock.
Why it matters to you even if you never buy a bond: the 10-year yield is the rate the rest of the economy borrows against. Mortgages, corporate debt and the discount rate behind every stock valuation all key off it. When it sits at 5%, everything priced on “future cash” gets a little cheaper, and anything financed gets a little more expensive.
- The 10-year Treasury yield rose about 13 basis points to roughly 4.99% on November 10 and briefly topped 5%, after October core CPI rose 0.3% versus 0.2% expected.
- The 2-year led the selloff with a jump of about 19 basis points, the biggest since April 2025. That is a Fed story: markets now see a December hike as close to certain and a 50 bp move as roughly a one-in-ten chance.
- The 10-year auction cleared at 5.02% with a bid-to-cover of 2.46, below its 2.60 average, a sign that buyers want more pay to hold long debt.
- The 2026 high is 5.24% (September 28), two basis points shy of the 2007 peak. A close above that level would be the highest since 2002.
- Next tests: PPI on Friday, PCE on November 25, the November jobs report on December 4 and the Fed decision on December 9.
Why the 10-year Treasury yield jumped to 5% today
Three things hit the bond market in the same session, and they stacked.
The CPI report: core at 0.3% for a third straight month
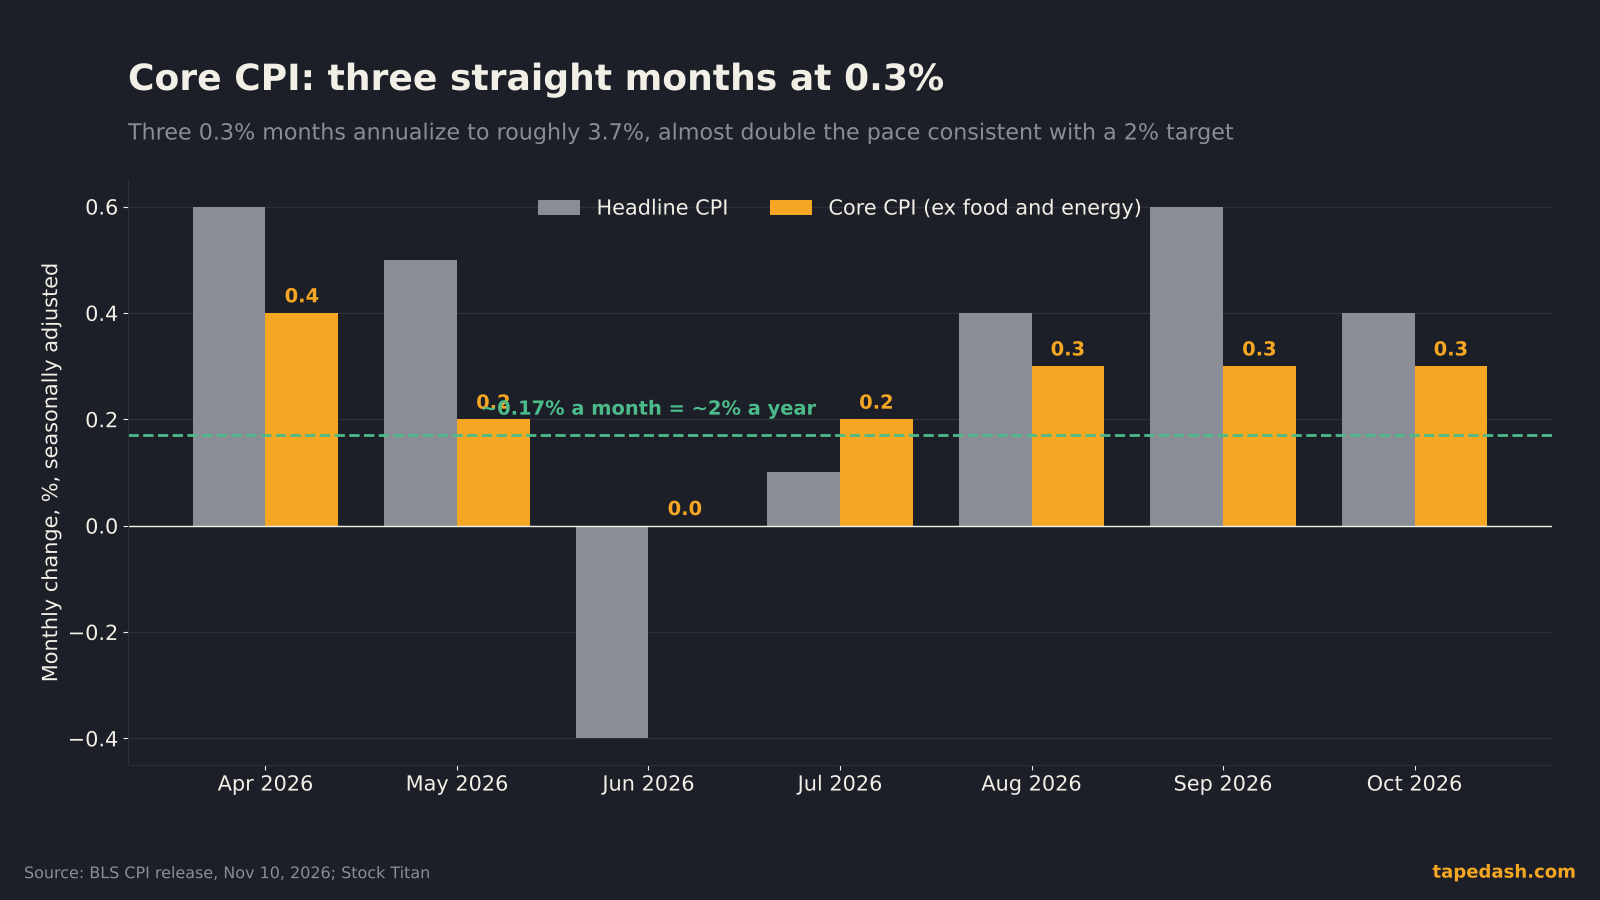
The Bureau of Labor Statistics said overall prices rose 0.4% in October and core prices, which strip out food and energy, rose 0.3% (BLS). Economists had looked for 0.3% and 0.2% (TheStreet, Reuters via Euronext). One tenth of a point sounds trivial until it repeats. Core rose 0.3% in August, 0.3% in September and 0.3% in October. Three months at that pace annualize to roughly 3.7%, which is close to double the run rate the Fed needs to get back to its 2% target.
There is a wrinkle we covered over the weekend: this report has no year-over-year inflation rate, because BLS never collected October 2025 prices during last year’s shutdown (BLS, Stock Titan). If you want the full explanation, our October CPI preview walks through it. The practical effect is that traders leaned even harder on the monthly core number, because it was the cleanest signal on the page.
The Fed speakers: Waller set the bar, and CPI cleared it
The timing made the print worse. Fed Governor Christopher Waller had said he leaned toward a quarter-point hike in December and would consider a half-point move if October core CPI came in at about 0.3% or higher (Stock Titan, TheStreet). It came in at exactly 0.3%. Dallas Fed President Lorie Logan added that she thinks at least two more hikes will be needed (Reuters via Euronext, Stock Titan).
When a voter on the committee publishes a specific threshold and the data lands on it, the market doesn’t wait for the meeting. It reprices the same morning.
The auction: a 5% handle and a thinner bid
At 1 p.m. the Treasury sold $42 billion of 10-year notes at a high yield of 5.02% (investingLive, Helious). The bid-to-cover ratio, which measures how many dollars of bids showed up for each dollar sold, was 2.46 against a recent average of 2.60. The indirect bid, a rough proxy for foreign central banks and large asset managers, came in well below its usual share. Direct bidders and dealers absorbed more than normal.
Call it a sale that cleared at a level the market accepted, with slightly less enthusiasm than usual, rather than a failed auction. That matters for the 10-year more than for the 2-year, because the 10-year carries a term premium, and the term premium is where auction demand shows up.
The 2-year vs the 10-year: what each one is telling you
On a day like this, the most useful thing you can do is look at the whole curve, not just the headline 10-year number.
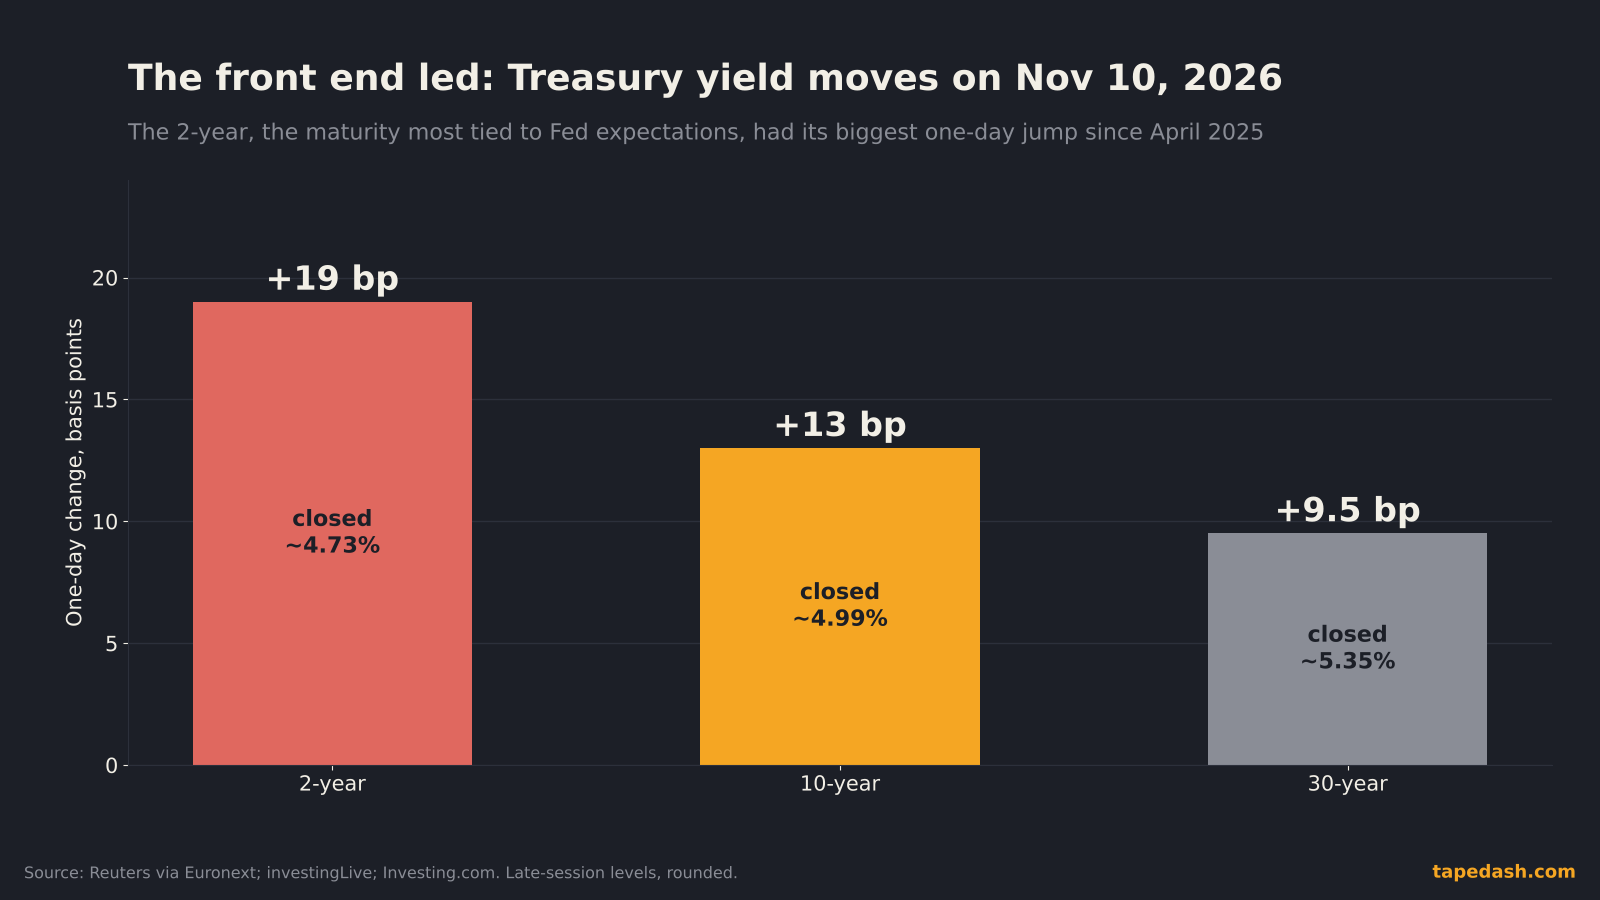
The 2-year rose about 19 basis points to roughly 4.73%. The 10-year rose about 13 to just under 5%. The 30-year rose about 10 to roughly 5.35% (Reuters via Euronext, investingLive, Investing.com). Bond traders call that a bear flattener: everything sold off, but the short end sold off harder.
Here is how I read the three maturities on the desk.
The 2-year is the market’s Fed forecast. It is roughly the average fed funds rate investors expect over the next two years, plus a small cushion. With the fed funds target at 3.75% to 4.00% after September’s hike (Investing.com, Pomegra), a 2-year near 4.73% says the market expects the policy rate to keep climbing. Futures agree: a December hike is close to fully priced, and more than one further hike is priced by the middle of next year (The Bond Buyer, Investing.com). The odds of a half-point December move went from close to zero before the report to roughly one in ten after it (investingLive, Investing.com).
The 10-year is the Fed forecast stretched out, plus a fee. Think of it as the expected path of short rates over ten years, plus a term premium for the risk of lending for that long. Inflation surprises move the first part. Supply, deficits, oil shocks and auction demand move the second.
The 30-year is mostly term premium. Nobody has a useful forecast of the 2050s fed funds rate. The long bond moves on inflation credibility and on how much duration the market has to digest. It rose the least on Tuesday, which is a mildly reassuring sign. If the long end had led, I’d be more worried that investors were questioning the Fed’s grip on inflation, rather than just pricing more hikes.
For a refresher on reading curve shapes and what flatteners and steepeners have meant for stocks in past cycles, our yield curve explainer is the place to start.
How high is 5% in historical terms
Five percent on the 10-year is not a record, but it is rare air for anyone who started trading after 2008.
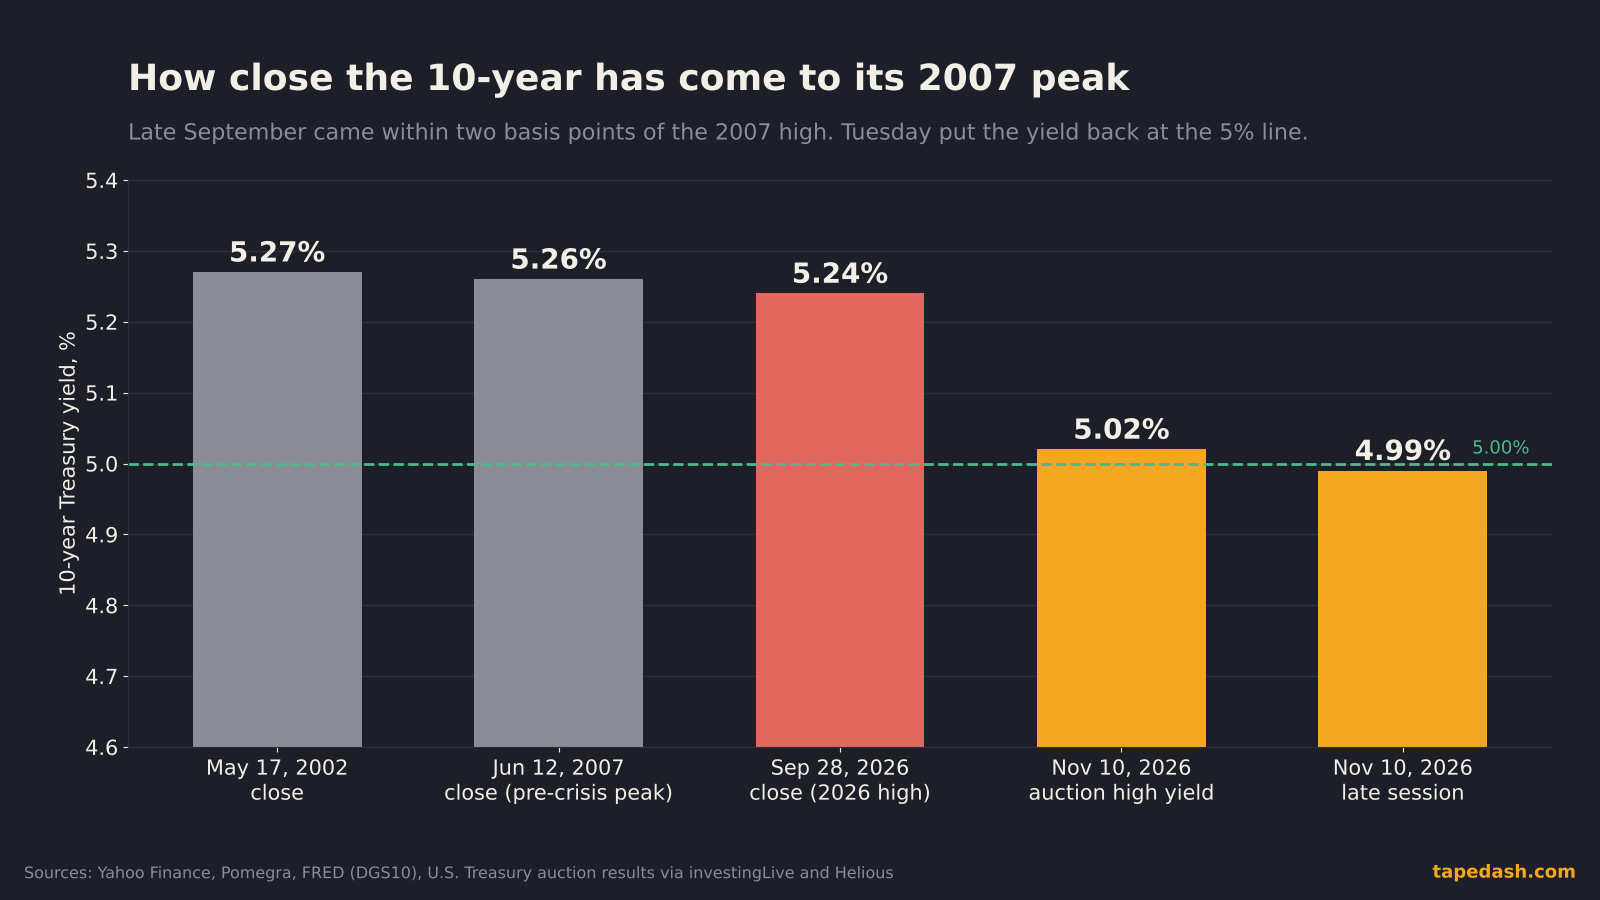
The 2026 high so far is a 5.24% close on September 28, the highest since 2007, when an oil spike tied to the Iran conflict and the Fed’s September hike hit at the same time (Yahoo Finance, Pomegra). The pre-financial-crisis peak was a 5.26% close on June 12, 2007 (Yahoo Finance, FRED). Above that, the next stop on the chart is 2002.
After that September peak, the yield eased through October as oil cooled. Tuesday erased a good chunk of that relief in one session. That’s the part worth sitting with: the market spent six weeks pricing the idea that inflation would fade with energy prices, and one core print told it the inflation that worries the Fed now sits in core prices, away from the gas pump.
How bond yields move stocks, mortgages and the dollar
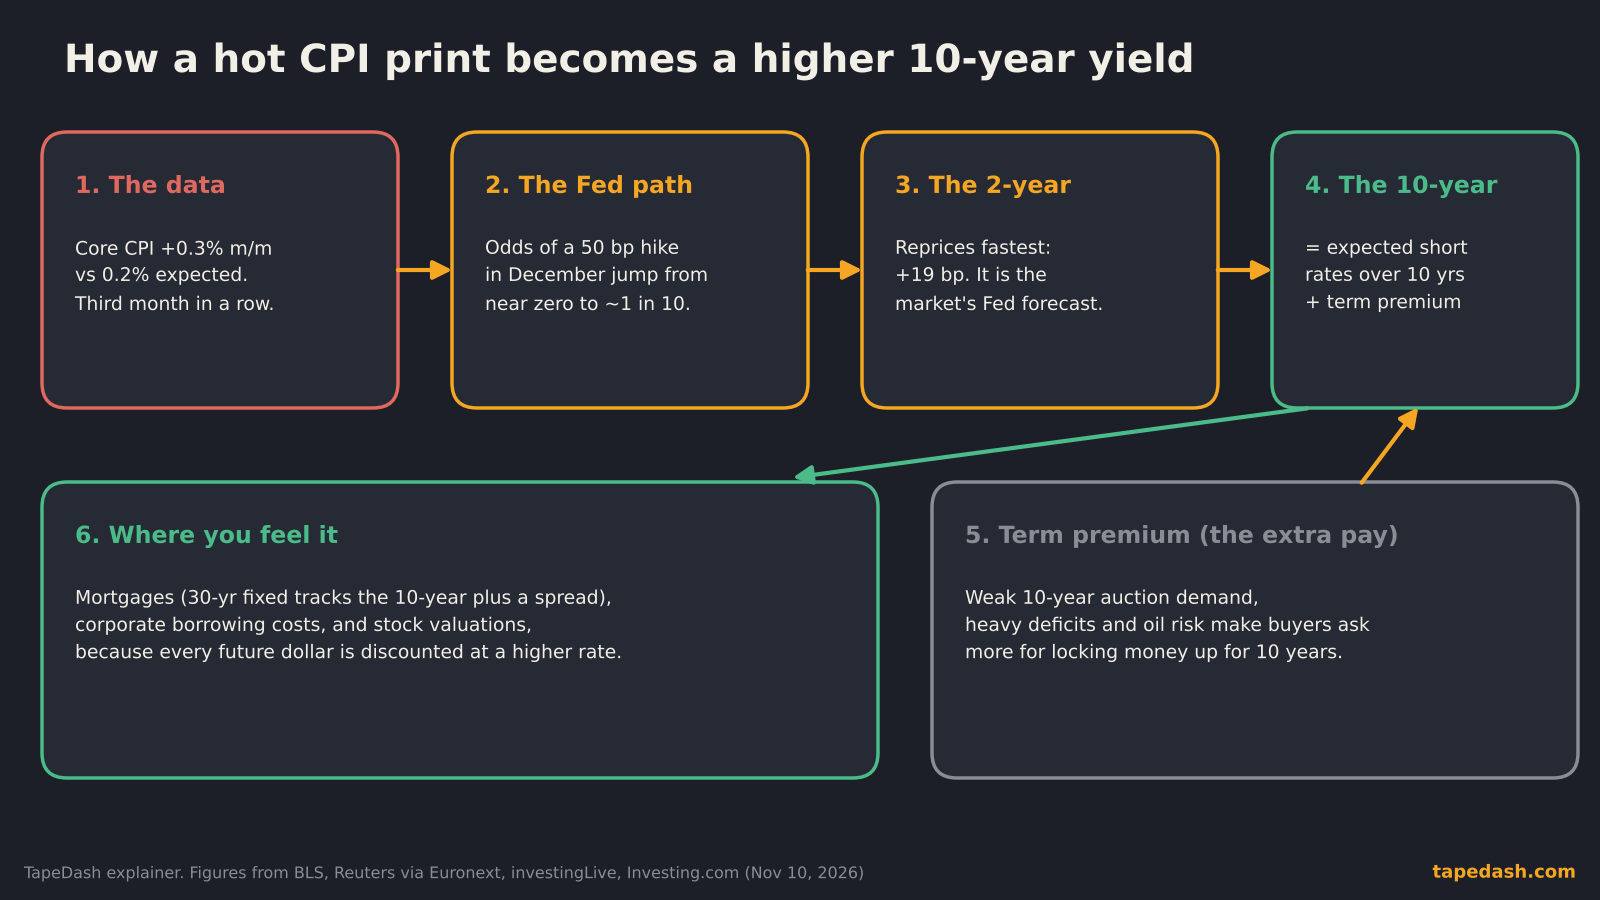
A higher 10-year yield touches nearly every market. The transmission isn’t mysterious, but it helps to see it as a chain.
Stocks: the discount-rate problem
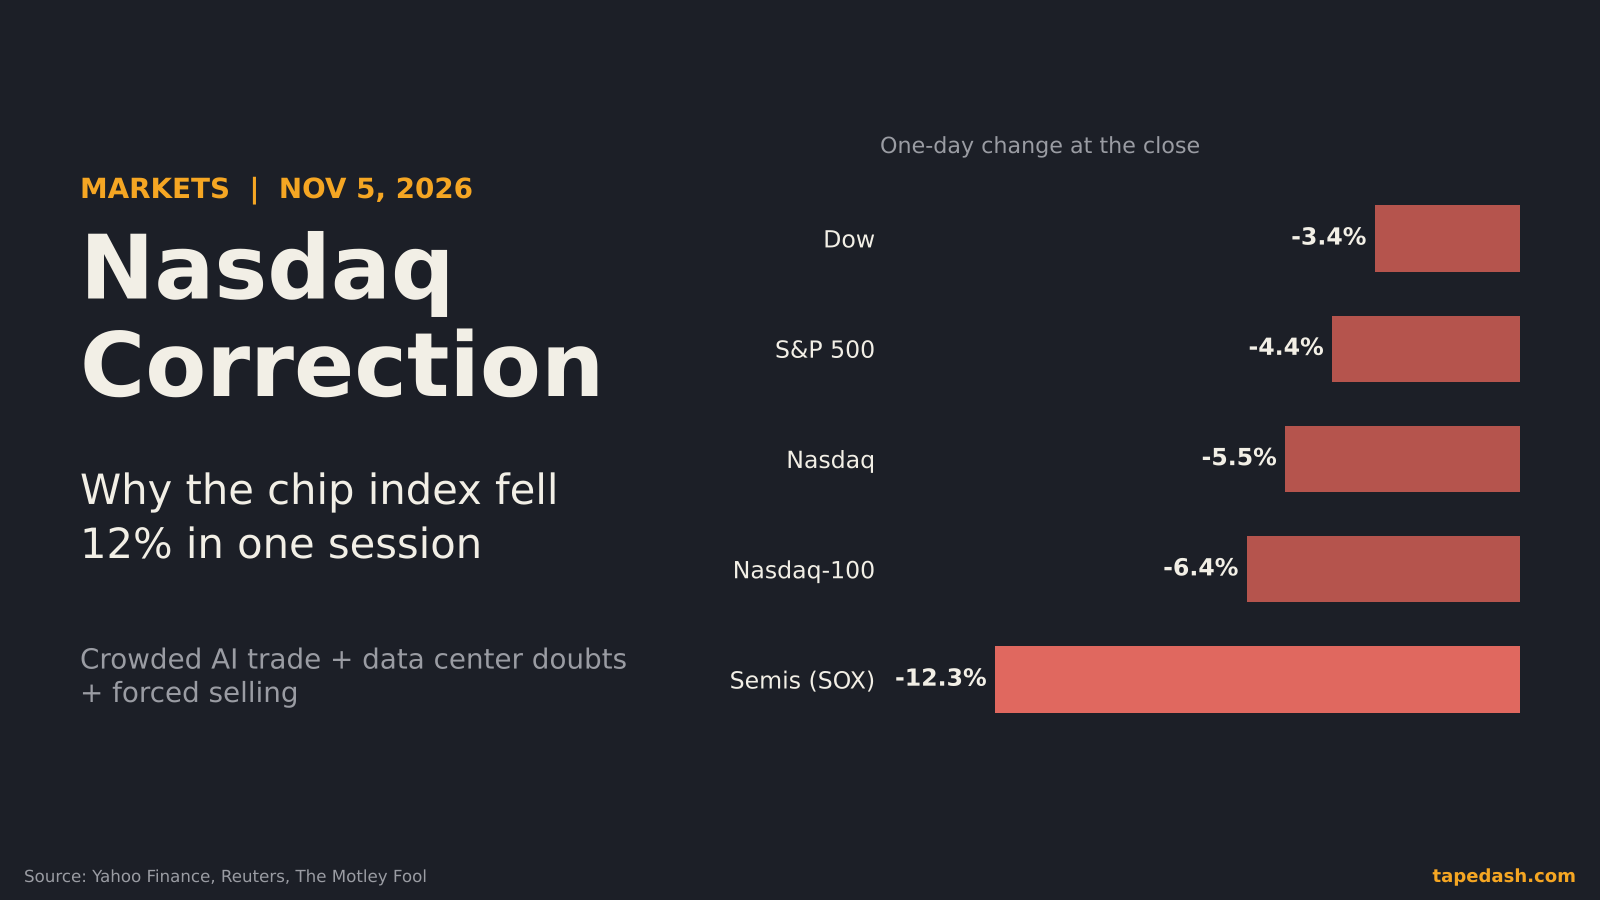
Every stock price is a stack of future cash flows discounted back to today. Raise the discount rate and the present value falls, and it falls most for companies whose cash is furthest in the future. That is why growth and tech usually take the hit when yields jump. On Tuesday the S&P 500 fell about 0.4% and the Nasdaq Composite about 0.7% (TheStreet, Stock Titan). Some of the Nasdaq damage was company-specific news in a large chipmaker, so I wouldn’t pin the whole move on bonds. But the direction lines up with the rate math.
A simple way to frame it: a stock trading at 25 times earnings has an earnings yield of 4%. When a risk-free government note pays 5% for ten years, that stock has to justify itself with growth. Investors will still pay up for growth. They just get pickier about whose growth.
Mortgages: the 10-year plus a spread
The 30-year fixed mortgage rate tracks the 10-year Treasury plus a spread that covers prepayment and credit risk. Freddie Mac’s weekly average had eased to 7.18% in the November 5 survey, down from 7.24% the week before (Freddie Mac via GlobeNewswire, Beyond WA). A year earlier it was 6.22%.
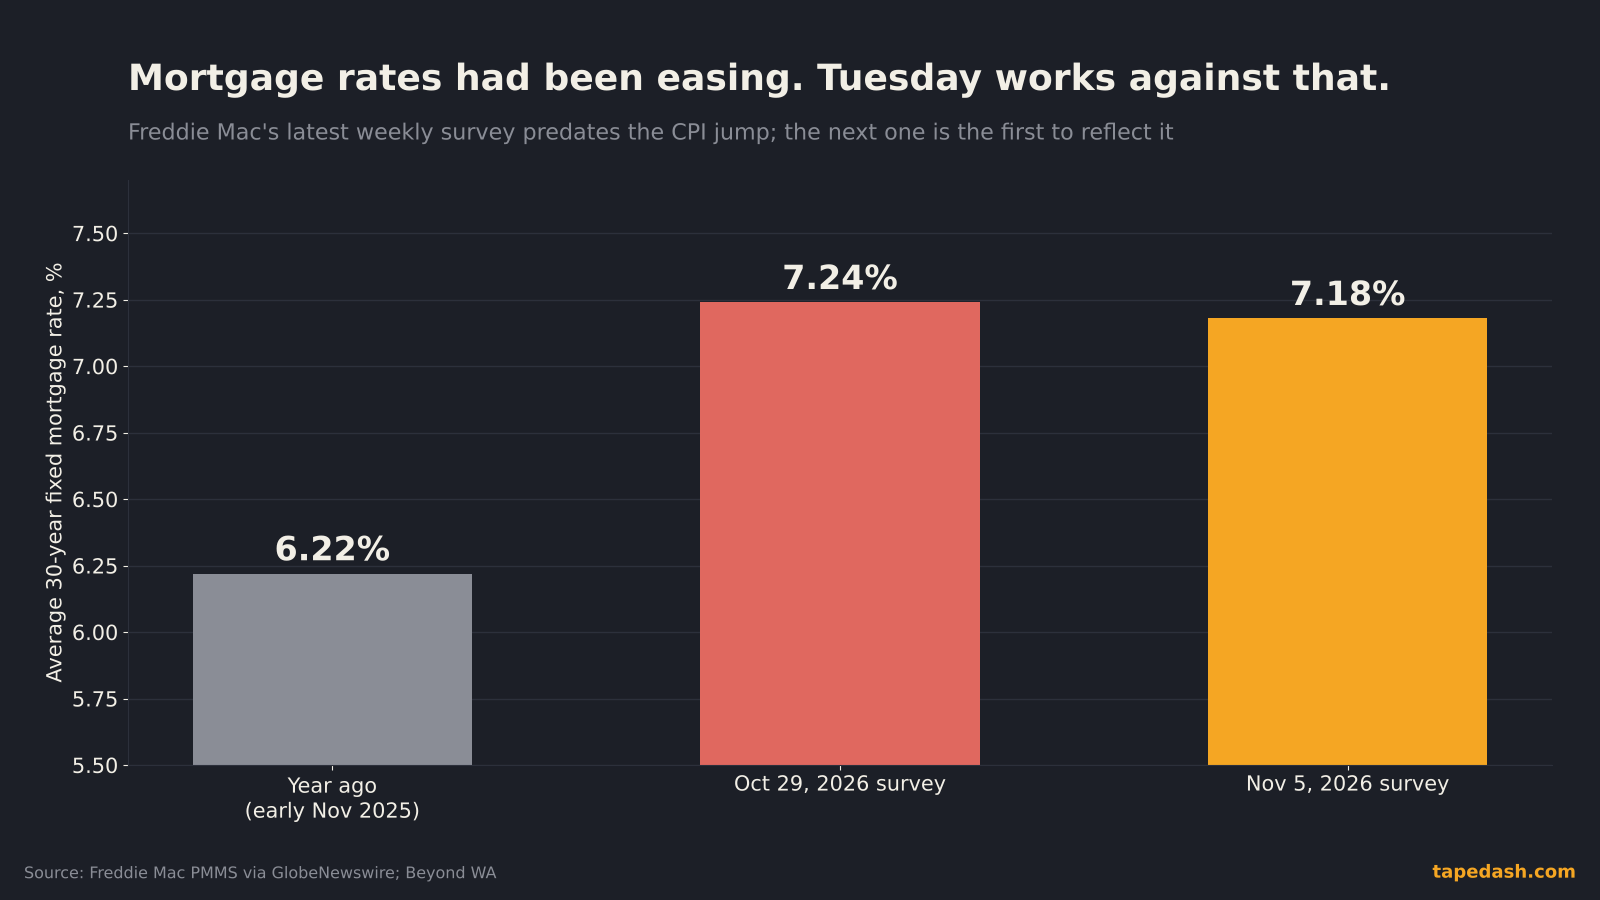
Those survey figures predate Tuesday. If the 10-year holds near 5%, the gentle decline in mortgage rates is likely to stall. If housing stocks and homebuilders are on your watchlist, the next weekly survey matters more than usual.
The dollar and the yen
Higher U.S. yields pull money into dollars. The dollar rose against every major currency on Tuesday, and dollar-yen pushed to about 158.7 (Reuters via Euronext, investingLive). A wider gap between U.S. and Japanese yields keeps the carry trade attractive, which is fine until it isn’t. Our yen carry trade explainer covers why that pair can matter for U.S. stocks.
Commodities and munis
Oil fell on the day, with WTI near $85.50 and Brent near $90.80 (TheStreet, Reuters via Euronext). Gold fell too, which fits a stronger dollar and higher real yields. Municipal bonds held up better than Treasuries, with muni yields rising far less, as often happens on a fast selloff because the muni market reprices more slowly (The Bond Buyer).
How to read a bond selloff like a trader
This is the part I’d bookmark, because days like Tuesday will keep coming while the Fed is hiking.
Step 1: find which end led. If the 2-year moves the most, the story is the Fed’s next few meetings. If the 10-year and 30-year move the most, the story is term premium: deficits, supply, inflation credibility or a weak auction. Tuesday was clearly the first kind, with a little of the second layered on at 1 p.m.
Step 2: check the auction stats. Three numbers do most of the work. The high yield versus where the note was trading just before the auction (a “tail” if it clears higher, a “stop-through” if lower). The bid-to-cover ratio versus its recent average. And the indirect share, as a read on foreign and institutional demand. Tuesday’s 2.46 bid-to-cover and soft indirect bid were below average without being alarming.
Step 3: translate the 2-year into hikes. Take the 2-year yield, subtract the midpoint of the fed funds range, and divide by 25 basis points. It’s crude, because the 2-year also carries some term premium, but it gives you a fast sense of how many hikes are priced. Then cross-check against fed funds futures. If you’ve never read FedWatch, our guide to CME FedWatch and fed funds futures shows exactly where to look.
Step 4: watch which stocks are most sensitive. Long-duration equities (unprofitable tech, small caps with floating-rate debt, homebuilders, REITs, utilities) tend to trade inversely to yields on days like this. Banks can go either way, depending on whether the curve steepens or flattens.
Step 5: don’t confuse level with direction. A 5% 10-year is a level. What moves stocks is how fast it got there. Thirteen basis points in a day is a fast move. A slow grind to the same level, with stable volatility, is usually easier for equities to absorb.
Scenarios for the December Fed meeting
Here is how I’d frame the paths from here. These are scenarios, not predictions, and the point is to know what each one would look like on the screen.
| Scenario | What would have to happen | Likely 2-year reaction | Likely 10-year reaction | Who tends to feel it most |
|---|---|---|---|---|
| Hot again: 50 bp in play | PPI and PCE confirm core near 0.3% a month, payrolls stay firm | Rises further as a half-point hike gets priced | Pushes toward the September high near 5.24% | Long-duration growth stocks, homebuilders |
| Steady 25 bp hike | Data cools slightly; Fed hikes a quarter point and signals patience | Holds near current levels | Drifts sideways near 5% | Range-bound market; rate-sensitive sectors stabilize |
| Cooling | Core PCE and November CPI soften toward 0.2% | Falls as later hikes get priced out | Eases back below 5%, helped by term premium relief | Small caps, housing, unprofitable tech rally |
| Term-premium shock | Data is fine, but long-dated auctions disappoint | Little changed | Rises on its own; the curve steepens | Everything long duration, including the 30-year itself |
The fourth row is the one people forget. You can get higher long yields even with a calm Fed, if buyers simply want more pay to hold long debt. Tuesday had a taste of it.
What to watch next for Treasury yields
The calendar between now and the Fed is dense, and the order matters.
Wednesday, November 11: bond market closed for Veterans Day. Stocks trade normal hours, but the cash Treasury market follows SIFMA’s recommended close (TradingKey, Stock Titan). Expect thinner price discovery in rate-sensitive stocks until bonds reopen on Thursday.
Friday, November 13, 8:30 a.m. ET: October PPI. Producer prices feed several components of the Fed’s preferred inflation gauge, so economists will use PPI to sharpen their core PCE estimates (TradingKey, economic calendar).
Wednesday, November 25, 8:30 a.m. ET: October PCE. This is the inflation measure the Fed targets (FinanceCalendar, Structurex). A core PCE print in line with CPI keeps the half-point conversation alive.
Friday, December 4, 8:30 a.m. ET: the November jobs report (BLS schedule, FedRateCalc). Wage growth is the line to watch. Our October jobs report breakdown explains why it already pushed hike odds up.
December 8 and 9: the Fed meeting, with the decision on Wednesday the 9th (FedRateCalc, Reuters via Euronext).
Thursday, December 10: November CPI, which lands the day after the decision (BLS schedule, FedRateCalc). That sequencing is unusual. The Fed will decide without November’s inflation data, which raises the weight of PCE and payrolls, and it means the first market reaction to the decision can get a second wind the next morning.
Also keep an eye on the 30-year bond auction that finishes this round of Treasury refunding, and on oil. Tuesday’s drop in crude helped keep the move in long yields from being worse.
How to track Treasury yields and rate-sensitive stocks on TapeDash
If you want to watch whether the 10-year holds above 5% and what that does to the stocks you actually trade, this is what we track. The TapeDash Terminal Preview puts the rates complex, the 2-year and 10-year, next to sector moves and options flow, so you can see in one screen whether a bond move is spilling into homebuilders, small caps or long-duration tech, or whether stocks are shrugging it off.
The Live Scanner is useful on data days like PPI and PCE. Filter for unusual options volume in rate-sensitive names and you’ll often see positioning shift before the price does. Large put buying in REITs or homebuilders ahead of a data release tells you where traders are hedging rate risk. If you’d rather get the read without staring at screens, the free TapeDash Daily recaps the rates move and what it meant for the tape every evening. And if you decide to go further, the first 200 members lock Pro at $69.99 a month on their account, even if they cancel and come back later.
FAQ: the 10-year Treasury yield at 5%
Why did Treasury yields go up after the CPI report?
Core CPI rose 0.3% in October, above the 0.2% forecast, for the third month in a row. That raised the odds that the Fed hikes in December and keeps hiking into 2027, and a Fed governor had said a 0.3% print would put a half-point move on the table. Short-term yields rose first and longer yields followed.
Is a 5% 10-year Treasury yield high?
By the standard of the last 15 years, yes. The 10-year closed at 5.24% on September 28, its highest since 2007, and the 2007 peak was 5.26%. By the standard of the 1980s and 1990s, 5% is ordinary. What matters for markets is the speed of the move and whether it’s driven by Fed expectations or by term premium.
Do higher Treasury yields mean higher mortgage rates?
Usually, with a lag. The 30-year fixed mortgage rate tracks the 10-year yield plus a spread. Freddie Mac’s latest weekly average was 7.18% in the November 5 survey, which predates Tuesday’s selloff, so the next survey is the first that can show the effect.
The one idea to remember
Tuesday was a Fed day dressed up as a bond day. The 2-year did most of the moving, and it moved because core inflation stopped cooling. As long as core prints keep landing at 0.3%, the 10-year is going to keep testing 5% and the September high above it. So watch the front end first: the next PPI, PCE and payroll numbers decide whether the 2-year has a reason to stop climbing, and the 10-year follows from there.
See it on the tape, not just in the headlines
TapeDash is the research desk for traders and investors: live options flow, dealer positioning, a real-time market scanner and trade alerts graded in public. Memberships open Black Friday, November 27, and the first 200 members lock Pro at $69.99 a month on their account, even if they cancel and come back later.
Join the waitlistClick through the terminalSee the track recordSources
- U.S. Bureau of Labor Statistics: Consumer Price Index, October 2026 (Nov 10, 2026)
- Reuters via Euronext: US yields rise, stocks fall as inflation data boosts odds of larger December rate hike (Nov 10, 2026)
- Investing.com: US Treasury yields surge as hot CPI revives Fed tightening bets (Nov 10, 2026)
- investingLive: Americas FX news wrap, hot US CPI puts a bigger Fed hike in play (Nov 10, 2026)
- investingLive: U.S. Treasury sells $42 billion of 10-year notes at a high yield of 5.02% (Nov 10, 2026)
- Helious: 10-year Treasury note auction results (Nov 10, 2026)
- Yahoo Finance: 10-year Treasury yield jumps as hot inflation lifts rate-hike odds (Nov 10, 2026)
- The Bond Buyer: Munis see losses, USTs sell off after hot CPI report (Nov 10, 2026)
- TheStreet: Stock market today, Nov. 10, 2026
- Stock Titan: The stock market today, November 10, 2026
- Trading Economics: US 10-year Treasury yield (Nov 10, 2026)
- Yahoo Finance: The 10-year yield is 2 basis points from its 2007 peak (Sep 29, 2026)
- Pomegra: 10-year Treasury yield hits 5.24%, highest since 2007 (Sep 29, 2026)
- FRED, St. Louis Fed: 10-year Treasury constant maturity (DGS10)
- Freddie Mac via GlobeNewswire: Mortgage rates decline for third consecutive week to 7.18% (Nov 5, 2026)
- Beyond WA: Mortgage rate update, 30-year fixed falls to 7.18% (Nov 9, 2026)
- TradingKey: Week ahead, October CPI and PPI due (Nov 2026)
- Economic calendar for the week of Nov. 9 through Nov. 13
- FinanceCalendar: US personal income and outlays (PCE), October 2026 data
- Structurex: PCE release dates 2026 and 2027
- U.S. Bureau of Labor Statistics: December 2026 release schedule
- FedRateCalc: US economic calendar, December 2026
This article is for educational and informational purposes only. It is not financial, investment, medical or legal advice, and it is not a recommendation to buy or sell any security. Figures come from the sources listed and were checked on the date of publication; markets change quickly. Options trading involves substantial risk of loss.