Stock Market Correction: What the Worst Week Since 2020 Means
The S&P 500 and Dow are in a correction after the Nasdaq's worst week since 2020. What history says about corrections, and the dates that decide what's next.
The S&P 500 is officially in a stock market correction. It fell 3.70% on Friday to close at 6,910.39, its seventh straight losing session and the longest such streak since February 2020 (Charles Schwab, Yahoo Finance, STL.News). The Nasdaq Composite dropped 5.28% on the day and 10% on the week, its worst week since March 2020. The Dow Jones Industrial Average joined the S&P 500 more than 10% below its record, which is the textbook definition of a correction.
So what does a correction this fast actually mean? History gives a reasonably clear answer: most 10% drops stop before they turn into 20% bear markets, but the ones that don’t tend to share a feature this one has, which is a Federal Reserve that is tightening into the weakness instead of riding to the rescue. That is the tension the market is pricing right now. Wall Street sold the AI chip trade hard, and the Fed’s next move is still expected to be a hike.
This piece walks through what happened, how this selloff compares with 2018, 2020, 2022 and 2023, why corrections feed on themselves, and the specific dates over the next three weeks that will tell you which kind of correction this is.
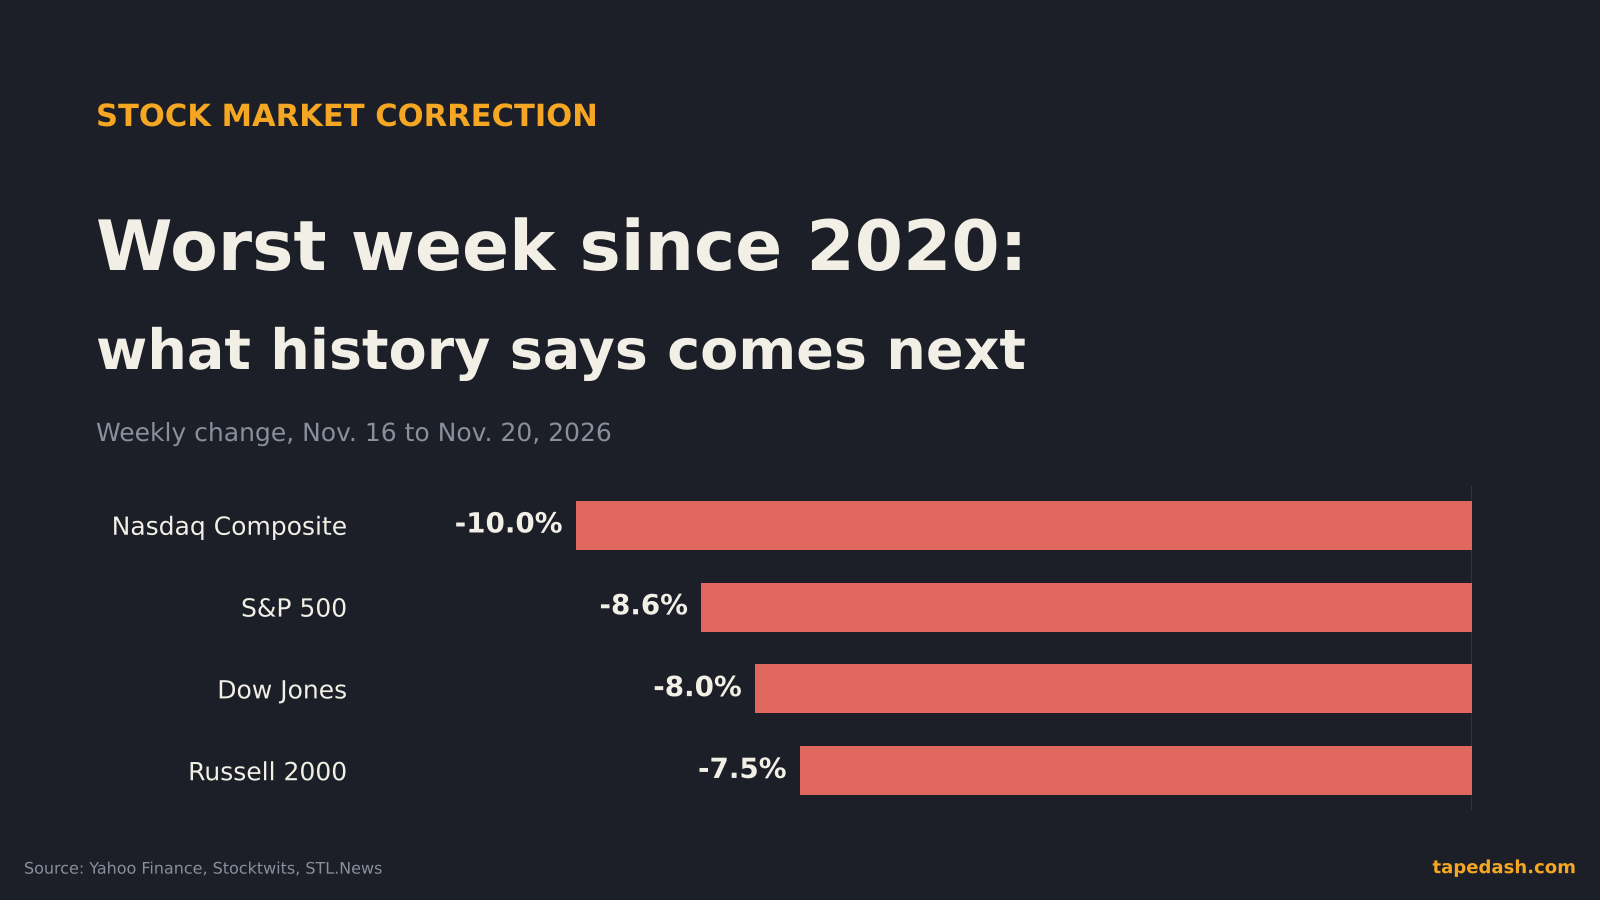
- The S&P 500 fell 8.6% this week and the Nasdaq Composite 10%, the Nasdaq’s worst week since March 2020. Both the S&P 500 and the Dow closed more than 10% below their records.
- The selling started in AI chip stocks. Nvidia (NVDA) fell 14% on Friday and about 23% on the week, after Reuters reported an SEC investigation into its accounting.
- Historically only about one in three corrections has turned into a bear market. The ones that did usually came with a tightening Fed or a recession.
- This time the Fed is the problem, not the backstop: traders price roughly a 92% chance of a December rate hike.
- The tests come fast: October PCE inflation and the Q3 GDP revision on Nov. 25, a holiday-shortened week, then the Fed decision on Dec. 9.
How bad was this week’s stock market selloff
Start with the numbers, because the shape of the damage tells you who was doing the selling.
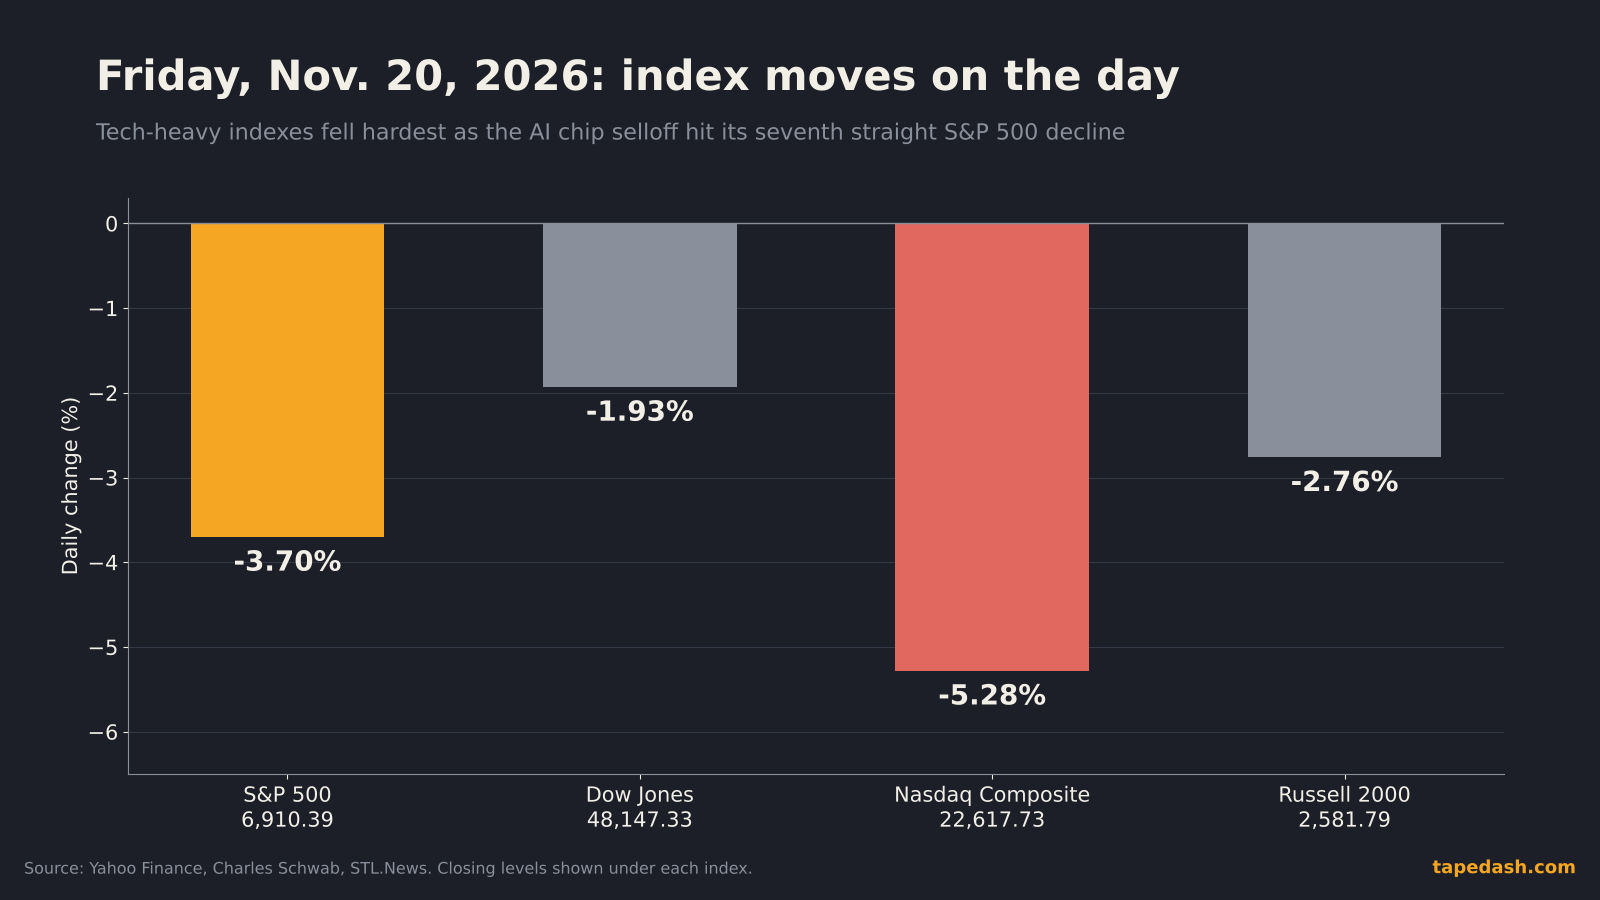
On Friday alone the Dow lost 1.93% to 48,147.33, the Nasdaq Composite lost 5.28% to 22,617.73 and the small-cap Russell 2000 lost 2.76% to 2,581.79 (Yahoo Finance, STL.News). The Nasdaq 100, the index behind the Invesco QQQ Trust (QQQ), fell about 5.6% (Stocktwits, StockTitan).
For the week, the S&P 500 lost 8.6%, the Dow 8%, the Nasdaq Composite 10% and the Russell 2000 7.5% (Yahoo Finance, Stocktwits). For the S&P 500 that was the worst week since the April 2025 tariff selloff. The Nasdaq erased its gains for 2026 and closed the week down on the year (Charles Schwab, Yahoo Finance).
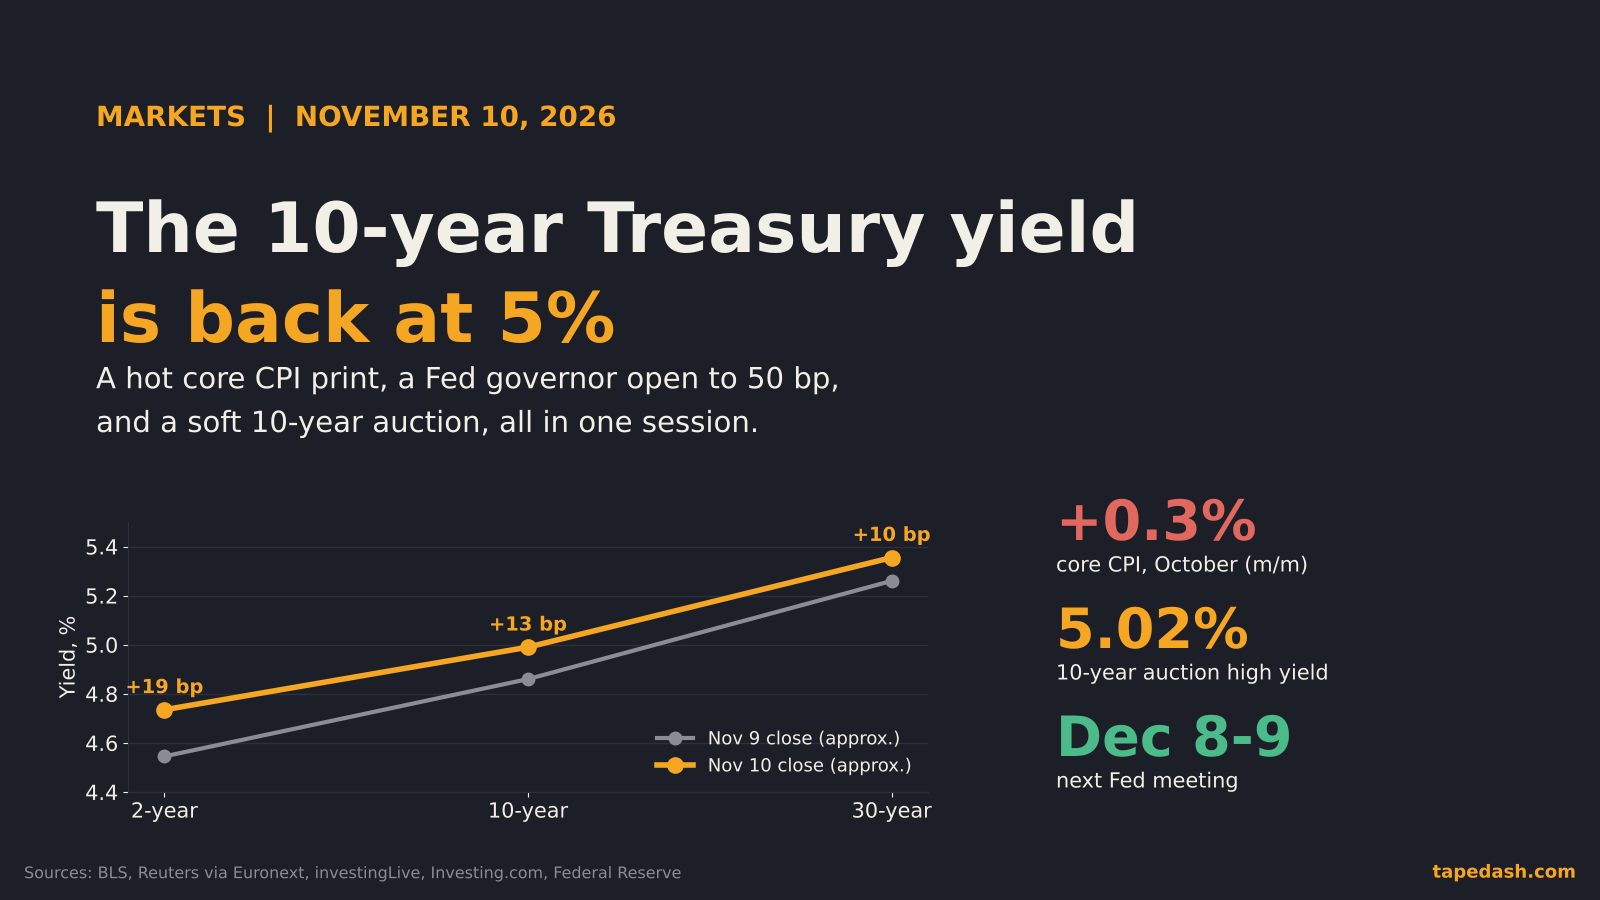
Fear showed up where you’d expect. The Cboe Volatility Index, the VIX, closed in the mid-to-high 30s, its highest level since April 2025 (Yahoo Finance, Stocktwits). Money ran to Treasuries, and the 10-year yield fell more than 10 basis points to roughly 4.9% (Yahoo Finance, STL.News). If you want a refresher on what that VIX level is measuring, our guide on the VIX and how to use the fear gauge covers it.
| Index | Friday move | Week | Where it stands |
|---|---|---|---|
| S&P 500 | -3.70% | -8.6% | More than 11% below its Oct. 6 record close: a correction |
| Dow Jones Industrial Average | -1.93% | -8% | More than 11% below its August record: a correction |
| Nasdaq Composite | -5.28% | -10% | Worst week since March 2020, negative for 2026 |
| Russell 2000 | -2.76% | -7.5% | Small caps fell less than tech this time |
Why is the stock market down: the AI chip selloff and a hawkish Fed
Two forces collided this week, and either one alone probably wouldn’t have produced a 10% Nasdaq week.
The AI trade broke at its center
The first is AI. For two years the market has been priced on the idea that data-center spending keeps compounding. This month investors started asking out loud whether that spending earns its return, and how it gets financed (Charles Schwab, STL.News). When the most crowded trade in the market gets questioned, the selling lands on its biggest holdings first.
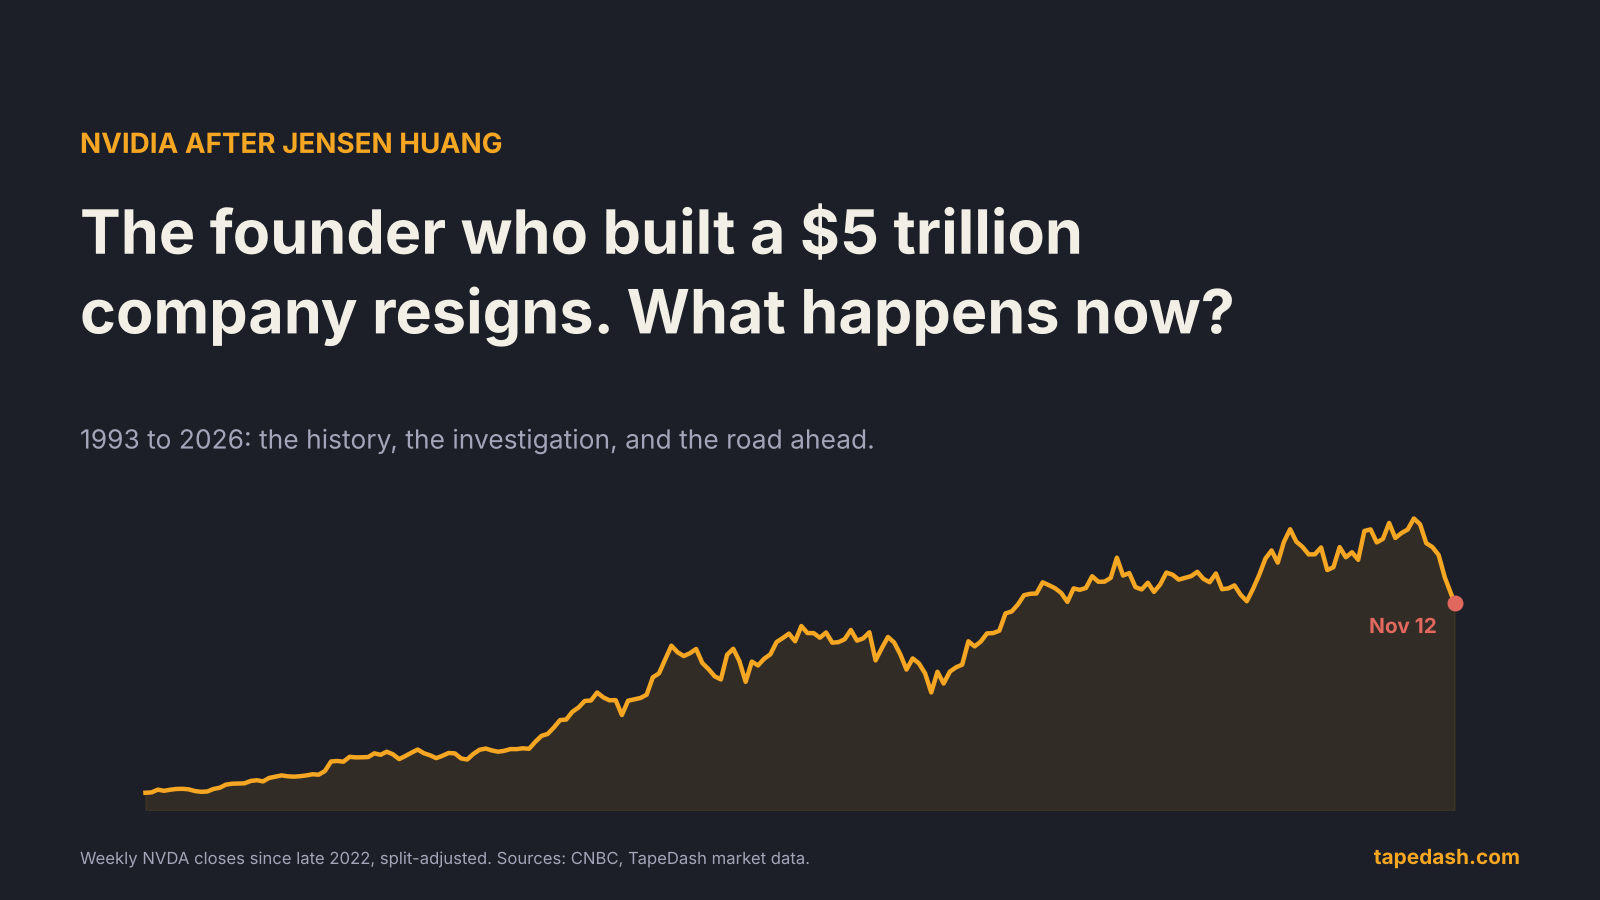
Nvidia was the epicenter. The stock fell 14.01% on Friday to $125.53 (StockTitan, Yahoo Finance) and about 23% for the week (Yahoo Finance, STL.News). Friday’s leg came after Reuters reported that the SEC is investigating Nvidia’s accounting practices, per Schwab and STL.News. That came on top of the leadership shock from Jensen Huang’s exit, which we covered in the full story of Huang’s resignation as Nvidia CEO. A report of an investigation is not a finding, and nothing has been charged. But markets price uncertainty first and facts later, and the largest company in the index had a lot of uncertainty dumped on it in one week.
Other chipmakers, including Micron Technology (MU) and Advanced Micro Devices (AMD), fell double digits on Friday (StockTitan, Charles Schwab). The same wave hit Asia first, which we broke down yesterday in why Taiwan and Korea took the AI selloff hardest. This is also the second leg of a move we wrote about on Nov. 5, when the chip index fell 12% in one day. That one bounced. The question now is whether this one does too.
The Fed isn’t coming to the rescue
The second force is the one I’d pay more attention to. In most modern corrections the Fed has been part of the exit. Late 2018 ended when the Fed signaled it would stop hiking. March 2020 ended with emergency cuts and asset purchases. Traders have a name for that reflex, the “Fed put.”
This week there was no put. Fed Governor Lisa Cook said on Friday that “waiting longer to implement rate increases risks getting behind the curve” (StockTitan, with the same remarks reported by Yahoo Finance). By late Friday, fed funds futures priced roughly a 92% chance of a quarter-point hike in December (Charles Schwab, Yahoo Finance). Stocks fell 8.6% in a week and the market still expects tighter policy, which tells you how worried the Fed is about inflation. Our explainer on reading CME FedWatch and fed funds futures shows how those odds are built.
That combination is what makes this correction different from a garden-variety pullback. Falling earnings expectations for the AI leaders would be manageable with falling rates. Falling expectations with rising rates is a harder setup, because the discount rate on future profits goes up just as the profits themselves get questioned.
How this stock market correction compares with past declines
A 10% drop feels like the end of the world while it is happening. Lined up against the last few, it looks more ordinary, at least so far.
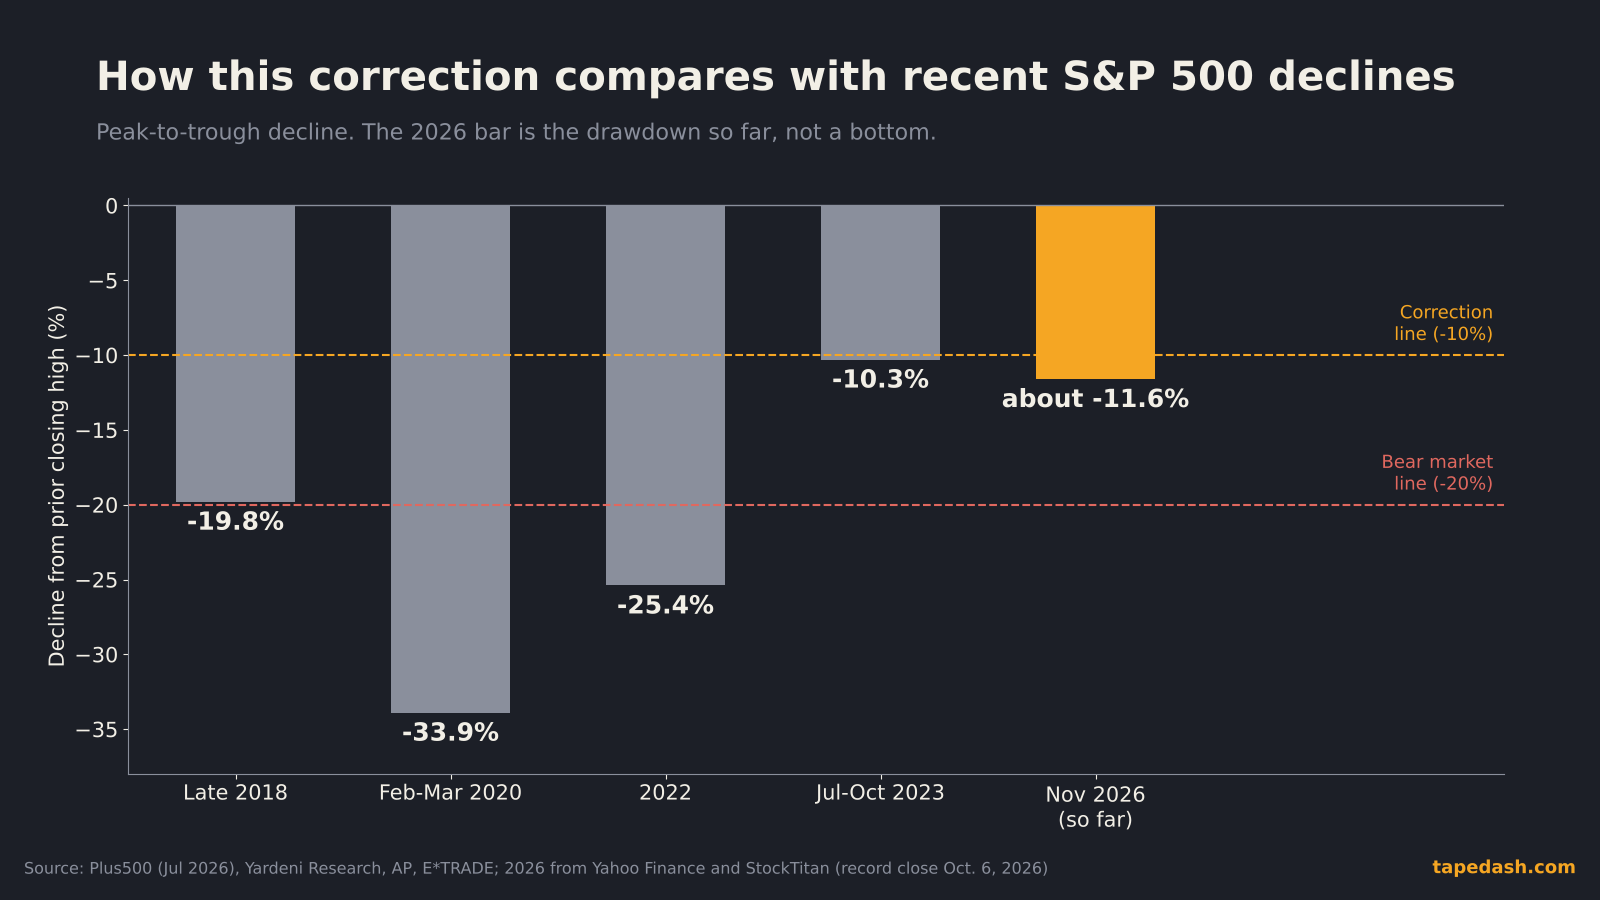
The S&P 500’s late-2018 decline reached 19.8%, a hair short of a bear market (Plus500, Yardeni Research). The COVID crash took the index down 33.9% between Feb. 19 and March 23, 2020, in about a month (Plus500, Yardeni Research). The 2022 bear market cut 25.4% from Jan. 3 to Oct. 12 (AP, Plus500). And the 2023 correction, which almost nobody remembers now, was a 10.3% slide from late July into October (AP, E*TRADE).
The current decline is a little over 11% from the Oct. 6 record close, by our math from Yahoo Finance’s record figure and StockTitan’s reading of the SPDR S&P 500 ETF Trust (SPY) (Yahoo Finance, StockTitan). What stands out is the speed, not the depth. Getting from a record to a correction in about six weeks, with an 8.6% week at the end, puts this closer to the fast, violent end of the range.
| Decline | Peak-to-trough | What was going on | What ended it |
|---|---|---|---|
| Late 2018 | -19.8% | Fed hiking and shrinking its balance sheet | The Fed signaled a pause in early 2019 |
| Feb-Mar 2020 | -33.9% | Pandemic shutdowns | Emergency rate cuts, asset purchases and fiscal aid |
| 2022 | -25.4% | Inflation and the fastest hikes in decades | Inflation peaked and rate expectations stabilized |
| Jul-Oct 2023 | -10.3% | Long-term yields surging | Yields peaked and the Fed signaled it was done |
| Nov 2026 | about -11.6% so far | AI spending doubts, Fed still hiking | Not over yet |
Read the last column top to bottom and a pattern jumps out. In each of the four finished declines, the end came when rates or rate expectations turned. That is the main reason I’d watch the inflation data next week more closely than the chip headlines.
Do stock market corrections turn into bear markets
Usually not, and two separate counts agree on that.
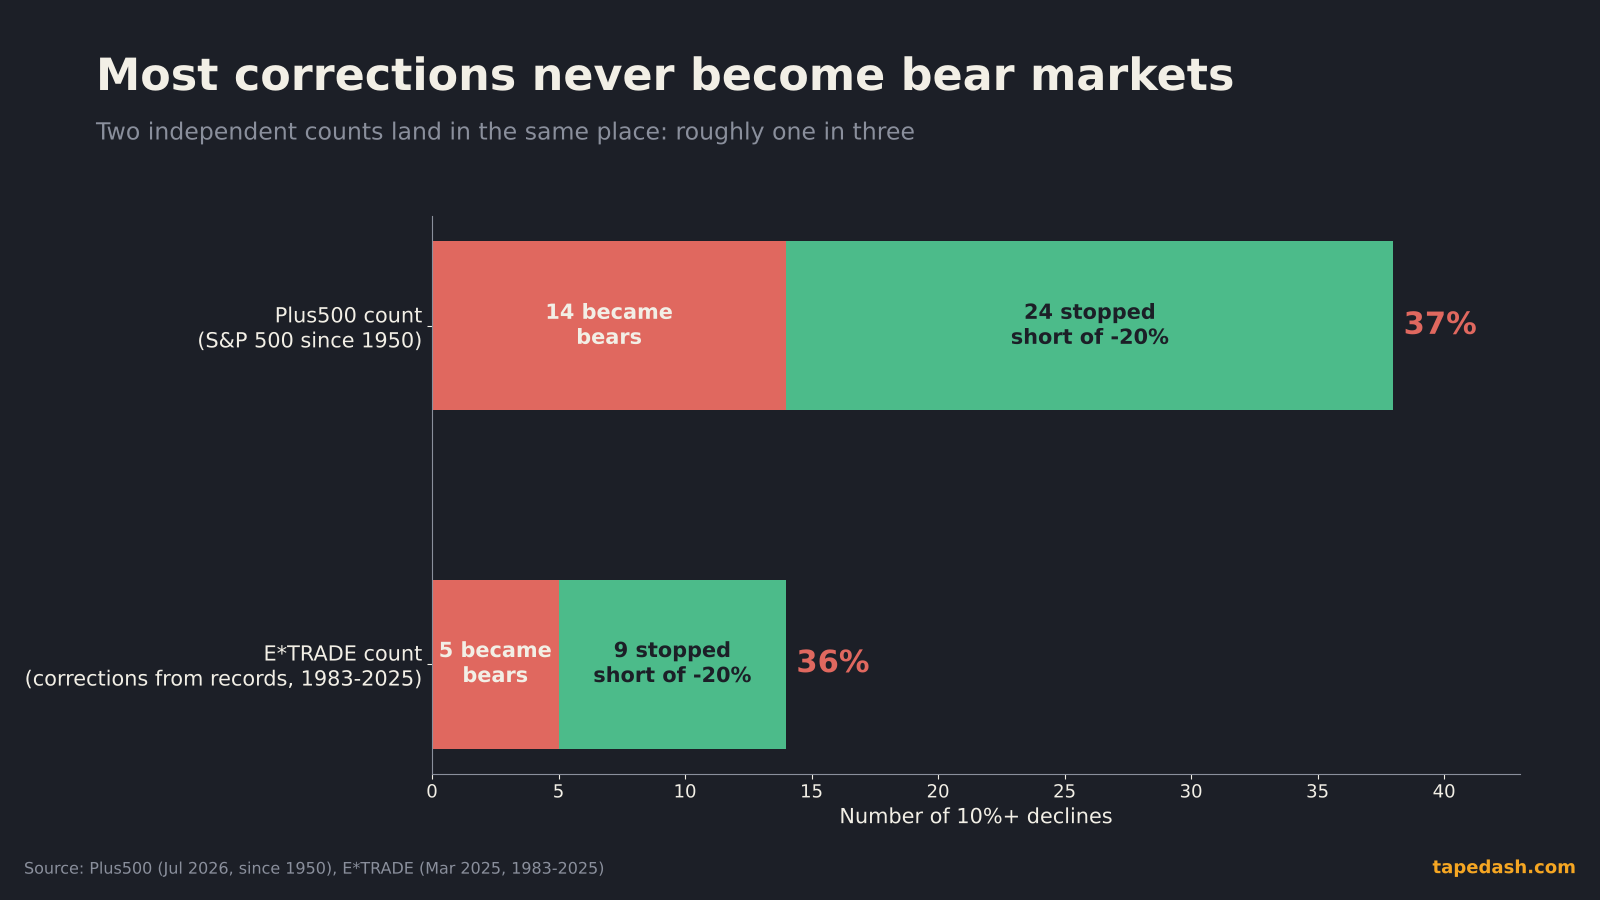
Plus500’s tally of the S&P 500 since 1950 counts around 38 corrections and 14 bear markets (Plus500). An older count from Yardeni Research, cited by The Motley Fool, found 39 corrections since 1950 through early 2022 (Nasdaq/The Motley Fool). E*TRADE, looking only at corrections from record highs between 1983 and early 2025, found that 5 of 14 became bear markets (E*TRADE). Different methods, same answer: roughly one correction in three goes on to a 20% decline.
The other two-thirds tend to be shorter than people fear. Corrections have shown up about every couple of years on average (AP, Nasdaq/The Motley Fool), and the ones that stop short of a bear market have typically recovered in a matter of months, not years (AP, Plus500). When a correction does become a bear market, though, the average damage has been a third or more of the index’s value (AP, Charles Schwab). That asymmetry is why the one-in-three number matters more than the average.
So the base rate favors this ending as a correction. The honest caveat is that base rates describe all corrections, and this one has two of the features the bad ones shared: a tightening Fed and a crowded leadership group repricing at the same time. I wouldn’t throw out the base rate. I’d just stop treating it as a guarantee.
How a selloff feeds on itself
Corrections don’t move in a straight line from bad news to lower prices. They loop. Understanding the loop is how you spot the point where it breaks.
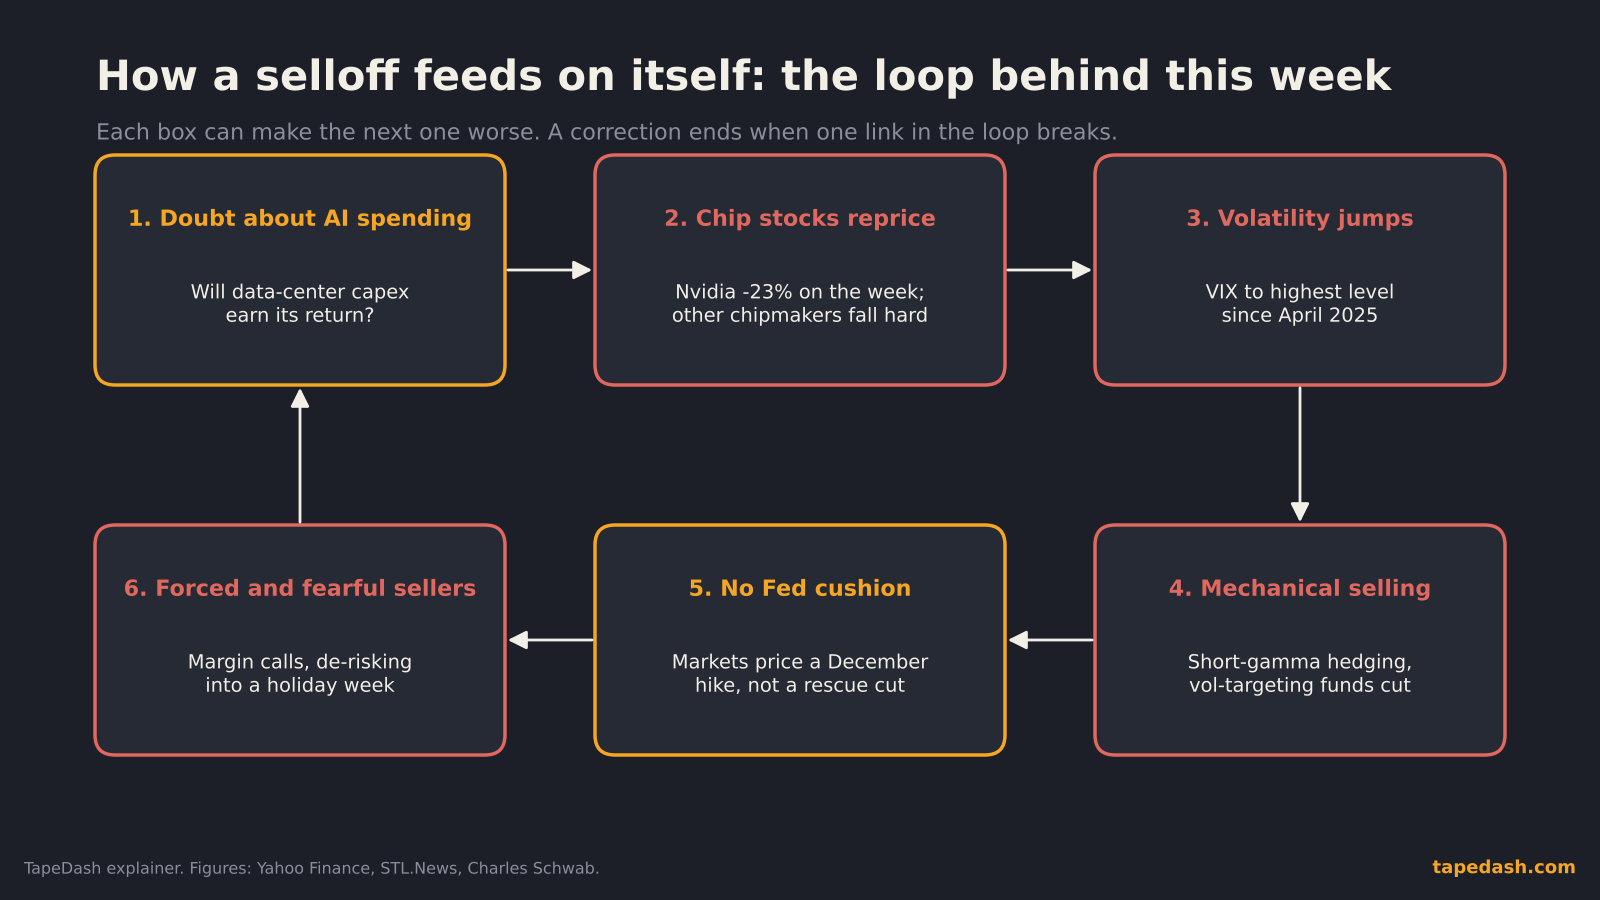
The trigger was fundamental: a real question about AI returns. Once the biggest stocks started falling, though, the mechanics took over. When volatility jumps, funds that target a fixed level of risk have to sell to bring their exposure back down. Options dealers who are short gamma hedge by selling into declines, which adds to the pressure on the way down. We explain that mechanism in our guide to dealer gamma exposure. And when the Fed is expected to hike, the usual cushion under the market isn’t there.
The loop breaks in one of a few ways. Volatility peaks and starts falling, which lets the risk-targeting funds buy back in. Dealer positioning flips from short gamma to long gamma, so hedging starts to dampen moves instead of amplifying them. Or the macro story changes, usually through rates. Watching for those three things is more useful than trying to guess the exact low.
How to read a stock market correction like a trader
This is the practical part. When I’m trying to tell a correction that’s ending from one that’s getting worse, these are the checks I run, roughly in this order.
Breadth before price. A bottom built on a handful of mega caps bouncing is fragile. One where the majority of stocks stop making new lows, even while the index chops, is sturdier. Our guide to market breadth indicators walks through the measures we use. The tell to watch for is a down day for the index where fewer stocks make new lows than the day before.
The VIX curve, more than the VIX level. A VIX in the mid-30s matters less than the shape of VIX futures. When near-dated volatility trades above longer-dated volatility, the market is paying up for protection right now, which is what panic looks like. When that inversion unwinds, the forced selling is usually close to done.
Dealer positioning. If dealers move back toward positive gamma at key index strikes, their hedging starts to absorb moves instead of chasing them. That tends to show up as smaller intraday ranges before it shows up in price.
Leadership. In this correction the leaders were the AI chips. A durable low usually needs them to stop making new lows, or for the market to find new leaders. Watching whether Nvidia holds its Friday low on the next bad headline is a better signal than any single index level.
Rates. Given the pattern in the history table, the most important single input may be the 10-year yield and December hike odds. If the PCE data next week cools and hike odds fall, the macro leg of the loop weakens. If it runs hot, it gets stronger.
None of these is a timing signal by itself. Together they tell you whether the loop is still running.
Who wins and who loses in a correction like this
The losers are obvious: anything priced on AI capex growth, including chipmakers, memory makers and the companies that sell into data centers, plus the high-multiple software and speculative names that rode the same wave. The Nasdaq’s 10% week against the Russell 2000’s 7.5% tells you that the pain concentrated where valuations were richest.
The relative winners are less exciting. Treasuries rallied as yields fell. Defensive sectors held up far better than tech. And volatility sellers who had already reduced risk are now being paid much more to take it back. For long-term investors, a correction is also when index weights reset, because the most crowded names shrink as a share of the S&P 500.
What to watch next for the stock market
The calendar is short and dense, and the holiday makes it trickier.
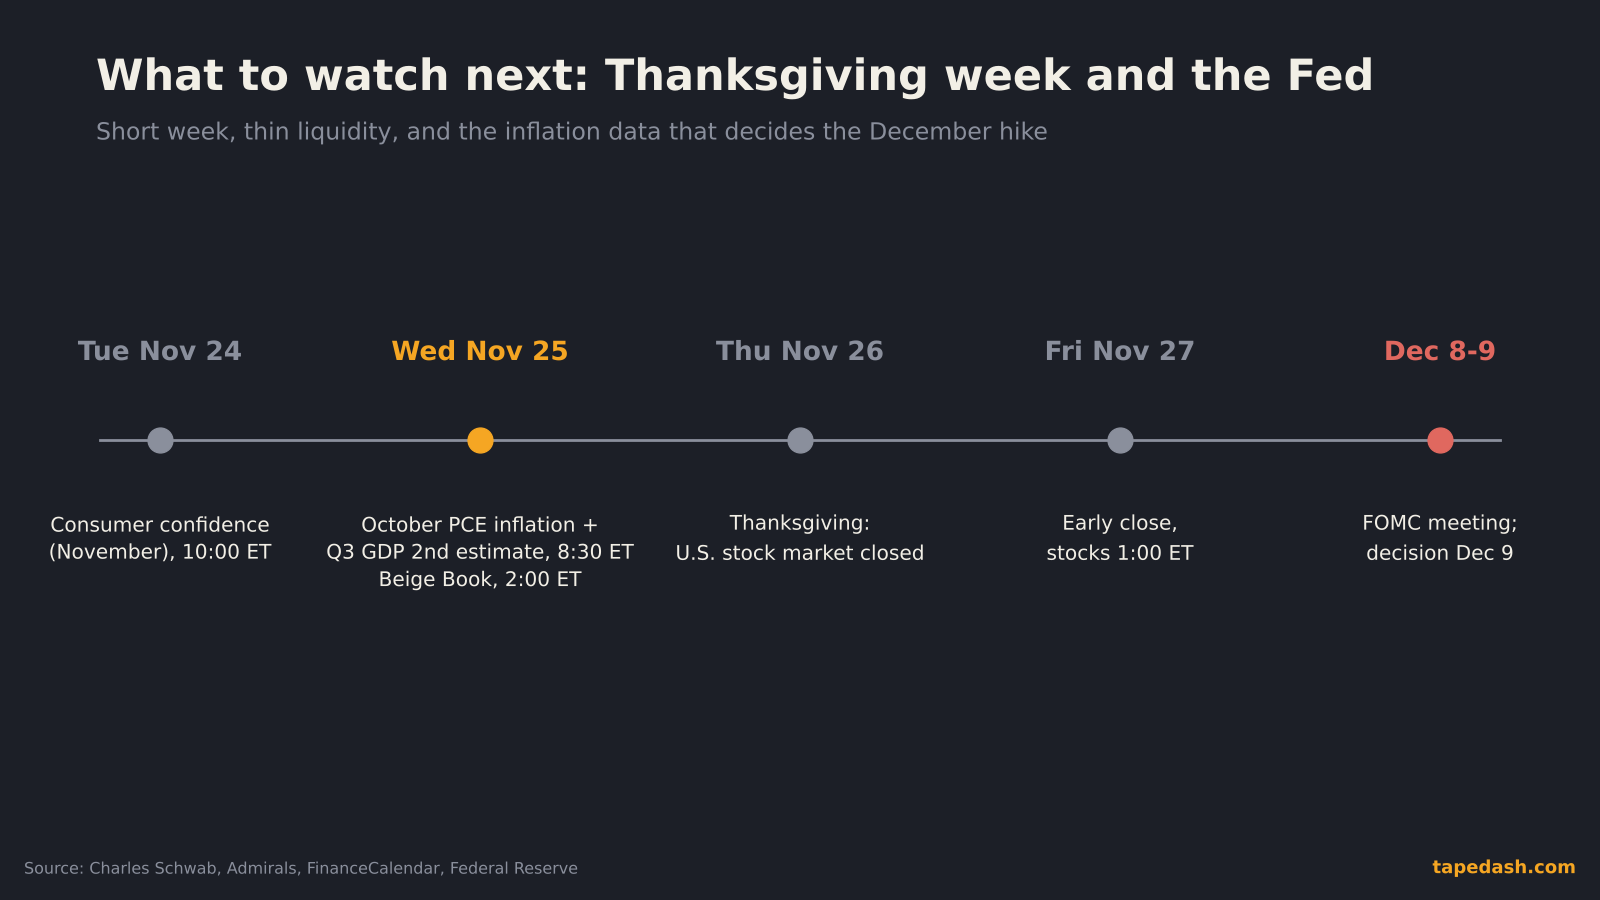
Tuesday, Nov. 24: The Conference Board’s November consumer confidence index at 10:00 a.m. ET (Charles Schwab, Admirals). After a week like this, it’s a quick read on whether the selloff is reaching household confidence.
Wednesday, Nov. 25: The big day. October personal income and outlays, including PCE inflation, the Fed’s preferred gauge, and the second estimate of third-quarter GDP both come at 8:30 a.m. ET (Admirals, FinanceCalendar, Charles Schwab). The Fed’s Beige Book follows at 2:00 p.m. ET. A hot core PCE print would make the December hike close to certain. A soft one is the first thing that could pull the Fed leg out of the selling loop.
Thursday, Nov. 26 and Friday, Nov. 27: U.S. stock markets are closed for Thanksgiving, and Friday’s session ends early at 1:00 p.m. ET (Admirals, Charles Schwab). Thin holiday liquidity can exaggerate moves in either direction, so I wouldn’t read too much into Friday’s tape.
Tuesday, Dec. 8 and Wednesday, Dec. 9: The Federal Open Market Committee meets, with the decision on Dec. 9 (Federal Reserve, Admirals). With a hike mostly priced, the statement and the projections for 2027 matter more than the decision itself.
Two scenarios are worth keeping in mind. If PCE cools, hike odds slip and volatility starts to fall, this probably looks like the faster, shallower corrections in the table. If PCE runs hot while AI names keep making new lows, traders will start asking about the 20% line, and the comparison shifts toward 2018 or 2022.
How to track this correction with TapeDash
If you want to watch whether this correction is ending or spreading, these are the things we track. Dealer Gamma shows where dealer positioning flips between amplifying and absorbing index moves, which is the cleanest read on whether the mechanical part of the selling is still running. Macro Pulse puts PCE, fed funds odds and Treasury yields on one screen, which matters more than usual with a December hike in play.
For the leaders, the Live Scanner and options flow tools let you see whether big money is buying protection on the chip names or starting to buy the dip, and you can see it all together in the Terminal Preview. If you just want a calm morning read on flows and the calendar during a messy stretch, start with the free TapeDash Daily. And if you decide to go further, the first 200 members lock Pro at $69.99 a month on their account, even if they cancel and come back later.
Stock market correction FAQ
Is the stock market in a correction right now?
Yes. As of the Nov. 20, 2026 close, the S&P 500 and the Dow were each more than 10% below their record closes, which meets the standard definition of a correction. The Nasdaq Composite had its worst week since March 2020 and erased its 2026 gains.
What caused the stock market to drop this week?
A selloff in AI chip stocks, led by Nvidia, collided with rising expectations for a December Fed rate hike. Doubts about the returns on AI data-center spending, a Reuters report of an SEC investigation into Nvidia’s accounting and hawkish Fed comments all fed the decline.
How long do stock market corrections last?
It varies widely. Corrections that don’t become bear markets have often recovered within months, while the roughly one in three that turned into bear markets took much longer. The direction of interest rates has been a key factor in when past declines ended.
The one thing to remember
This correction started with AI, but history says it will probably end with rates. In 2018, 2020, 2022 and 2023, the low came when the outlook for the Fed turned. This time the Fed is still leaning the other way, which is why the inflation data on Wednesday matters more than any chip headline between now and the December meeting.
See it on the tape, not just in the headlines
TapeDash is a market research and data analytics platform for traders and investors: live options flow, dealer positioning, a real-time market scanner, stock ratings, and macro and earnings data in one terminal. Memberships open Black Friday, November 27, and the first 200 members lock Pro at $69.99 a month on their account, even if they cancel and come back later.
Join the waitlistClick through the terminalSee the track recordSources
- Yahoo Finance: Dow and S&P 500 enter correction, Nasdaq sinks 5% (Nov 20, 2026)
- Charles Schwab: Markets' November nightmare keeps getting worse (Nov 20, 2026)
- StockTitan: Stock market today, November 20, 2026
- STL.News: U.S. stock market weekly update ending Nov. 20, 2026
- Stocktwits: Nasdaq 100 ends worst week since 2020, S&P 500 in correction territory (Nov 20, 2026)
- Yahoo Finance (Zacks): Stock market news for Nov 20, 2026
- Plus500: Every major stock market correction since 1950 and how long recovery took (Jul 2026)
- Yardeni Research: S&P 500 corrections and bear markets
- AP via KSAT: A 10% drop for stocks is scary, but it isn't that rare (Mar 13, 2025)
- E*TRADE: Correction realities (Mar 20, 2025)
- The Motley Fool via Nasdaq: How long do stock market corrections last?
- Charles Schwab: How to invest during a bear market (Aug 2025)
- Admirals: PCE report 25 November 2026, time and what to watch
- Admirals: Is the stock market open on Black Friday 2026?
- FinanceCalendar: US Personal Income and Outlays (PCE), Nov 25, 2026
- Federal Reserve: December 2026 calendar
This article is for educational and informational purposes only. It is not financial, investment, medical or legal advice, and it is not a recommendation to buy or sell any security. Figures come from the sources listed and were checked on the date of publication; markets change quickly. Options trading involves substantial risk of loss.