What Is Dealer Gamma? How Gamma Exposure Moves Stocks
Dealer gamma explained in plain English: how market maker hedging can pin a stock or make it run, how gamma exposure (GEX) is estimated, and how to use it.
Some days the S&P 500 drifts inside a range so tight it feels glued in place. Other days the same index slices through a level and keeps going, with every bounce sold. The news flow on those two days can look similar. One of the biggest differences is often invisible on a price chart: how the options market’s dealers are positioned, and which way their hedging pushes.
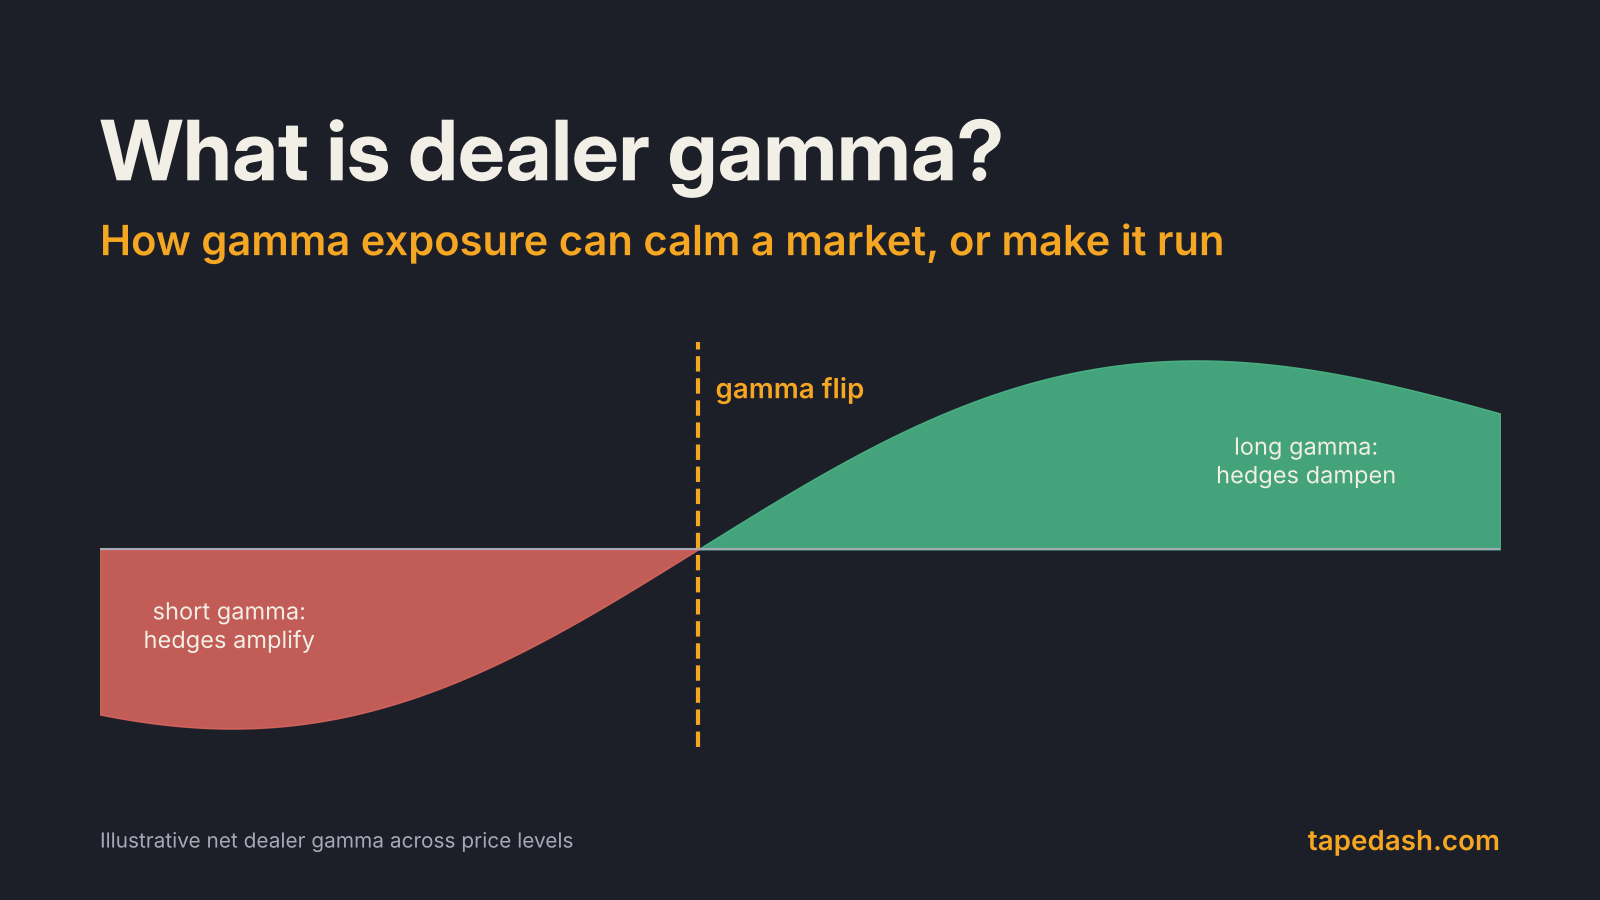
That is what dealer gamma describes. Options market makers sell and buy contracts all day, then hedge the directional risk with stock or futures. Gamma tells you how much that hedge has to change when the price moves. When dealers are long gamma, their hedging trades lean against the move, which tends to calm the market. When they are short gamma, their hedging chases the move, which can turn a normal day into a fast one. Gamma exposure, or GEX, is the market’s best estimate of which of those two worlds we are in.
This guide covers what gamma is, how dealer hedging turns it into real buying and selling, how GEX is calculated, where the models go wrong, and how we actually use it on the desk. With a Fed decision on Wednesday and the November monthly expiration a few weeks out, it is a good week to learn the mechanics.
- Gamma measures how fast an option’s delta changes. It is largest at the money and grows sharply as expiration approaches.
- Dealers hedge their delta. When gamma changes their delta, they have to trade the underlying, and that trading can either dampen or amplify the move.
- Positive dealer gamma tends to compress ranges and pin prices near big strikes. Negative dealer gamma tends to widen ranges and speed up breaks.
- GEX is an estimate, built on assumptions about who owns which options. Treat it as a map of where hedging pressure probably sits, not a signal by itself.
What dealer gamma means, in plain English
Start with delta. An option’s delta is how much its price changes for a $1 move in the stock, and it doubles as a rough hedge ratio: a call with a 0.50 delta behaves like 50 shares per contract. Gamma is the next layer down. The Options Industry Council defines it as the rate of change in an option’s delta for a one-unit move in the underlying, which is why its glossary calls gamma “a second-order option Greek.”
In practice, gamma tells you how unstable a hedge is. A deep in-the-money call already acts like stock, so its delta barely moves and its gamma is small. A far out-of-the-money call barely acts like stock at all, so its gamma is small too. The action is at the money, where a small move in price can swing the option from “probably expires worthless” to “probably finishes in the money.”
Time makes it sharper. As expiration gets closer, the zone where delta can flip from near 0 to near 1 narrows, so gamma near the strike gets much taller.
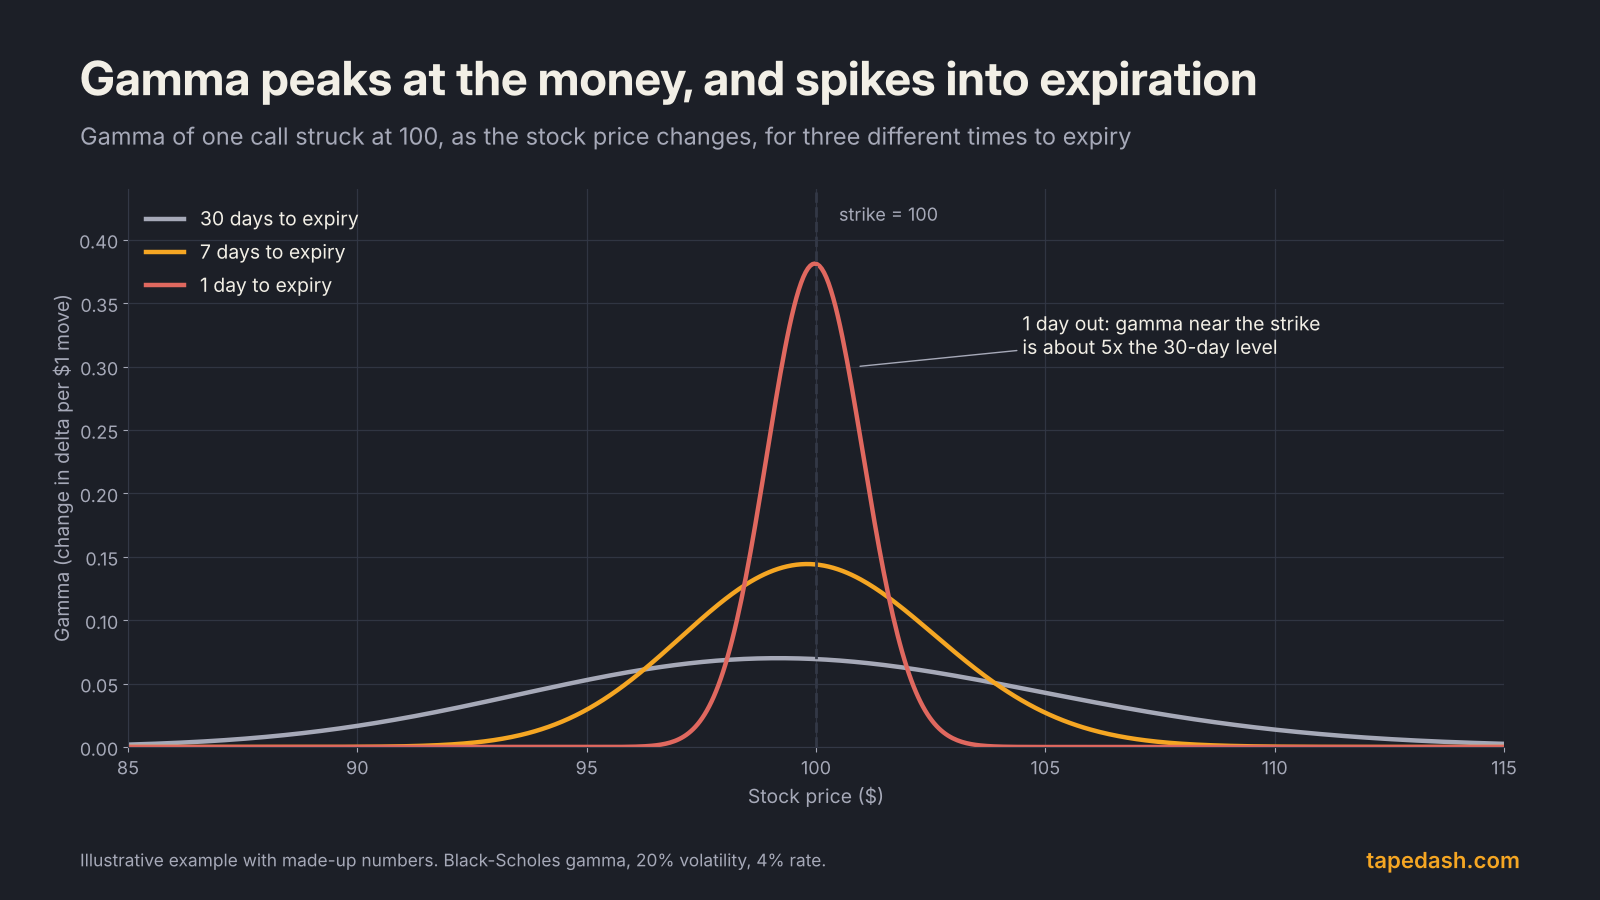
“Dealer gamma” simply adds up that sensitivity across every option the dealer community holds. When people say “dealers are long gamma,” they mean dealers on net own more options than they have sold, in the strikes that matter near the current price. “Short gamma” means the reverse.
How market maker hedging creates gamma exposure
Market makers are not in the business of betting on direction. They earn the spread and manage risk, and the main risk in a fresh options position is delta. So after they take the other side of a customer trade, they hedge by trading the underlying stock or futures until their book is close to delta-neutral.
The trouble is that delta does not sit still. Every move in the stock changes the delta of every option in the book, by an amount set by gamma. To stay neutral, the dealer has to keep trading. Here is the arithmetic in one picture.
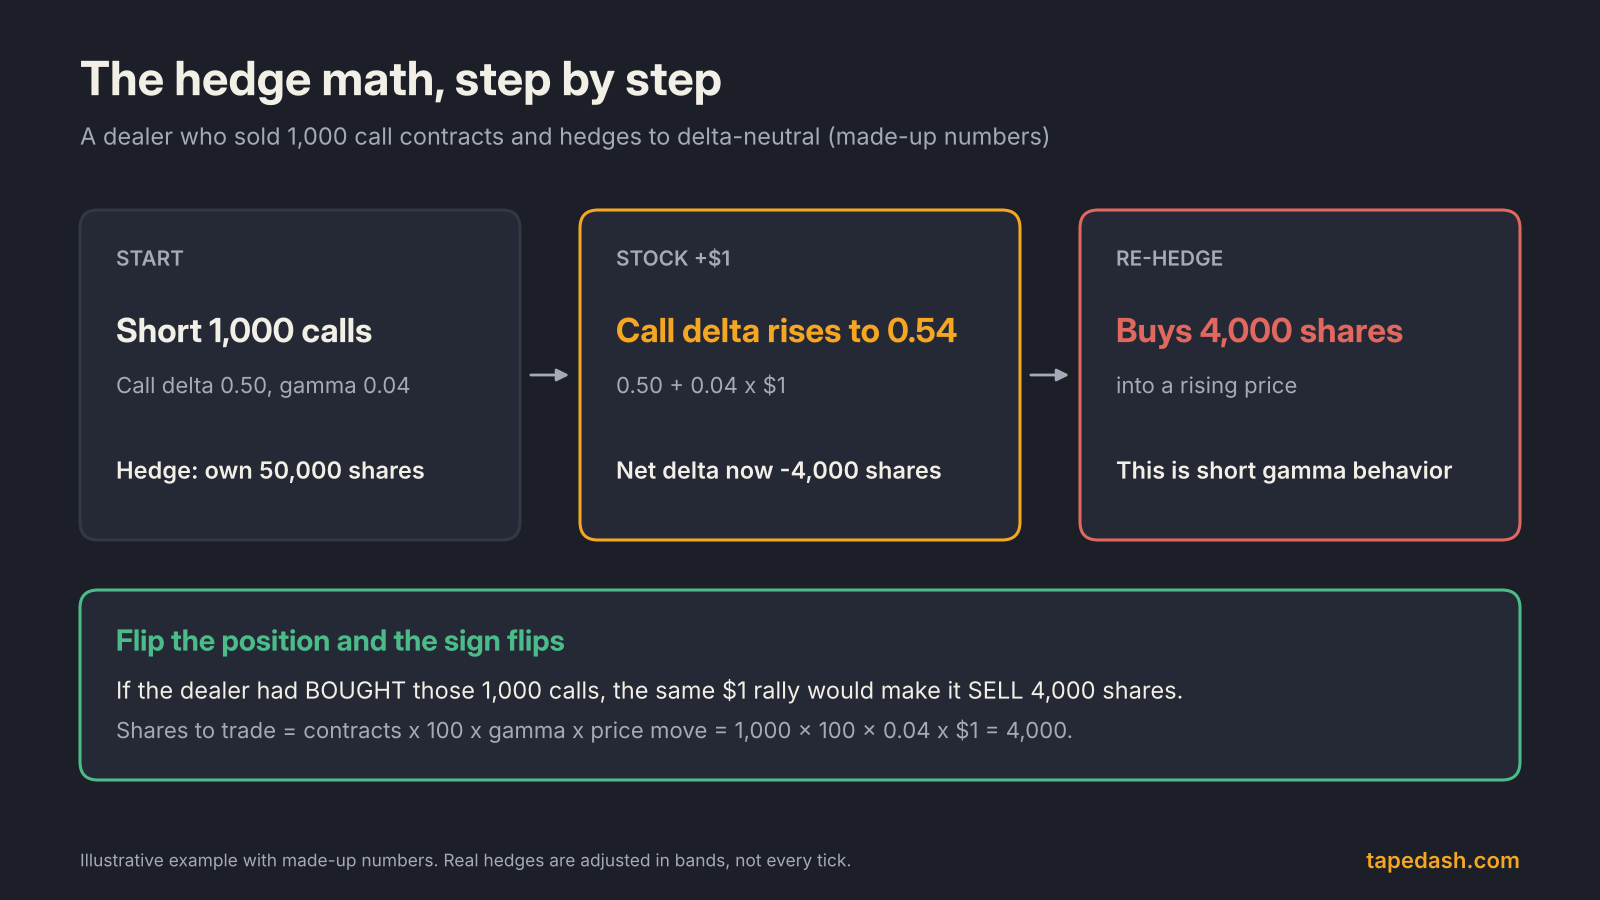
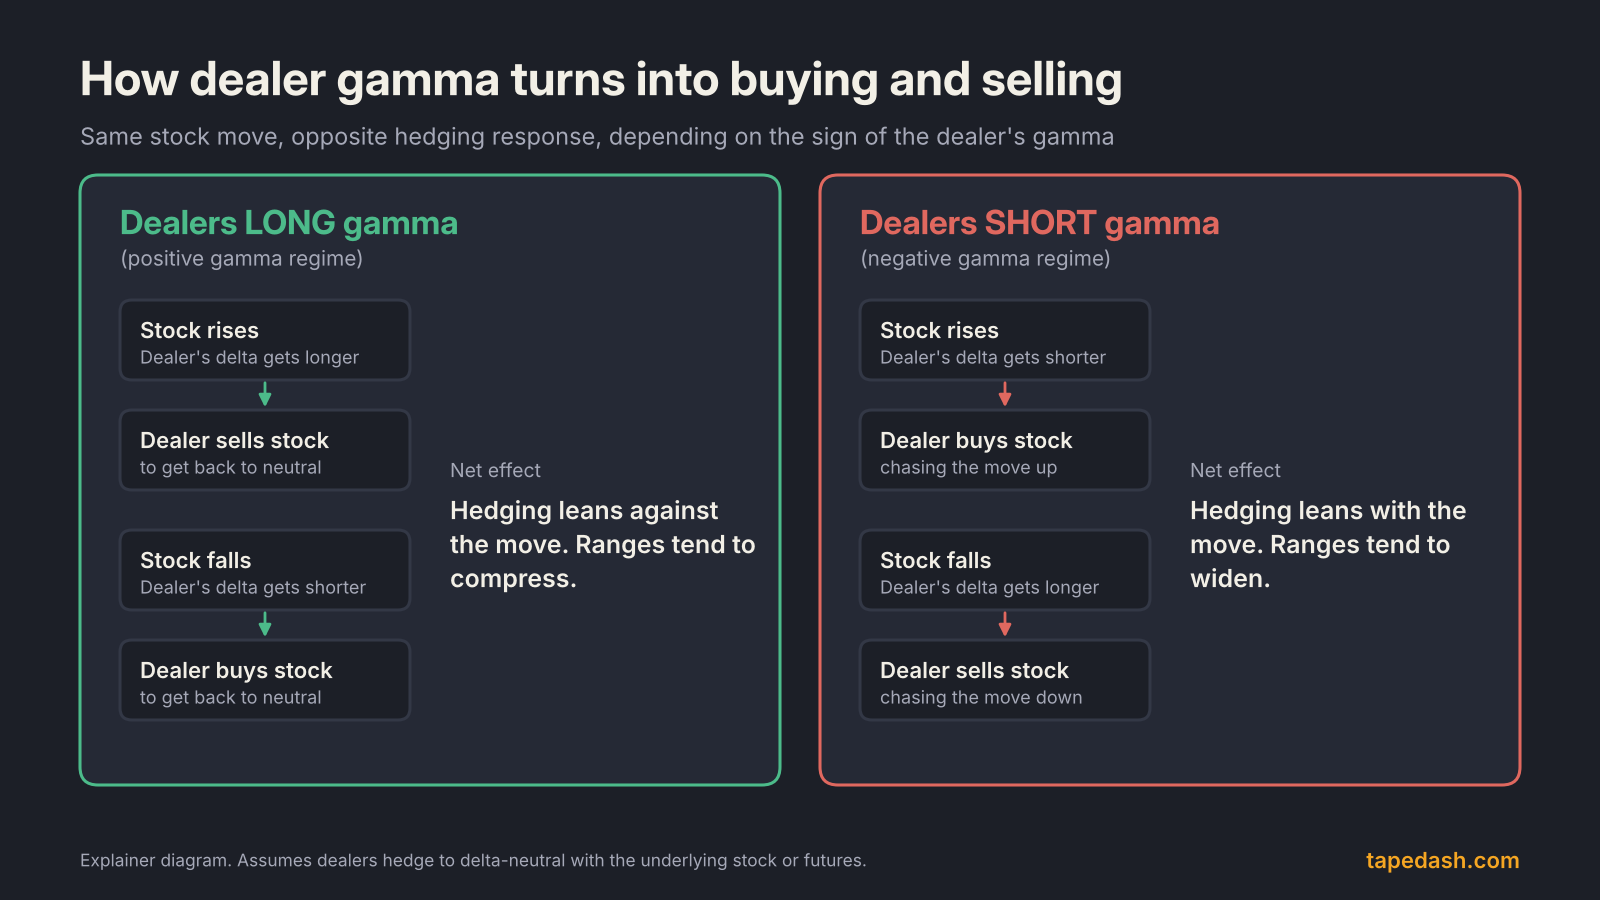
Look at the direction of that hedge. A dealer who is short calls has to buy shares as the stock rises and sell shares as it falls. That is short gamma behavior, and it pushes in the same direction as the price. A dealer who is long those same calls does the opposite, selling into strength and buying into weakness. That leans against the price.
Now multiply it across thousands of strikes and millions of contracts. If the aggregate dealer book is long gamma, the hedging flow acts like a shock absorber. If it is short gamma, the hedging flow acts like an accelerant.
Academic work points the same way. In a working paper titled Gamma Fragility, economists Andrea Barbon and Andrea Buraschi (research record) link large aggregate dealer gamma imbalances to intraday price patterns. In their data, negative gamma imbalance went with intraday momentum and positive imbalance with reversal, and the effect was strongest in the least liquid stocks.
Positive gamma vs negative gamma: what changes in price action
The two regimes leave different fingerprints on the tape. None of these are guarantees, because news, macro data and ordinary buying and selling still matter more than hedging on most days. But when you know which regime you are in, the price action starts to make more sense.
| Dealers long gamma (positive GEX) | Dealers short gamma (negative GEX) | |
|---|---|---|
| Hedging on a rally | Sell stock or futures | Buy stock or futures |
| Hedging on a selloff | Buy stock or futures | Sell stock or futures |
| Typical intraday range | Narrower, more two-way | Wider, more one-directional |
| Behavior near big strikes | Price tends to stall or pin | Price tends to slice through |
| Implied volatility | Often drifts lower | Often firms up or spikes |
| What tends to work | Fading extremes, selling premium carefully | Respecting momentum, smaller size, wider stops |
| Main risk | A catalyst that pushes price through the flip | Sharp reversals when shorts cover or hedges reset |
A detail that trips people up: positive gamma does not mean the market goes up, and negative gamma does not mean it goes down. Gamma is about the size and character of moves, not their direction. A long-gamma market can grind lower all day in a tight channel. A short-gamma market can rip higher in a squeeze.
How gamma exposure (GEX) is calculated
The most widely cited public framework comes from SqueezeMetrics, whose GEX white paper laid out the basic method many later tools build on. The recipe is simple to state.
For every strike and expiration, take the option’s gamma, multiply by its open interest, and multiply by 100 shares per contract. Then add a sign based on who you assume owns it. The paper assumes investors tend to sell calls (think covered calls and overwriting) and buy puts (think portfolio protection), which leaves dealers long calls and short puts. So call gamma counts as positive dealer gamma and put gamma counts as negative. Sum everything and you have net gamma exposure. Many vendors then convert it into dollars of hedging per 1% move, which makes it comparable across tickers.
Open interest is the key input, and it is worth knowing how it works. The Options Industry Council explains that it is the count of contracts still open, and that it only rises when both sides of a trade are opening new positions. That is why GEX is usually rebuilt each morning from the prior day’s open interest.
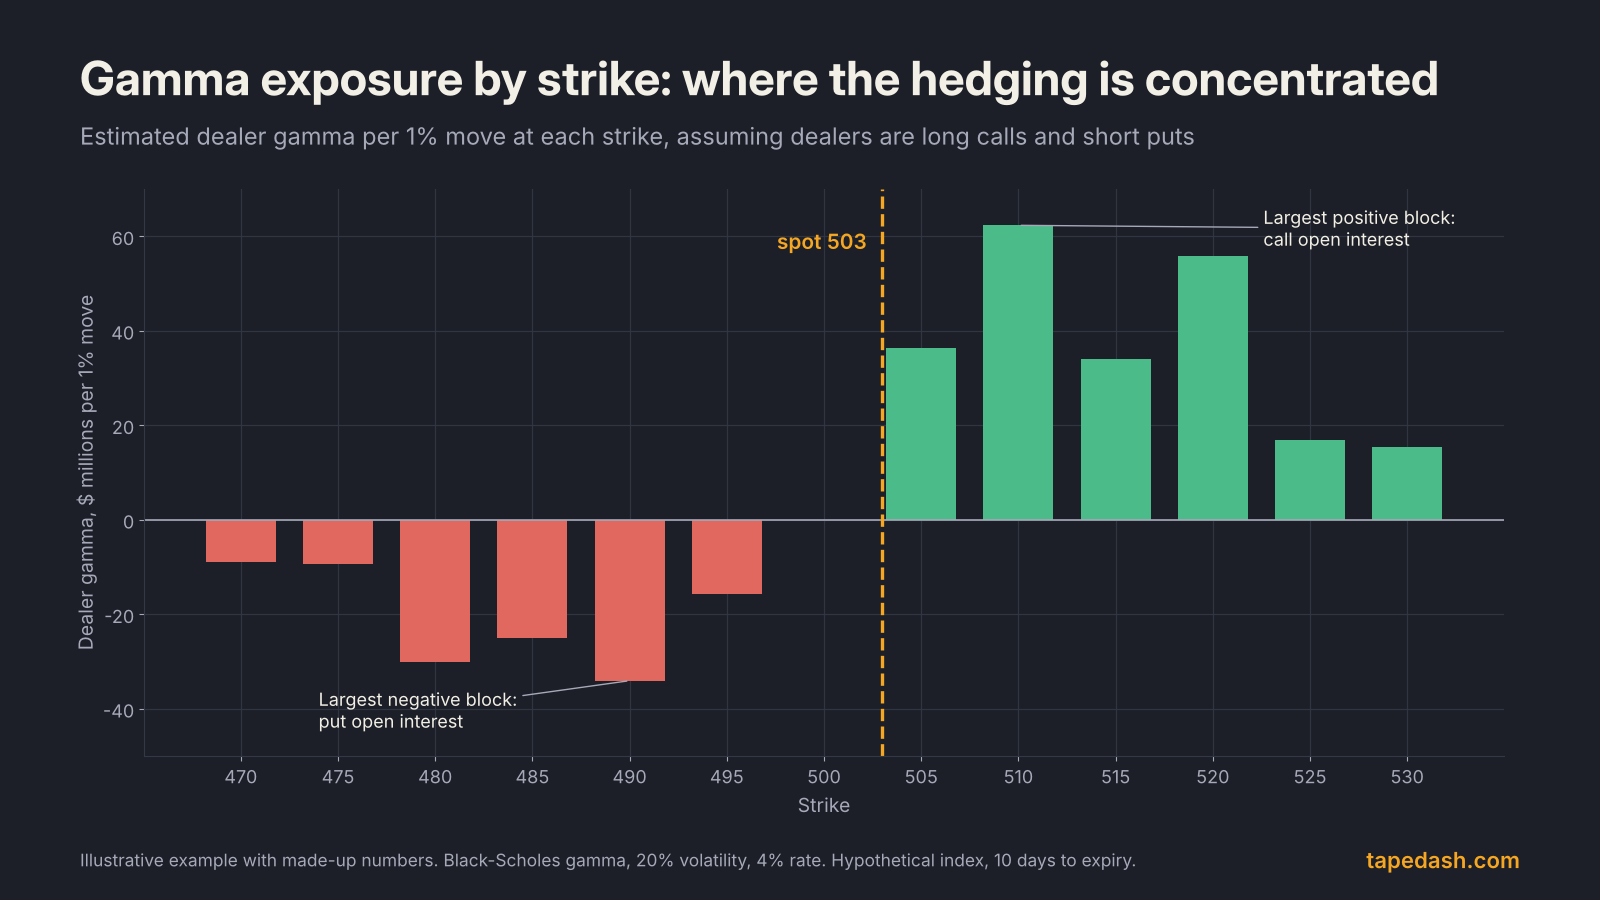
When you look at a GEX-by-strike chart like the one above, you are looking at where hedging activity is likely to cluster. Big positive bars above the price often act as areas where rallies slow down, because dealer hedging leans against moves toward them. Big negative bars below can act as trapdoors once price reaches them.
Why the sign convention matters so much
Everything in GEX rests on that “dealers are long calls and short puts” assumption. On an index like the S&P 500, where institutions buy a lot of put protection and sell a lot of calls against holdings, the assumption is reasonable most of the time. On a single stock where retail traders are buying calls in size, it can be backwards: dealers may be short those calls, and the call-heavy strikes become negative gamma rather than positive. That is one reason the same chart can mean different things for an index and for a hot single name.
The gamma flip level and why traders watch it
Net GEX is not a fixed number. Gamma depends on where the price is, so if you recompute the whole book at different hypothetical prices, you get a curve. The point where that curve crosses zero is called the gamma flip, or zero gamma level.
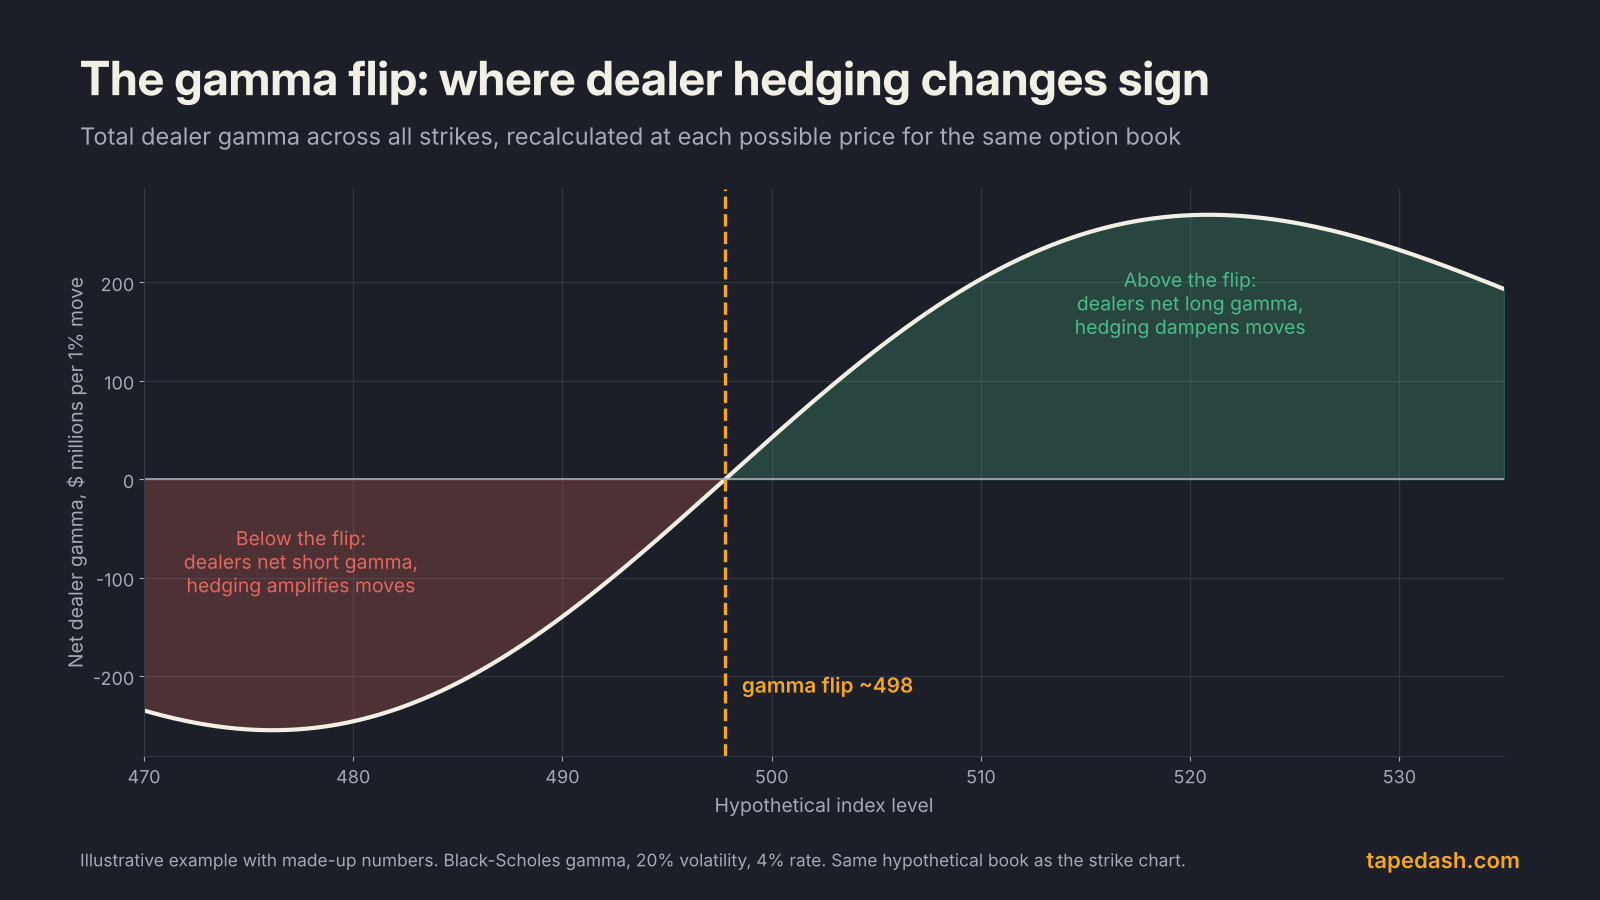
Above the flip, dealer hedging tends to stabilize. Below it, the stabilizer turns into an accelerant. SpotGamma’s explainer makes a fair point here: crossing the zero gamma line does not by itself trigger volatility. It changes how the market is likely to respond to whatever comes next. A quiet tape under the flip can stay quiet. A real catalyst under the flip tends to travel further than the same catalyst above it.
On the desk, we treat the flip as a regime boundary, not a price target. If the index is well above it, we expect mean reversion and are skeptical of breakouts. If the index is near or below it, we size down and give trades more room, because the market’s natural brake is gone.
Where gamma exposure models go wrong
GEX is useful precisely because dealer books are hidden. That is also its weakness. Every number you see is a model of positioning, not an observation of it. Here is where the models most often miss.
The ownership guess can be wrong. Open interest tells you how many contracts exist, not who is long them. A strike with 50,000 puts could be customers buying protection (dealers short gamma) or customers selling puts for income (dealers long gamma). The SqueezeMetrics paper is candid about this and lists its assumptions plainly, including that dealers hedge precisely to delta and that hedging bands are ignored because no one can observe them.
Same-day options move faster than daily data. GEX built from yesterday’s open interest misses positions opened and closed today. With same-day expirations now a large share of index options trading, that blind spot matters. Cboe’s own research, in a 2023 study and a 2025 follow-up, argues that customer 0DTE flow is closely balanced between buying and selling and that net market maker hedging from it is small relative to S&P 500 futures liquidity. Other analysts disagree about specific days. The honest takeaway is that intraday gamma is hard to measure, and anyone selling certainty about it is overselling. We cover same-day options in more depth in 0DTE options explained.
Dealers do not hedge every tick. Real desks hedge in bands and on schedules, use other options to offset risk, and net exposures across products. The clean feedback loop in the diagram is a tendency, not a rule.
Other flows can be bigger. Pension rebalancing, buybacks, leveraged ETF rebalancing near the close, and plain old repricing on news can swamp hedging flows. On a day like a Fed decision, the macro repricing usually dominates. If you want the setup for this Wednesday, see our Fed decision preview.
Gamma decays and rolls off. Big expirations remove a chunk of gamma at once. A market that was pinned all week can loosen up the following Monday simply because the options holding it in place expired.
How to use dealer gamma in your trading
Here is the process we use. It is deliberately simple, because the value of GEX is context, not precision.
- Check the regime before the open. Is net GEX positive or negative, and how far is the price from the flip? That single read tells you whether to expect a range day or a trend day as the default.
- Mark the two or three largest strikes. The biggest positive concentrations above the price and the biggest negative ones below are the levels where hedging pressure is likely to be heaviest. Put them on your chart next to your usual support and resistance.
- Match your tactics to the regime. In positive gamma, be careful chasing breakouts and look for moves to stall near big strikes. In negative gamma, respect momentum, cut size, and widen stops, because ranges tend to expand.
- Watch the calendar. Gamma near the strike grows into expiration, so pinning tends to be strongest in the days before a large expiry and the release afterward can be abrupt. The next standard monthly expiration is Friday, November 20, 2026, and the December quarterly expiration is Friday, December 18, according to the MarketXLS and Macroption calendars. Our guide to max pain and expiration pinning covers that week in detail.
- Confirm with price and flow. If the model says positive gamma but the index keeps making new lows on rising volume, believe the tape. The model is a prior, and prices update it.
The single biggest mistake we see is treating a GEX level as a precise line that price must respect. Think of it as the slope of the field. It tells you which way the ball tends to roll, not where it stops.
Frequently asked questions about dealer gamma
Is positive gamma bullish?
No. Positive dealer gamma is about volatility, not direction. It tends to produce smaller, choppier moves because dealer hedging leans against whichever way price goes. Markets can fall in a positive gamma regime; they just tend to fall in an orderly way.
What is the difference between gamma and gamma exposure?
Gamma is a property of a single option: how fast its delta changes. Gamma exposure is the sum of gamma across all open contracts, signed by who is assumed to own them, and usually scaled into shares or dollars of hedging. One is a Greek, the other is a market-wide positioning estimate.
Why do different GEX providers show different numbers?
Because they make different assumptions. Providers differ on which expirations they include, whether they adjust for intraday volume, how they split customer and dealer positioning, and how they scale the result. Two honest models can disagree on the exact flip level and still agree on the regime, which is the part that matters most.
How we track dealer gamma at TapeDash
If you want to watch this regime question day to day, start with the Dealer Gamma page in TapeDash. It is where we check, before the open, whether dealer positioning points to a pinned session or an open-field one, and which strikes are likely to carry the most hedging pressure. We read it alongside Max Pain and the Volatility Desk, because gamma, expiration and implied volatility tend to move together.
You can see the layout in the free Terminal Preview, with no account needed. If you would rather get the regime read in your inbox, join the TapeDash waitlist and free daily. When we open the doors, the first 200 members lock Pro at $99 a month for as long as they stay.
The one idea to remember
Dealer gamma does not tell you where the market is going. It tells you how the market is likely to travel. Long gamma tends to absorb moves and short gamma tends to amplify them, and knowing which one you are standing in is often the difference between fading a move and getting run over by it.
See it on the tape, not just in the headlines
TapeDash is the research desk for traders and investors: live options flow, dealer positioning, a real-time market scanner and trade alerts graded in public. Memberships open January 1, 2027, and the first 200 members lock Pro at $99 a month for as long as they stay.
Join the waitlistClick through the terminalSee the track recordSources
- SqueezeMetrics: Gamma Exposure (GEX) white paper
- SpotGamma: Gamma Exposure (GEX) explained
- Options Industry Council: Options glossary, Gamma
- Options Industry Council: Open interest, why it matters
- Barbon and Buraschi: Gamma Fragility (working paper)
- University of St. Gallen: Gamma Fragility, research record
- Cboe: Much Ado About 0DTEs, evaluating the market impact of SPX 0DTE options
- Cboe: 0DTEs Decoded, positioning, trends and market impact
- MarketXLS: Option expiration calendar 2026
- Macroption: Options expiration calendar
This article is for educational and informational purposes only. It is not financial, investment, medical or legal advice, and it is not a recommendation to buy or sell any security. Figures come from the sources listed and were checked on the date of publication; markets change quickly. Options trading involves substantial risk of loss.