The Put/Call Ratio Explained: Reading Fear and Greed in Options
The put/call ratio measures fear and greed in options. How equity, index, open-interest, 0DTE and premium-weighted ratios differ, and how to use them.
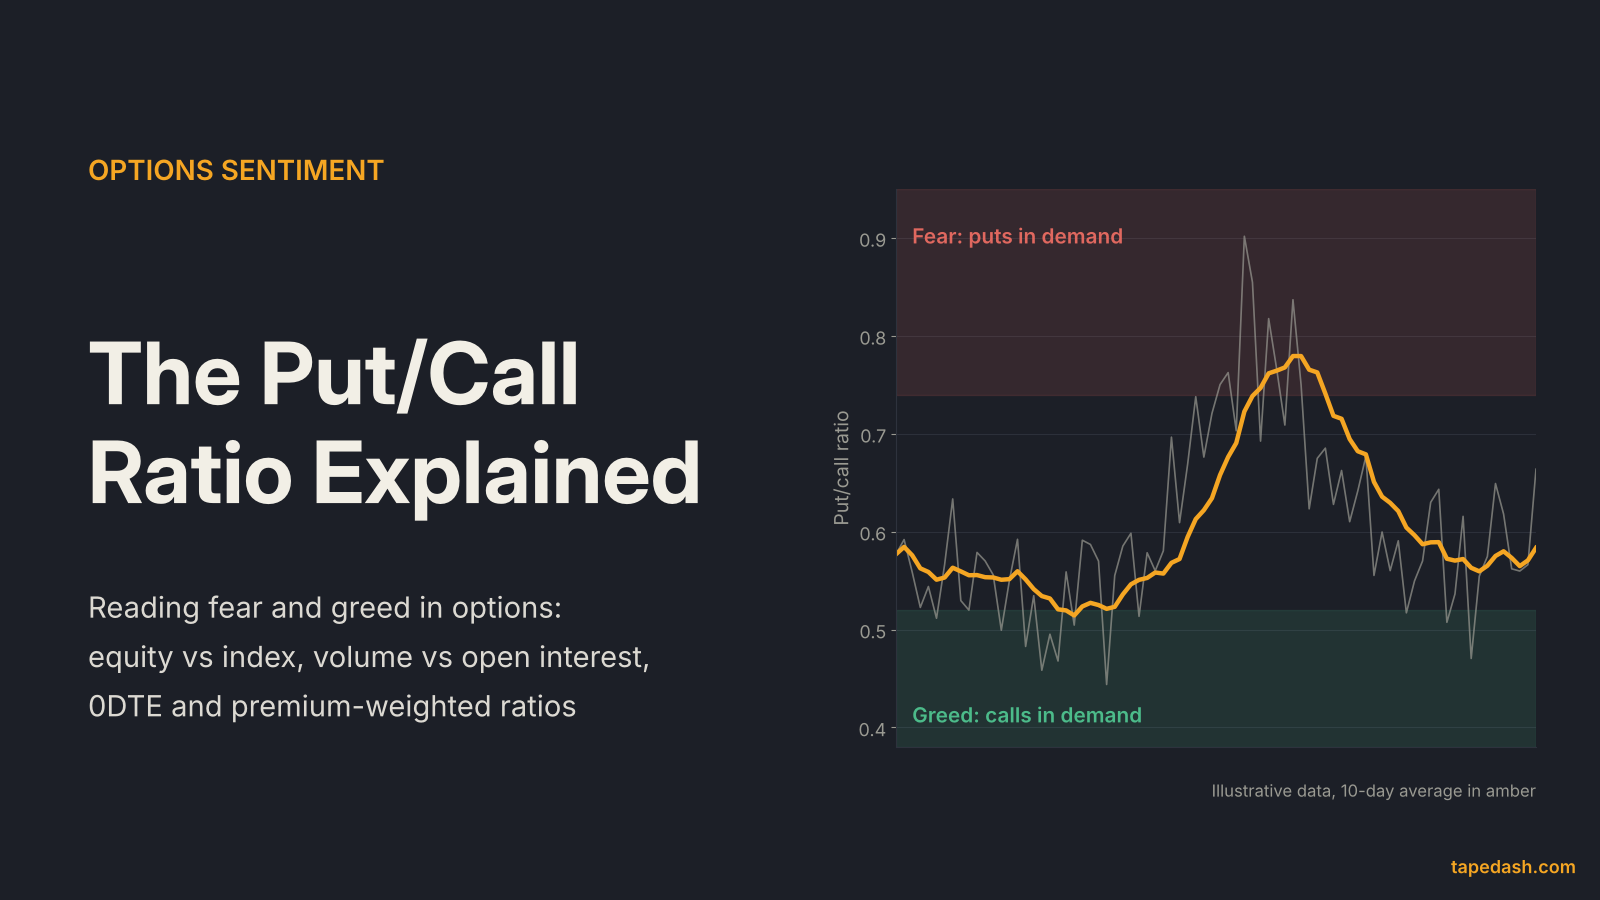
The put/call ratio is the number of put options traded divided by the number of call options traded. When it rises, traders are buying more downside protection relative to upside bets, which reads as fear. When it falls, calls dominate, which reads as greed. Most traders use it the opposite way from how it sounds: an extreme reading in either direction is treated as a sign the crowd has already leaned too far.
That is the textbook version, and it is about half right. The number you see quoted depends on which options go into it (single stocks, indexes or everything), whether it counts trades or open positions, whether it counts contracts or dollars, and, since same-day expirations took over S&P 500 index volume, how much of it is intraday noise. Cboe still publishes the classic ratios every session on its daily market statistics page, but reading them well in 2026 takes more care than it did a decade ago.
This guide covers each version of the put/call ratio, why index puts mostly tell you about hedging, what the research says about contrarian signals, how 0DTE changed the readings, and a step-by-step method with a hypothetical worked example you can copy.
- The put/call ratio divides put volume by call volume. Above 1.0 means more puts traded than calls; below 1.0 means more calls.
- The equity-only ratio is the cleanest sentiment read. The index ratio runs higher because institutions buy index puts as portfolio insurance, so a high reading is often hedging, not a bet.
- Used as a contrarian indicator, the signal comes from extremes in a smoothed ratio measured against its own recent range, not from any fixed number like 1.0.
- 0DTE options were 59% of SPX volume in 2025 and a record 66.2% in July 2026, so index ratios now reflect a lot of same-day trading.
- Premium-weighted ratios count dollars instead of contracts and can point the opposite way from the standard ratio on the same day.
What is the put/call ratio?
The formula is simple. Take the number of put contracts that traded in a session and divide by the number of call contracts. If 900,000 puts and 1,000,000 calls change hands, the ratio is 0.90. If puts and calls trade in equal numbers, it is exactly 1.0.
The idea goes back decades. Martin Zweig, the market analyst and fund manager, is credited with developing the put/call ratio as a sentiment tool, according to the Boston Globe’s obituary and a 2004 article in Technical Analysis of Stocks & Commodities. The logic was behavioral. Buying a put is a bearish act or a fearful one. Buying a call is bullish. Tally both across the market and you get a rough census of mood.
Two points to settle before going further. The standard ratio uses volume, which is what traded today. And it does not know who bought and who sold. Every trade has both a buyer and a seller, so “put volume” includes puts sold by people who are calm enough to write insurance, not only puts bought by people who are scared. Keep that in mind, because it is the root of most bad readings.
Equity vs index vs total put/call ratio
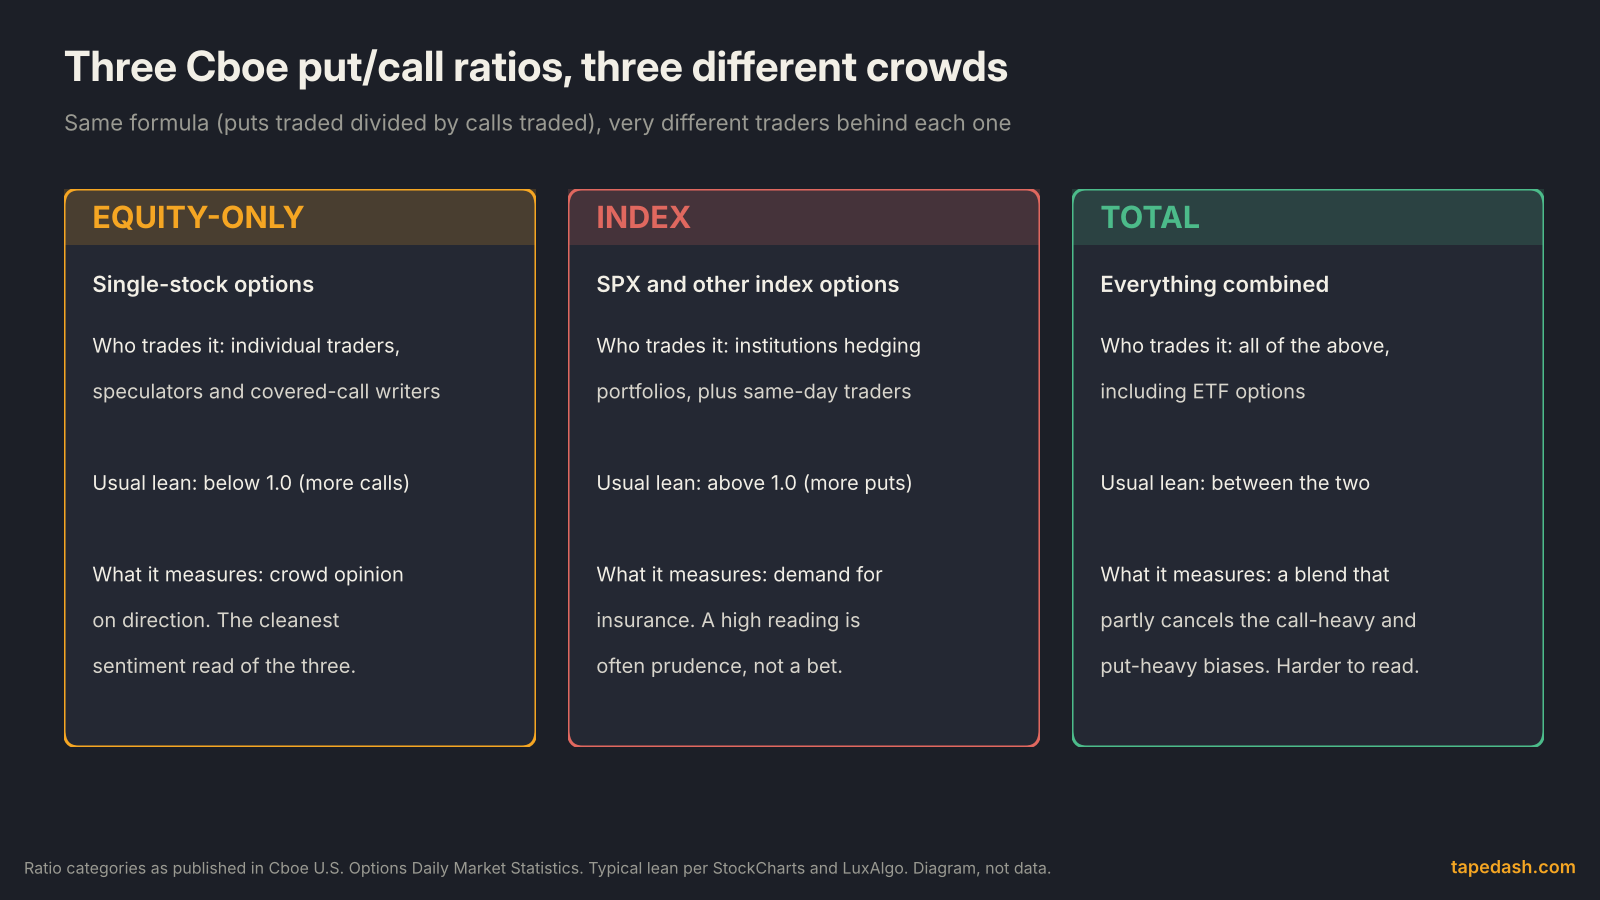
Cboe’s daily statistics break the ratio into several lines, including a total put/call ratio, an index ratio, an exchange-traded products ratio, an equity ratio, and a separate line for SPX and SPXW options. These are not interchangeable. Each one has a different crowd behind it.
Why the equity put/call ratio usually sits below 1.0
The equity-only ratio covers options on individual stocks. StockCharts notes that it usually trades below 1.0, meaning call volume generally exceeds put volume, and ties that to individual traders who tend to lean bullish and to investors writing covered calls for income. Because single-stock options are where directional speculation lives, the LuxAlgo guide and most practitioners treat the equity-only line as the preferred sentiment read.
Why index puts are mostly hedges
The index ratio usually sits above 1.0. The reason is not that index traders are perpetually bearish. It is that institutions own enormous stock portfolios and buy index puts to protect them. A pension fund buying S&P 500 puts against a long equity book is buying insurance, the same way a homeowner buys fire coverage without expecting a fire. StockCharts puts it plainly: institutions buy puts to hedge their long positions.
That changes how to read a spike. A jump in the index ratio can mean professionals are adding protection into an event, rolling hedges before expiration, or rebalancing after a rally made their portfolios bigger. None of those are predictions that the market will fall. A high index reading is often prudence, and prudence is not the same thing as panic.
What the total ratio adds, and what it hides
The total ratio blends everything, which partly cancels the call-heavy equity bias against the put-heavy index bias. That blending is also its weakness. If index hedging surges while single-stock traders stay calm, the total ratio rises and looks fearful even though the speculative crowd has not moved. When I want a sentiment read, I start with equity-only and treat the index line as a gauge of hedging demand.
Volume vs open interest put/call ratio
Volume and open interest measure different things. Volume counts contracts traded during a session. Open interest counts contracts still outstanding at the end of it. As the Wikipedia summary puts it, a volume-based ratio reflects short-term trading while an open-interest ratio reflects existing positions.
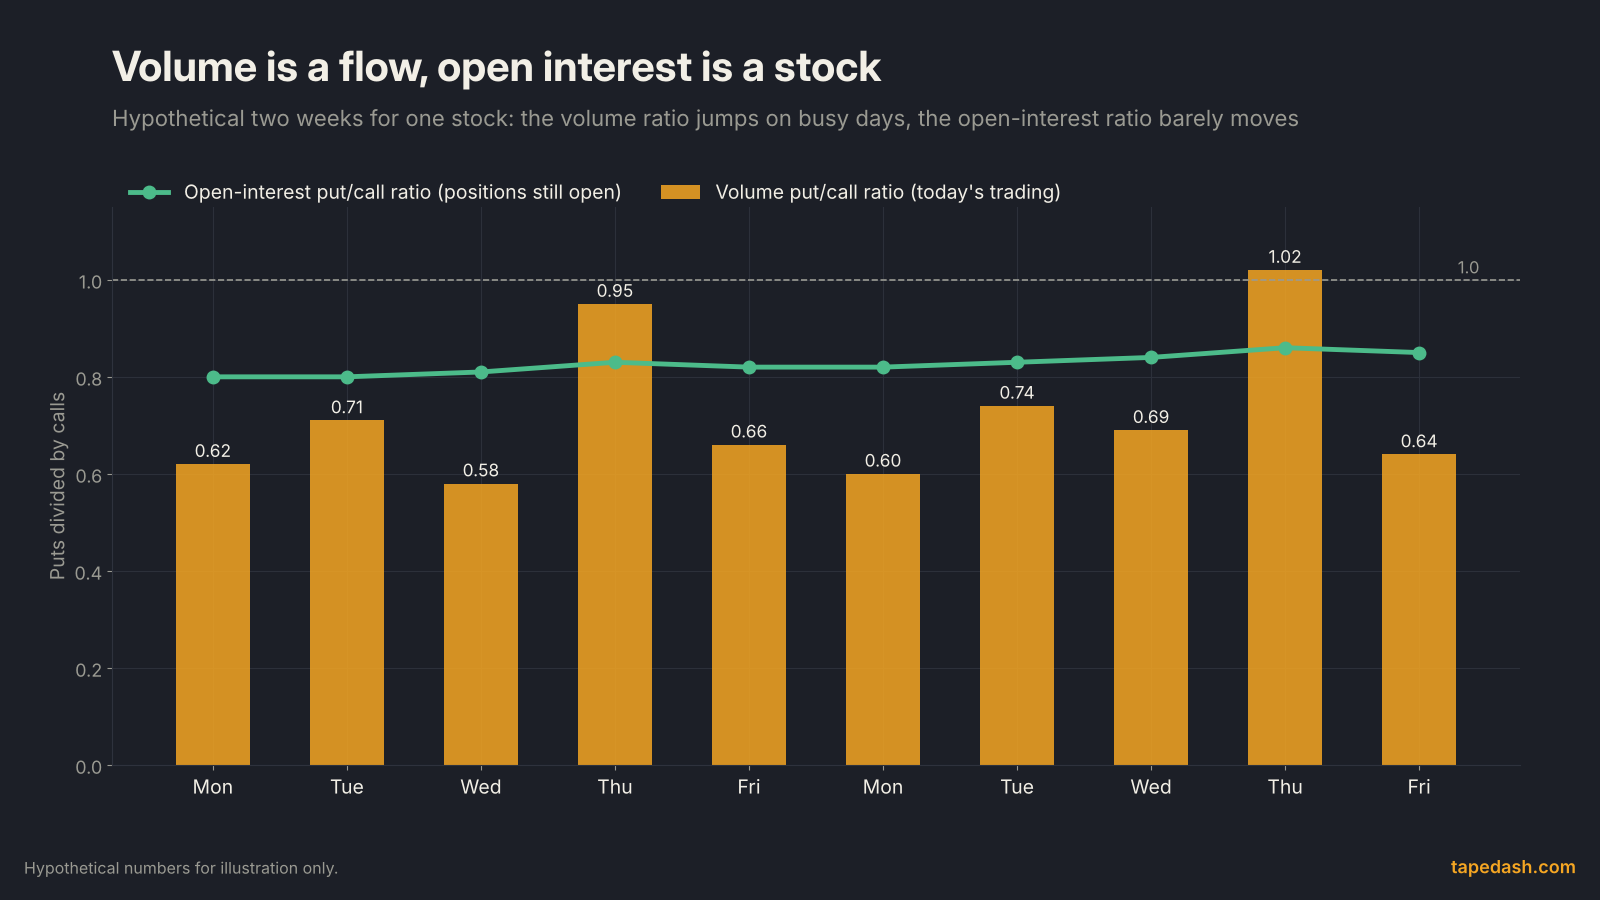
Think of volume as the flow and open interest as the stock of positions. A volume ratio can jump from 0.58 to 0.95 in a day because one fund bought a block of puts, then fall back the next session. The open-interest ratio changes slowly because it only moves when positions are opened or closed on net. LuxAlgo notes that some traders use the open-interest version as context around expirations, which makes sense: it tells you where positioning has piled up, the same raw material behind max pain and dealer gamma maps.
For timing sentiment, volume is the standard. For understanding the structure of a single stock’s options chain, open interest is more useful. Mixing them up is a common source of confusion when two websites quote different put/call ratios for the same ticker on the same day.
Contract-count vs premium-weighted put/call ratio
The standard ratio treats every contract as equal. A $0.05 lottery-ticket put counts the same as a $40 in-the-money put. That is a real distortion, and it is the reason premium-weighted (or dollar-weighted) ratios exist.
A weighted ratio multiplies each option’s volume by its price, sums puts and calls separately, and divides. Option Strategist frames it as measuring how much money put buyers are spending, which a contract count cannot show. The Hamzei and Star article in Stocks & Commodities made the same critique of the traditional ratio two decades ago: it treats all contracts as equal.
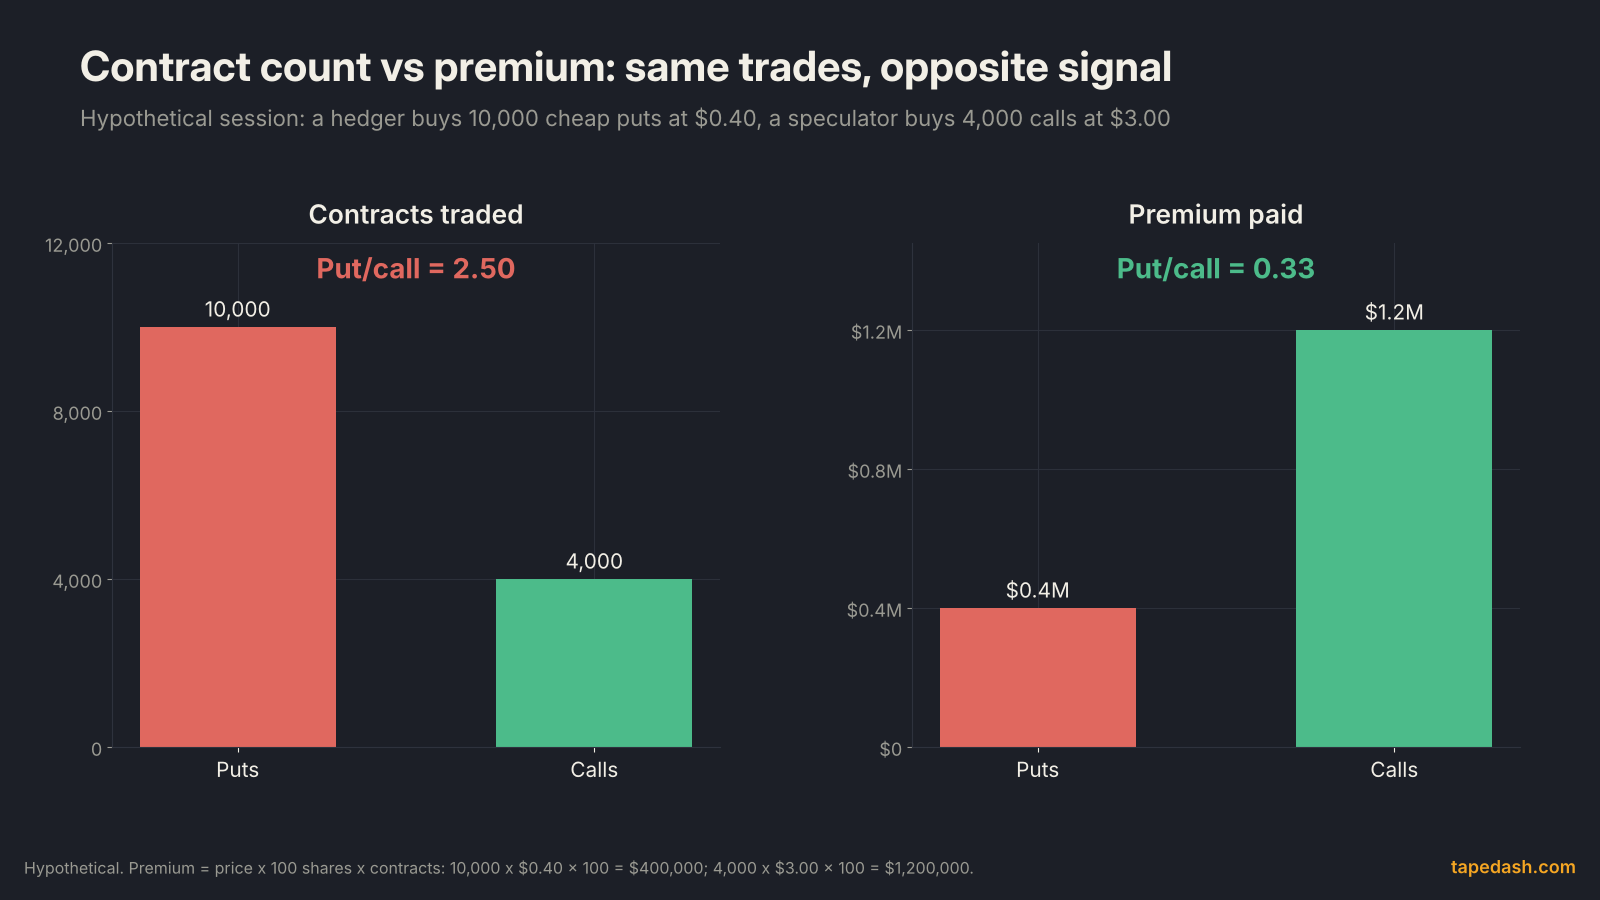
Here is a hypothetical session to make it concrete. A hedger buys 10,000 out-of-the-money puts at $0.40. Each contract covers 100 shares, so that costs $400,000. A speculator buys 4,000 calls at $3.00, which costs $1,200,000. By contract count, the put/call ratio is 10,000 divided by 4,000, or 2.50. By premium, it is $400,000 divided by $1,200,000, or 0.33. The contract count screams fear. The dollars say the real conviction was on the call side.
Option Strategist makes the same point with the hedger and the speculator: cheap out-of-the-money puts bought for protection inflate the standard ratio without much dollar weight, while a bearish speculator tends to buy pricier at-the-money or in-the-money puts, which moves the weighted ratio. It also notes the weighted version tends to produce more extreme readings at turning points. When the two ratios disagree, I trust the dollars more for direction and the contract count more for a read on how much insurance is being bought.
How 0DTE options changed the put/call ratio
Same-day options have reshaped the index side of this indicator. Cboe reported that SPX 0DTE options averaged about 2.3 million contracts a day in 2025, or 59% of total SPX volume, a figure also reported by Markets Media. In July 2026 the share hit a record 66.2%, per Cboe and Trade Informer.
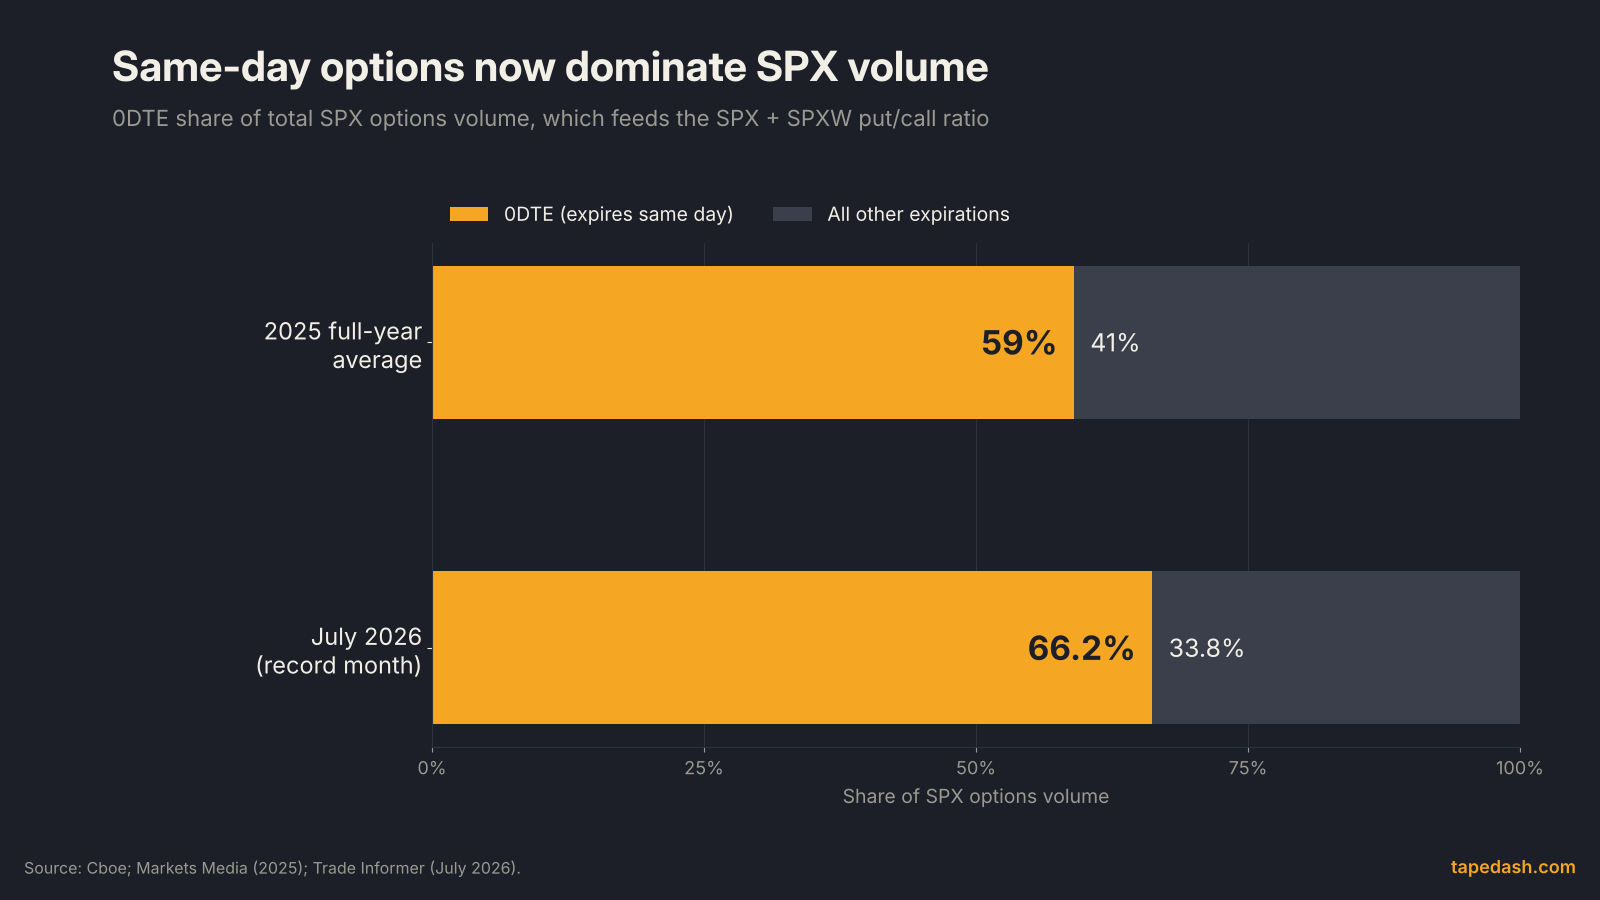
That matters because the SPX + SPXW put/call ratio on Cboe’s page now mostly reflects contracts that expire within hours. A 0DTE put can be a hedge, but it is just as likely to be a day trader shorting the open for 40 minutes, or a premium seller writing puts they expect to expire worthless. Cboe’s own research describes customer 0DTE activity as “extremely balanced” between buying and selling. A volume ratio built on a market that balanced tells you about activity, not about which way the money leans.
The old reading of the index ratio assumed that most index puts were slow-moving portfolio protection. That assumption is weaker now. Three adjustments help. Look at the equity-only ratio first, since the same-day boom is centered on index products like SPX. When you want the index view, separate flow by days to expiration, so same-day trades do not drown out the longer-dated hedges. And look at premium, ideally net premium (bought minus sold), rather than raw contract counts. If you want the deeper mechanics of same-day contracts, our guide to 0DTE options covers how they work and why they move so fast.
Is the put/call ratio a contrarian indicator?
At the market level, mostly yes. The logic is that by the time put buying hits an extreme, the people inclined to sell or hedge have largely done so, which leaves less selling pressure ahead. The reverse applies when call buying reaches a frenzy. Option Strategist suggests smoothing the daily ratio with a moving average, such as 21 days, and reading buy signals near the top of the chart (heavy bearishness) and sell signals near the bottom.
Two cautions keep this honest.
The extremes move
There is no permanent “fear level.” A StockCharts analysis of 2022 described how the ratio’s range shifted after the market topped in late December 2021: bottoms came with higher readings than before, and rallies peaked at readings that were not as low. Thresholds that worked in 2021 stopped working. LuxAlgo makes the same recommendation most practitioners do, which is to compare a smoothed reading with the series’ own recent range rather than fixed levels. Structural changes like the 0DTE boom move the range too.
For single stocks, put buying can be informed
The contrarian story is about the crowd. Individual stocks can work the other way. Jun Pan and Allen Poteshman built put/call ratios from options bought to open new positions, using Cboe data, and found that stocks with low ratios outperformed stocks with high ratios by more than 40 basis points the next day and by more than 1% over the next week. The work appeared as an NBER working paper and in the Review of Financial Studies in 2006, as summarized by the SUFE academic newsletter. The authors attributed it to option traders holding non-public information.
So the same indicator means different things at different scales. Heavy put buying across the whole market at an extreme often marks exhausted fear. Heavy opening put buying in one stock may mean someone knows something. That is why we read single-name flow trade by trade, which we cover in how to read options flow.
Put/call ratio types compared
| Ratio | What goes in | Who dominates | What a high reading usually means | Best use |
|---|---|---|---|---|
| Equity-only (volume) | Single-stock options traded today | Individual traders, speculators, covered-call writers | Speculators turning fearful | Market sentiment, contrarian extremes |
| Index (volume) | SPX and other index options | Institutional hedgers, same-day traders | More hedging, or busy 0DTE trading | Gauge of insurance demand |
| Total (volume) | Everything combined | A blend | Depends on which side moved | Quick overview, hard to interpret alone |
| Open interest | Contracts still open | Accumulated positions | Put positioning has built up | Expiration context, strike maps |
| Premium-weighted | Volume times price | The money with conviction | Dollars flowing into puts | Confirming direction behind the counts |
| Opening-buy, single stock | Puts and calls bought to open | Possibly informed traders | Possible bearish information | Single-name flow, not market timing |
How to use the put/call ratio, step by step
Here is the process we use, with a fully hypothetical example so every step is visible. None of these numbers are real market data.

- Pick the right ratio. For market sentiment, start with the equity-only ratio. Use the index line separately as a read on hedging demand.
- Smooth it. Daily readings are noisy. In our example the daily ratio jumps to 0.90 on a single session, which tells you very little by itself. A 10-day average works for shorter swings, and Option Strategist’s 21-day average suits slower ones.
- Define extremes from its own history. In the example, the top 10% of the past year’s 10-day readings starts at 0.72 and the bottom 10% at 0.52. Those cut-offs are what count, not the 1.0 line. Recalculate them as the range shifts.
- Note the trigger, then wait. Around session 43, the 10-day average crosses 0.72 while the index is sliding. That is the alert, not the entry. Fear can keep building, and here it does, with the average peaking near 0.78 six sessions later.
- Cross-check the other ratios. Ask whether the index ratio is spiking too (more hedging) and whether premium-weighted flow agrees. If the contract count says fear but the dollars are still flowing into calls, the signal is weaker.
- Require price confirmation. In the example, the index closes above its prior 10-day high around session 54, after the average has started rolling over. Now the sentiment extreme and the price agree.
- Define where you are wrong. A natural line in the example is the low of the selloff. If the index breaks it, the fear was justified and the contrarian read failed. Size the position so that breaking that level is a loss you can absorb.
The same steps work in reverse for complacency: the average sinking into the bottom of its range, rolling back up, then price failing to make a new high. In my experience the complacency version is slower and less reliable than the fear version, because complacency can last a long time.
What to watch next for options sentiment
Expiration weeks distort these ratios, because traders roll and close positions in bulk. The next standard monthly expiration is Friday, November 20, 2026, and the one after that is December 18, a quarterly triple witching date when stock options, index options and index futures expire together. Expect the index ratio in particular to get jumpy in the days before each.
The Fed’s next meeting is December 8 to 9, with new economic projections, per the Federal Reserve and Thrive in Markets. Event weeks tend to pull in hedging ahead of the decision, which lifts the index ratio without saying much about direction. And Cboe’s monthly volume reports, published in the first days of each month, are worth a glance to see whether the 0DTE share keeps climbing after July’s record, because the more same-day flow there is, the noisier the SPX ratio becomes.
How TapeDash tracks call vs put premium
If you want to watch the put/call balance the way we read it on the desk, by dollars rather than contract counts, these are the pages to use. Market Tide is a running, market-wide tally of net options premium for the session: money going into calls minus money going into puts, drawn as a line through the day. It answers the question the premium-weighted ratio was invented to answer, and it makes divergences obvious, such as price grinding higher while the tide fades.
DTE Tide splits net call and net put premium by expiration, with 0DTE and weekly options shown separately, across Equity, Index, ETF and combined panels. That is the 0DTE fix from earlier in practice. You can see whether a put-heavy session is same-day trading in index options or real demand in single stocks, and the page itself notes that index put buying is often hedging. The Flow tape shows the individual prints behind those totals, so a lopsided reading can be traced back to the trades that caused it.
You can click through the layout of Market Tide and the Flow tape in the Terminal Preview, free and without an account. If you would rather get the read after the close, the free TapeDash Daily covers what moved and why each evening, and the first 200 members lock Pro at $99 a month for as long as they stay.
Put/call ratio FAQ
What is a good put/call ratio?
There is no single good number. The equity-only ratio usually sits below 1.0 and the index ratio usually sits above it, so the same reading means different things on each. What matters is where a smoothed reading sits within its own recent range. A reading in the top tenth of the past year is a fear extreme for that series. A reading in the bottom tenth is a complacency extreme.
Is a high put/call ratio bullish or bearish?
Taken literally, a high ratio means traders are buying more puts, which is bearish sentiment. Contrarians read a market-wide extreme as potentially bullish, because fear that intense often marks exhausted selling. For a single stock with heavy opening put buying, research by Pan and Poteshman suggests the opposite: that flow has historically been followed by weaker returns.
Where can I find the Cboe put/call ratio?
Cboe publishes its total, index, ETP, equity and SPX + SPXW ratios each session on its daily market statistics page. Charting platforms carry them too. StockCharts, for example, lists them as CPCE for equity-only, CPCI for index and CPC for the total, each with a dollar-sign prefix.
The one idea to keep
The put/call ratio is a census of how traders are positioned for fear and greed, but a census is only as useful as its categories. Start with the equity-only ratio, smooth it, judge it against its own history, weigh dollars over contract counts, and remember that two-thirds of S&P 500 index options now expire the day they trade. Read that way, an extreme reading is a reason to pay attention. Read carelessly, it is just a number that says 0.90.
See it on the tape, not just in the headlines
TapeDash is the research desk for traders and investors: live options flow, dealer positioning, a real-time market scanner and trade alerts graded in public. Memberships open January 1, 2027, and the first 200 members lock Pro at $99 a month for as long as they stay.
Join the waitlistClick through the terminalSee the track recordSources
- Cboe: U.S. Options Daily Market Statistics
- StockCharts: Put/Call Ratio, equity versus index (CPCI, CPCE)
- LuxAlgo: Put/Call Ratio concept guide
- Wikipedia: Put/call ratio
- StockCharts: Put/Call Ratio range shift (2022)
- Boston Globe: Martin Zweig, 70; analyst predicted 1987 stocks crash (Feb 20, 2013)
- Technical Analysis of Stocks & Commodities: Dollar-Weighted Put/Call Ratios, Hamzei and Star (April 2004)
- Option Strategist: Understanding the difference between the standard and weighted put-call ratio
- Option Strategist: Weighted put-call ratios
- NBER: Pan and Poteshman, The Information of Option Volume for Future Stock Prices (w10925)
- SUFE Academic Newsletter: summary of Pan and Poteshman, Review of Financial Studies (2006)
- Cboe: The State of the Options Industry, 2025 (Jan 22, 2026)
- Markets Media: Cboe reports record trading volume for 2025 (Jan 7, 2026)
- Cboe: Market Metrics That Matter, derivatives July 2026 volume highlights
- Trade Informer: Cboe reports July growth as 0DTE reaches 66.2% of SPX volume (Aug 6, 2026)
- Cboe: 0DTEs decoded, positioning, trends and market impact (May 2, 2025)
- Federal Reserve: FOMC meeting calendars
- Thrive in Markets: FOMC 2026 meeting dates
- MarketXLS: Option Expiration Calendar 2026
- Macroption: Options Expiration Calendar 2026
This article is for educational and informational purposes only. It is not financial, investment, medical or legal advice, and it is not a recommendation to buy or sell any security. Figures come from the sources listed and were checked on the date of publication; markets change quickly. Options trading involves substantial risk of loss.