Position Sizing for Options Traders: Risk Rules That Last
Options position sizing explained: how much to risk per trade, how to size spreads and naked options by max loss, why margin is not risk, and Kelly limits.
Options position sizing is the decision of how many contracts to trade so that a single loss, or a string of them, cannot do serious damage to your account. The practical rule most experienced traders land on is to decide the dollar amount you are willing to lose on a trade first (commonly 0.5% to 2% of the account), find the trade’s maximum or realistic stress loss per contract, and divide. The number of contracts falls out of the math, not out of how confident you feel.
That sounds dull, and it is the part of trading that decides who is still around in five years. Options make sizing harder than stocks because the same dollar amount can carry wildly different risk. A $420 call can lose $420. A short put that collects $200 can lose thousands. Leverage, time decay and gaps all hit at once, and a position that looks small on the order ticket can be the biggest risk in the account.
This guide covers the rules I use and the math behind them: risk per trade, how to size defined and undefined risk, why margin is not risk, how much total risk to have open at once, and what the Kelly criterion does and does not tell you.
- Size every options trade from dollars at risk, not from contracts or premium. Contracts = risk budget divided by max loss per contract.
- A common risk budget is 0.5% to 2% of the account per trade. The math of losing streaks shows why higher numbers break accounts.
- Margin is not risk. An uncovered put can carry a margin requirement far below its true loss potential.
- Cap total open risk (“portfolio heat”) and treat correlated positions as one bet.
- The Kelly criterion sets a ceiling, not a target. Most traders who use it bet a fraction of it.
Why options position sizing matters more than entries
Losses compound against you in a way gains do not. Lose 50% and you need a 100% gain to get back to even. Lose 75% and you need 300%. That is pure arithmetic, and it is the single strongest argument for small, consistent position sizes.
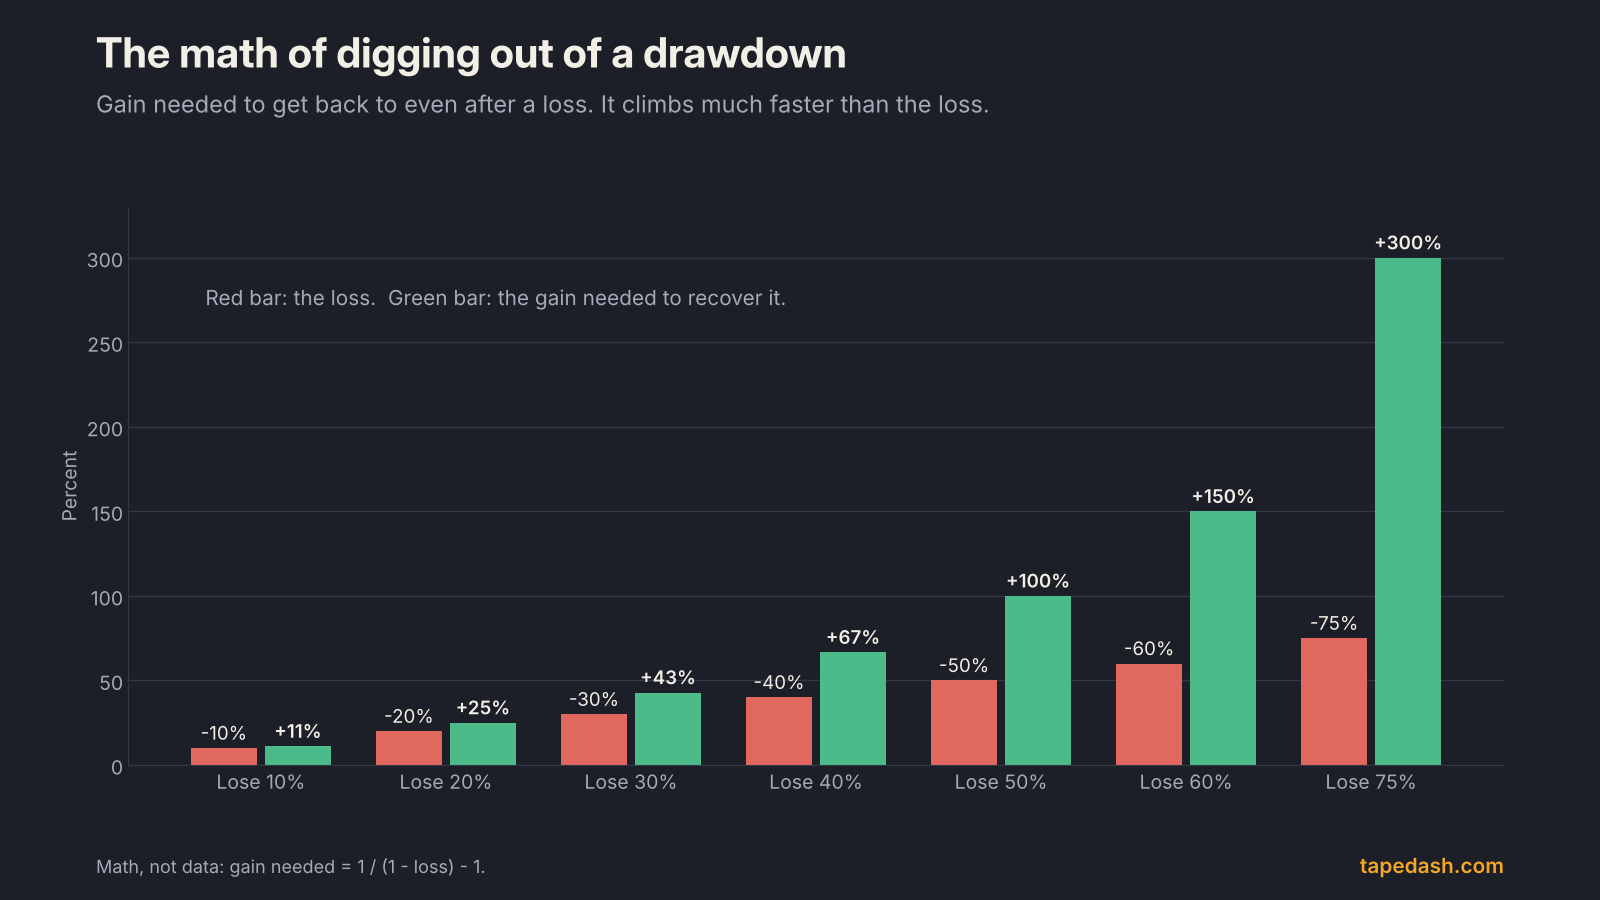
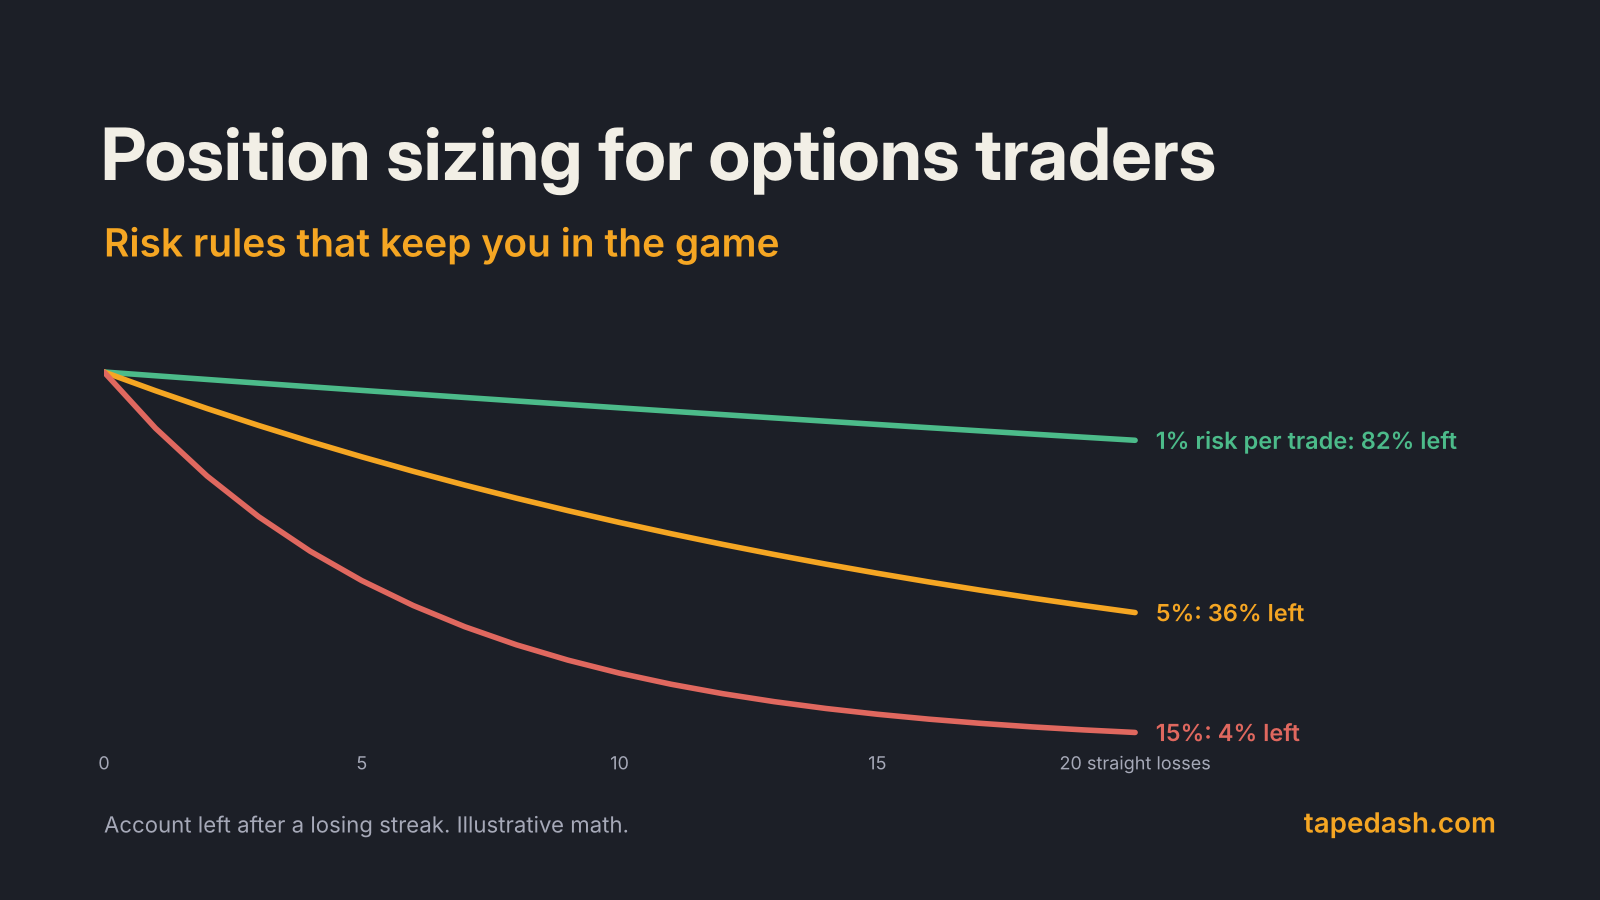
The other half of the argument is that losing streaks are normal. A strategy that wins 55% of the time will, over a few hundred trades, probably hit a run of six losses in a row at some point, and longer streaks are entirely possible. You cannot avoid the streak. You can only decide how much each loss costs while you are in it.
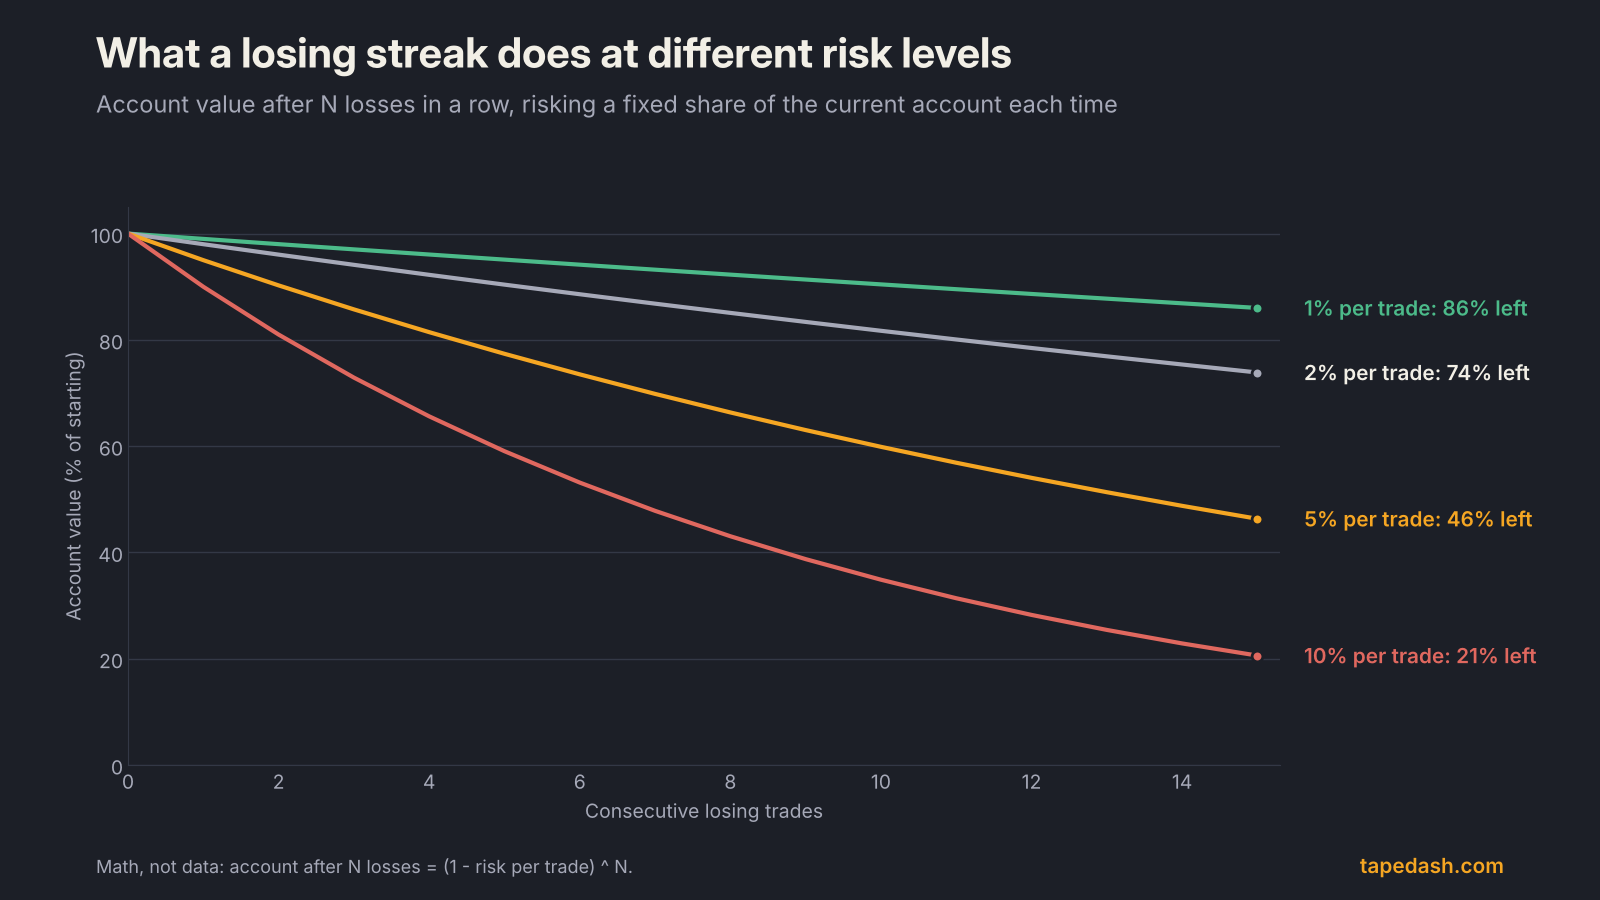
At 1% per trade, fifteen straight losses cost about 14% of the account. Painful, recoverable. At 10% per trade, the same streak leaves you with about a fifth of what you started with, and you would need a gain of nearly 390% to recover. Nothing about the strategy changed. Only the size did.
Step one: define risk per trade in dollars
Start with a single number: the most you are willing to lose on one idea if it goes completely wrong. Express it as a percentage of the account, then convert it to dollars.
There is no official number. In practice, 0.5% to 2% covers most disciplined traders, with 1% a sensible default while you are building a record. Smaller accounts sometimes stretch to 2% or 3% because options come in 100-share lots and a 1% budget may not buy a single contract on a higher-priced stock. That is a real constraint, and the honest answer is to trade cheaper underlyings or narrower spreads rather than to raise the risk budget.
I use fixed fractional sizing, meaning the percentage stays fixed and the dollar amount moves with the account. After a drawdown, the same 1% is fewer dollars, so you automatically trade smaller while you are cold. After a run of wins, you size up gradually. It is the simplest form of risk control that adjusts itself.
How to size options trades by max loss
Once you have a dollar budget, the formula is the same for every structure:
Contracts = risk budget ÷ maximum loss per contract, rounded down.
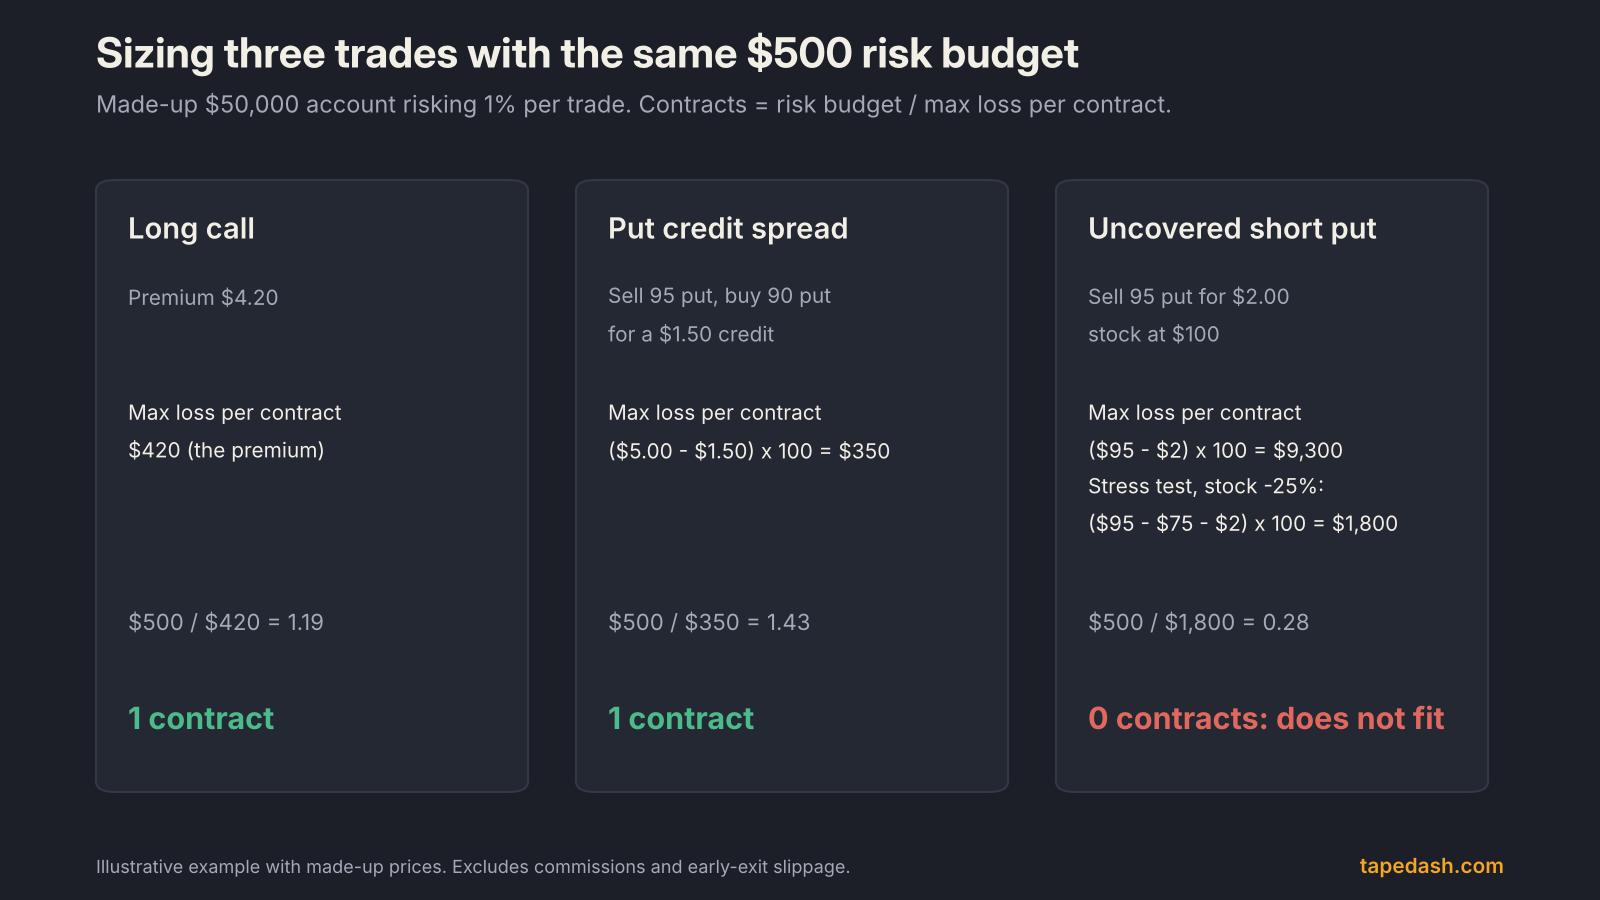
What changes is how you define “maximum loss,” and that depends on whether the trade has defined or undefined risk. Here is an illustrative example with a made-up $50,000 account risking 1%, or $500, per trade.
Long options (defined risk)
For a long call or put, the max loss is the premium paid. A $4.20 call costs $420 per contract, so a $500 budget buys one. Long options with nine months or less to expiration must be paid for in full, with no margin credit, per Cboe’s margin rules and the Series 9 margin guide, so the cash you pay is the cash at risk.
The trap with long options is treating the whole premium as risk on paper but sizing up because “it’s only $420.” If you buy five of them, your risk is $2,100, or 4.2% of the account. The rule applies to the total, not the ticket price.
Spreads (defined risk)
For a vertical credit spread, max loss is the width of the strikes minus the credit, times 100. Selling the 95 put and buying the 90 put for a $1.50 credit risks $3.50 per share, or $350 per contract. The margin requirement for a credit spread is the same figure, strike difference minus credit received, per the Series 9 guide and Cboe. A $500 budget fits one contract; two would risk $700.
For a debit spread, max loss is the debit paid. Spreads are the easiest structures to size precisely, which is a big reason I lean on them when volatility is high or the event risk is unclear.
Uncovered options (undefined risk)
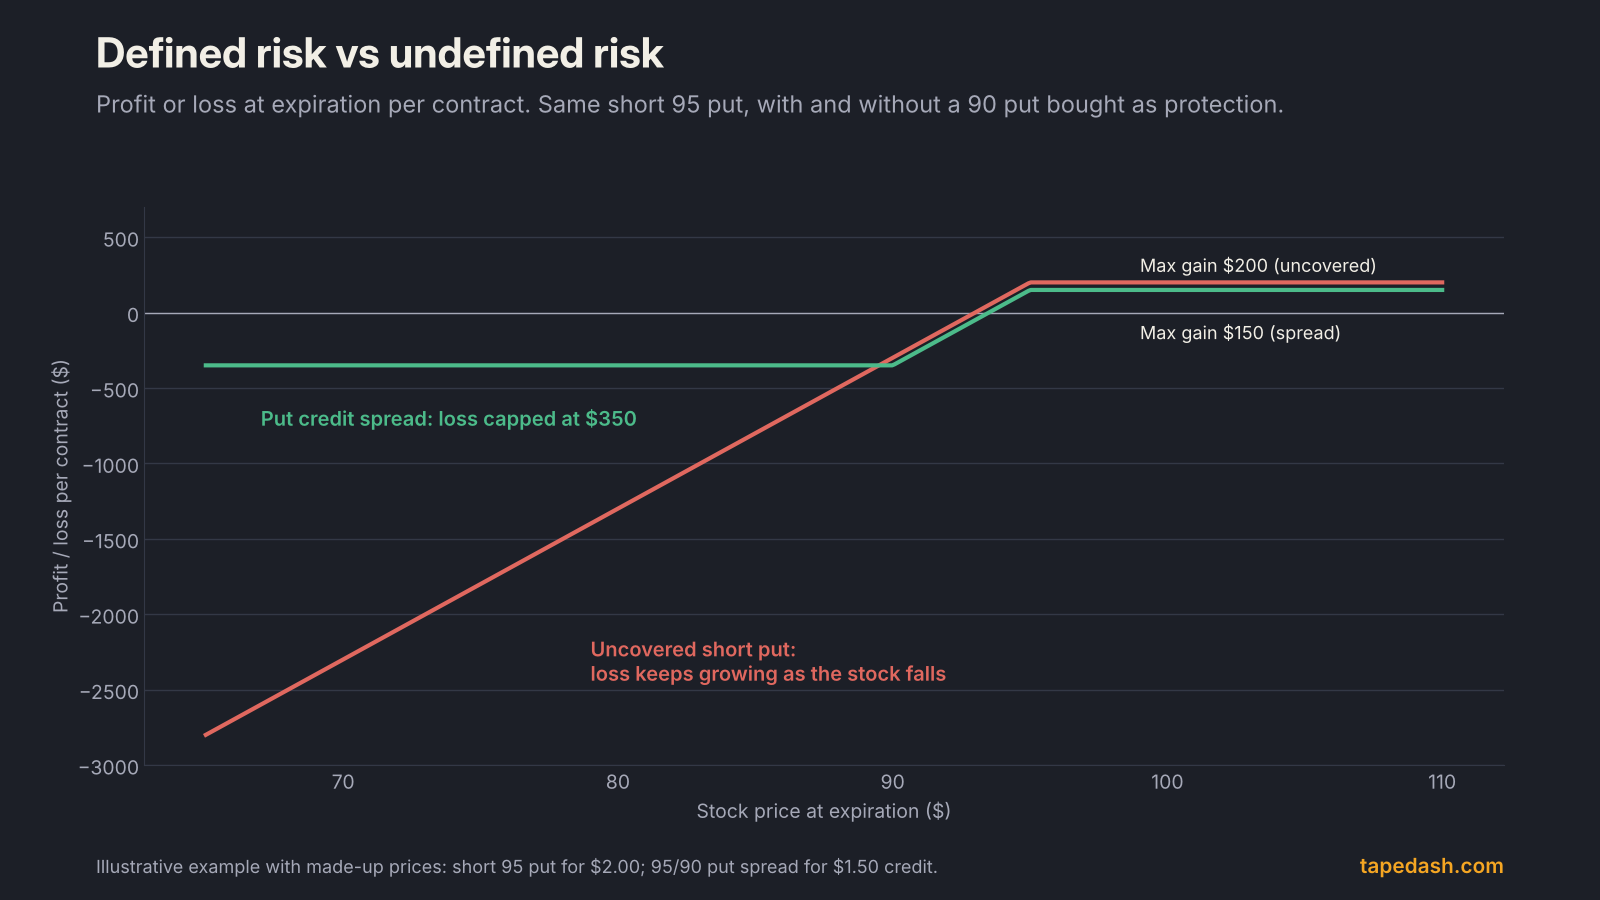
This is where accounts get hurt. An uncovered short put’s theoretical max loss is the strike minus the premium, times 100, which on a 95 strike sold for $2.00 is $9,300 per contract. An uncovered short call’s potential loss is unlimited. Both the Nasdaq and TradeStation risk statements for uncovered writers say plainly that “The potential loss of uncovered call writing is unlimited,” and both warn that brokers can demand more margin or liquidate positions with little or no notice when a trade moves against you.
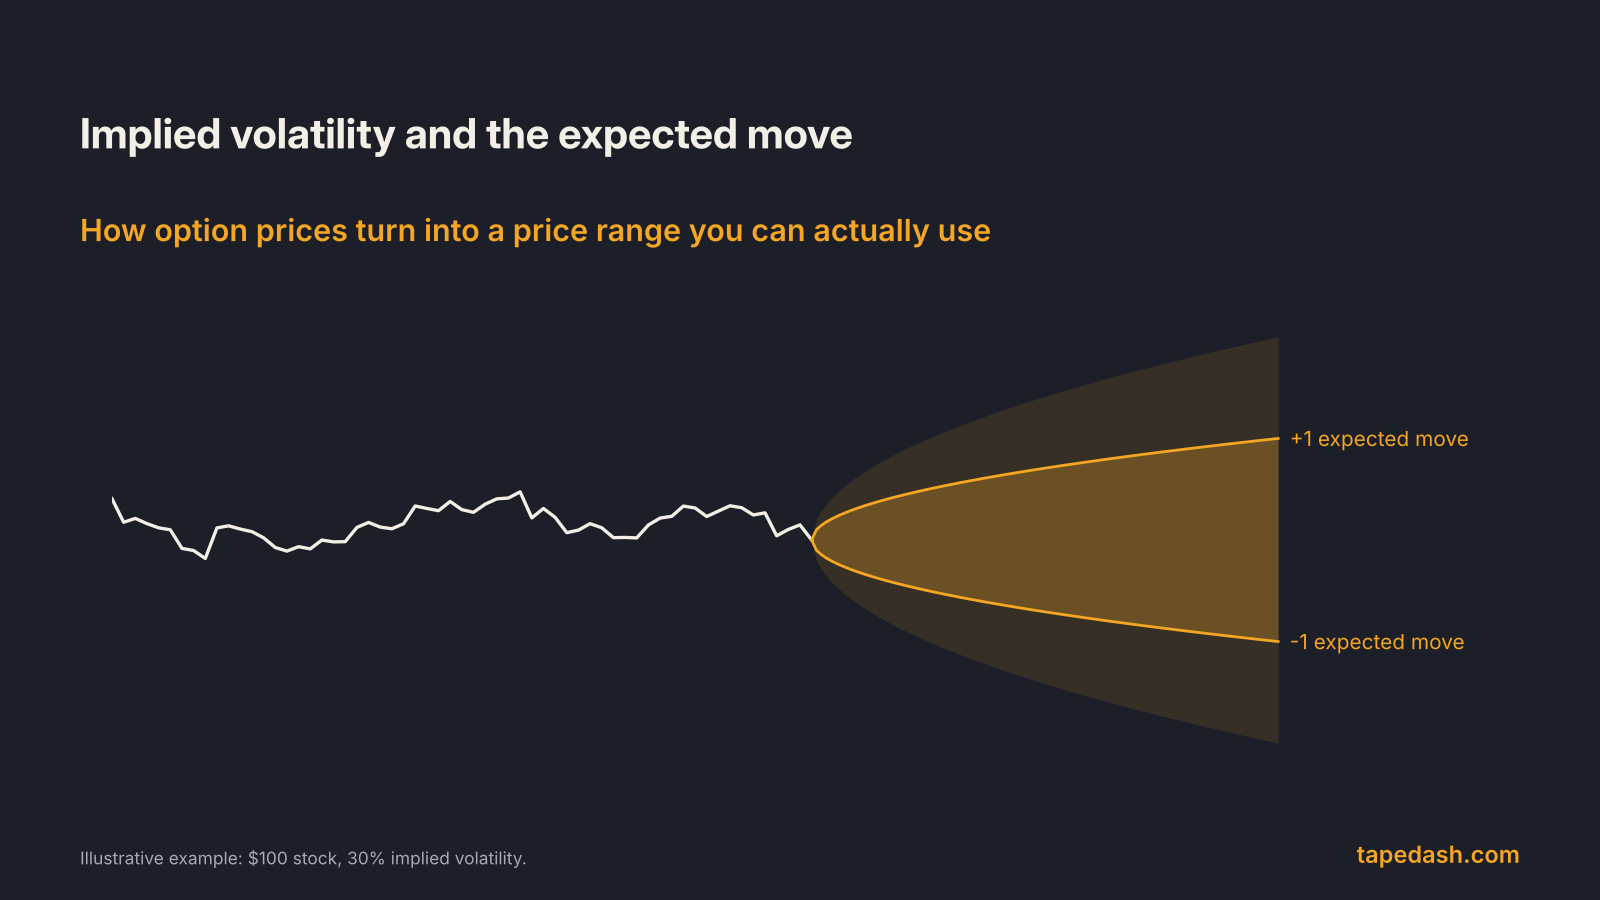
Sizing undefined risk to the theoretical maximum is so conservative that most traders skip it, and then they size to nothing at all. The middle path is a stress test: pick a move the stock could realistically make, often a multiple of its options-implied move or its worst historical gap, and size so that the loss in that scenario fits your budget. In the example, a 25% drop costs $1,800 per contract, so a $500 budget does not support even one. That is the correct answer, and the reason defined-risk structures exist. Our guide to implied volatility and the expected move covers how to read the move options are pricing, which is a good starting point for the stress scenario.
Margin is not risk
The most common sizing mistake I see with short options is using the margin requirement as the measure of risk.
Under the standard strategy-based rules, an uncovered equity put requires the option proceeds plus 20% of the underlying value, less any out-of-the-money amount, with a floor of proceeds plus 10% of the strike, per Cboe and the Series 9 guide. Run that on the illustrative 95 put with the stock at $100 and the requirement comes to about $1,700 per contract. The theoretical loss is $9,300.
So an account that “only uses 30% of buying power” can be carrying several times its comfort level in real downside. Margin requirements are set to protect the broker from default over a normal day’s move. They are not designed to describe your worst week. Brokers can, and often do, set requirements above these minimums, which Cboe notes on the same page, but even the higher numbers are not a risk budget.
Portfolio heat: total risk across all open trades
Per-trade risk is half the system. The other half is how much risk you have open at once, sometimes called portfolio heat. If you risk 1% per trade and hold 15 positions, you have 15% of the account on the line, and in a broad selloff many of those can lose together.
Two rules keep heat under control.
Cap total open risk. A ceiling of 5% to 10% of the account across all open trades is a reasonable starting point for an active options trader. When you hit it, the next trade waits until something closes.
Treat correlated positions as one trade. Five bullish call spreads on five semiconductor stocks are not five ideas. They are one bet on semiconductors expressed five ways. Add up their risk and hold it to the same limit as a single position, or close to it. The same goes for bullish positions across the index and its largest components.
Event risk deserves its own line. Positions held through earnings, a Fed decision or a major data release can gap past any stop, so I size those to the gap scenario rather than the stop. Same-day options add another layer; we cover how quickly gamma changes intraday in 0DTE Options Explained.
Position sizing methods compared
| Method | How it works | Strength | Weakness |
|---|---|---|---|
| Fixed contracts | Same number of contracts every trade | Simple | Ignores price and risk; a 5-wide spread and a 20-wide spread get the same size |
| Fixed dollar risk | Same dollar loss per trade | Easy to apply, consistent | Does not shrink in a drawdown unless you reset it |
| Fixed fractional (percent of account) | Same percentage of current equity per trade | Shrinks automatically when you are losing | Slow to rebuild after a deep drawdown |
| Volatility-adjusted | Smaller size when implied or realized volatility is high | Matches size to how far the stock can move | Needs a volatility input and a rule to apply it |
| Fractional Kelly | A fraction of the Kelly-optimal bet based on estimated edge | Grounded in growth math | Only as good as your edge estimate, which is usually too optimistic |
The Kelly criterion: a ceiling, not a target
The Kelly criterion comes from a 1956 paper by John Kelly, a researcher at Bell Labs, as both Wikipedia and Albion Research recount. It answers one question: given a known edge, what fraction of your bankroll should you bet to maximize long-run growth? For a simple bet that pays b-to-1 with win probability p, the answer is f = p minus (1 − p) ÷ b.
In an illustrative example with a 55% win rate and even payoff, full Kelly says to risk 10% of the account per trade. Half Kelly, 5%, captures about three-quarters of the long-run growth with far smaller swings. Push past roughly twice Kelly and expected growth turns negative, even with a genuine edge.
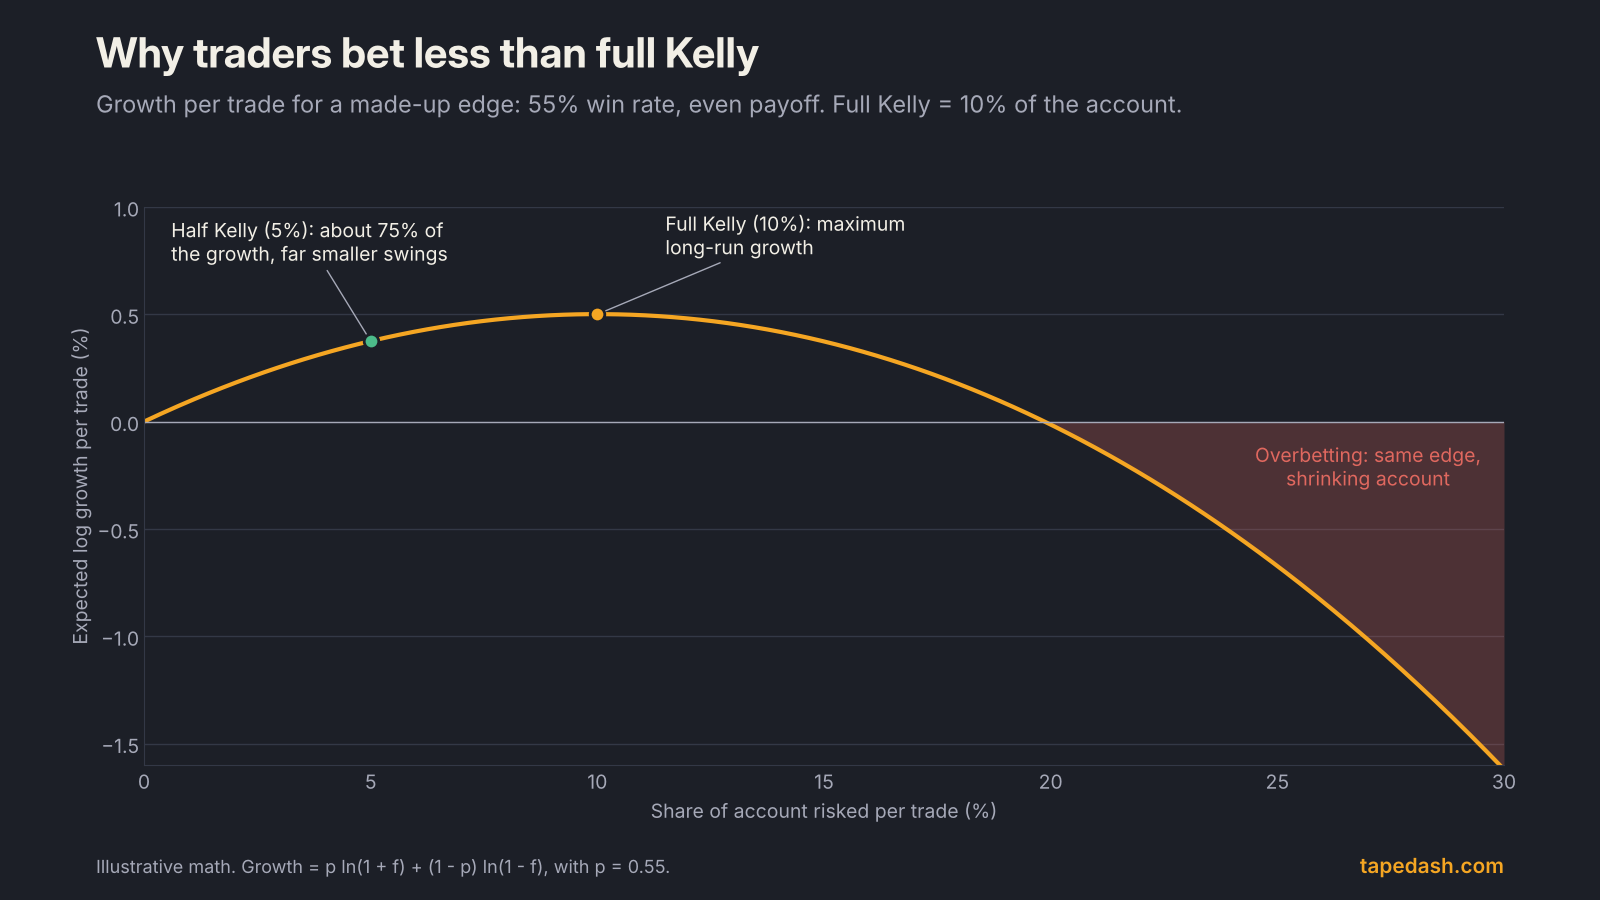
Three reasons traders bet well below Kelly. First, the formula assumes you know your true edge, and almost everyone overestimates theirs. Albion’s notes stress that an inflated win-probability estimate leads straight to overbetting. Second, the drawdowns at full Kelly are brutal; Wikipedia notes that in practice many find fractional Kelly “much better emotionally than full Kelly.” Third, options trades do not have the clean, fixed payoff the simple formula assumes. Use Kelly to sanity-check that your risk per trade is not absurd. Do not use it to justify a bigger one.
How to use it: a sizing routine you can follow
Here is the process, step by step, for any options trade.
- Set the budget. Write down your risk per trade as a percentage (start at 1%) and the dollar figure for today’s account value.
- Find the max loss per contract. Premium for long options, width minus credit for credit spreads, debit for debit spreads, a stress scenario for anything uncovered.
- Divide and round down. If the result is less than one, the trade does not fit. Pick a smaller structure or pass.
- Check portfolio heat. Add the new risk to everything already open. If the total breaks your cap, or the new trade is correlated with existing positions, size down.
- Adjust for events and volatility. If an earnings report, Fed decision or major data release lands before expiration, size to the gap. If implied volatility is unusually high, consider cutting size or switching to a spread.
- Log it. Record the planned risk, the actual fill and the result. After 50 trades, compare your real average loss to your planned risk. If losses keep running past the plan, the problem is execution, not the sizing formula.
When to cut size this week
The calendar right now argues for smaller positions in anything rate-sensitive. The Fed announces its decision on October 28 at 2:00 PM ET, followed by GDP and PCE inflation data on the morning of October 29, as covered in our Fed decision preview. Positions held through those releases should be sized to a gap, not to a stop.
How TapeDash helps you size options trades
If you want to see this math before you place the order, this is what the tools are built for. The Options Risk Desk shows max loss, breakevens and portfolio-level exposure across your open positions, so heat is a number on a screen instead of a guess. The Contract Picker compares structures for the same idea, so you can see how a spread changes the risk per contract compared with a naked option. The Trade Journal tracks planned risk against actual losses, which is the single best check on whether your sizing rules survive contact with the market.
You can explore the Terminal Preview free with no account. If you want the full Pro toolset, the first 200 members lock Pro at $99 a month for as long as they stay; the waitlist has the details and the free TapeDash Daily.
Options position sizing FAQ
How much of my account should I risk per options trade?
Most disciplined traders risk 0.5% to 2% of the account per trade, with 1% a sensible starting point. The exact number matters less than applying it to every trade and capping total open risk.
How do I size a naked short put?
Do not size it to the margin requirement. Size it to a stress scenario, such as a move several times the options-implied move or the stock’s worst historical gap, so that the loss in that case fits your risk budget. If it does not fit, use a put credit spread instead.
Is the Kelly criterion useful for options traders?
As a ceiling, yes. It shows that betting too large destroys growth even with an edge. Because real edges are uncertain and options payoffs are not fixed, most traders who use it bet a fraction of the Kelly amount.
The one idea to keep: decide the loss before you decide the size. If you size every trade from dollars at risk, cap what you have open at once, and refuse trades that do not fit, a losing streak becomes a bad month instead of the end of the account.
See it on the tape, not just in the headlines
TapeDash is the research desk for traders and investors: live options flow, dealer positioning, a real-time market scanner and trade alerts graded in public. Memberships open January 1, 2027, and the first 200 members lock Pro at $99 a month for as long as they stay.
Join the waitlistClick through the terminalSee the track recordSources
- Cboe: Strategy-based margin requirements for options
- Open Exam Prep: Series 9 options margin requirements
- FINRA: Margin regulation
- Nasdaq: Special statement for uncovered option writers
- TradeStation: Special statement for uncovered options writers
- Wikipedia: Kelly criterion
- Albion Research: The Kelly criterion calculator and notes
This article is for educational and informational purposes only. It is not financial, investment, medical or legal advice, and it is not a recommendation to buy or sell any security. Figures come from the sources listed and were checked on the date of publication; markets change quickly. Options trading involves substantial risk of loss.