Implied Volatility and the Expected Move, Explained
Implied volatility tells you how far the options market expects a stock to move. Here is how to turn IV into an expected move, and where the math breaks.
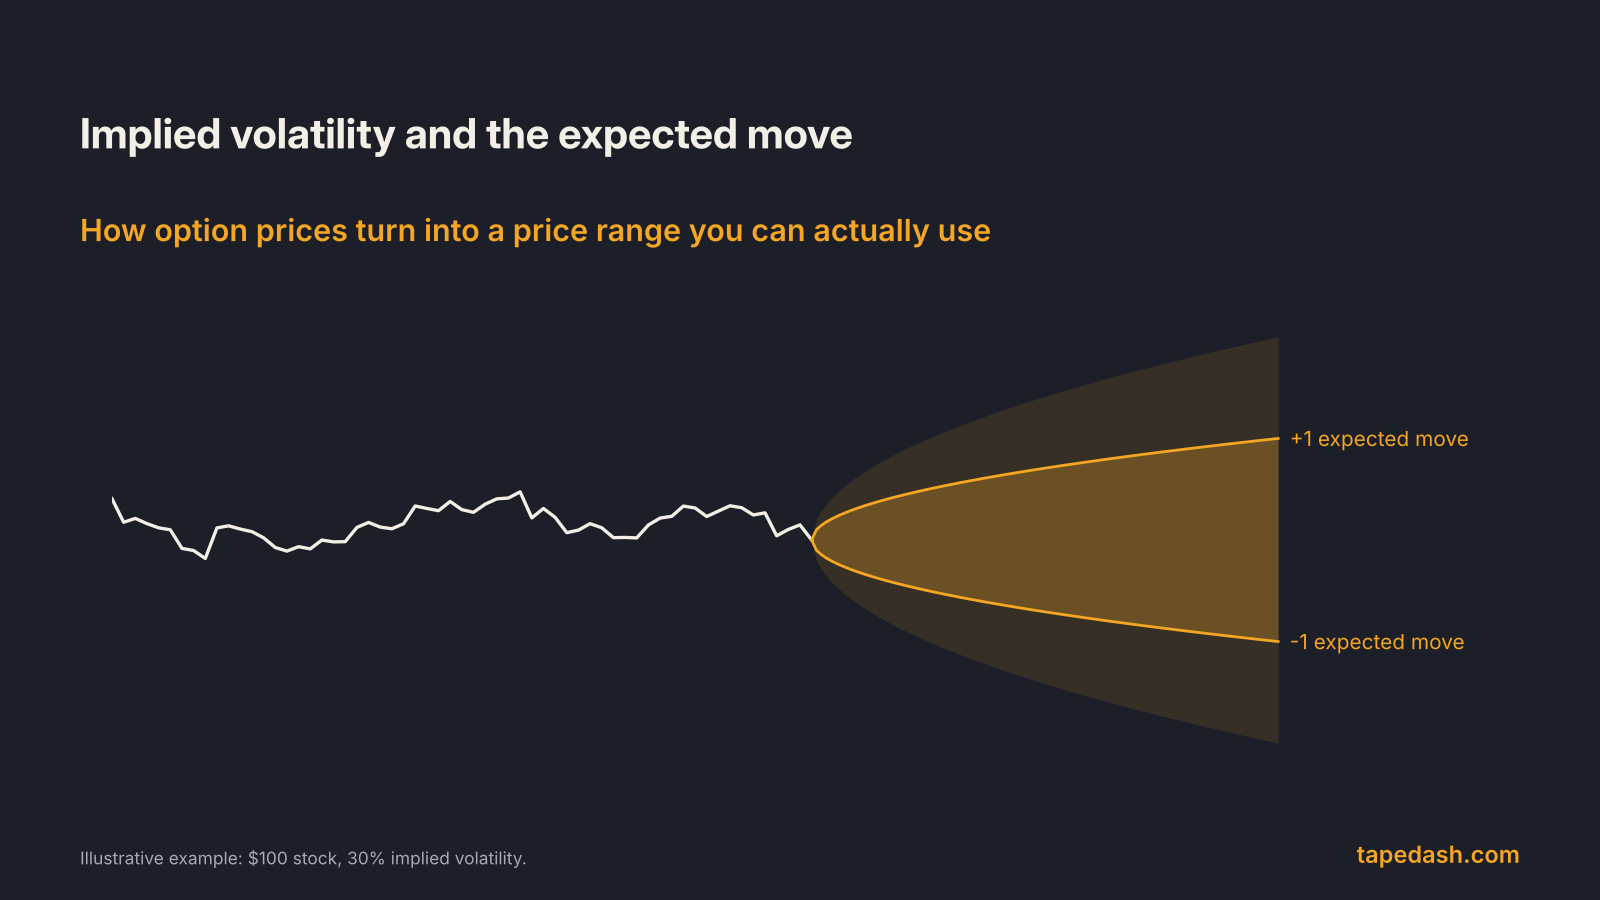
Implied volatility is the options market’s estimate of how much a stock will move, expressed as an annual percentage. The expected move is that same estimate translated into dollars for a specific expiration. If a $100 stock carries 30% implied volatility, the options market is pricing a move of about $8.60 in either direction over the next 30 days, at one standard deviation.
That single translation, from a percentage you see on an option chain to a price range you can put on a chart, is one of the most useful habits an options trader can build. It tells you whether a strike is close or far, whether an earnings reaction was “big” by the market’s own standard, and whether a trade needs more movement than the market thinks is likely.
This guide explains where implied volatility comes from, the formula for the expected move, the shortcuts traders use (the straddle and the “rule of 16”), and the places where the math quietly breaks.
- Implied volatility (IV) is the volatility number that makes an option pricing model match the option’s market price. It is forward-looking and annualized.
- Expected move = stock price x IV x the square root of (days to expiration / 365). That gives a one-standard-deviation range.
- Under a normal distribution, about 68% of outcomes fall inside one expected move and about 95% inside two. Real markets have fatter tails than that.
- An at-the-money straddle costs roughly 0.8 times the one-standard-deviation move, which is why traders use it as a quick read on the expected move.
- Divide the VIX by about 16 for a rough one-day expected move in the S&P 500.
What is implied volatility?
Every option price depends on a handful of inputs: the stock price, the strike, time to expiration, interest rates, dividends and volatility. Five of those you can look up. The sixth, how much the stock will move between now and expiration, nobody knows.
So the market works backward. Take the option’s actual price, plug every known input into a pricing model such as Black-Scholes, and solve for the volatility number that makes the model produce that price. That number is implied volatility. Option Alpha and The Motley Fool describe the same process: IV is not observed directly; it is backed out of what traders are willing to pay.
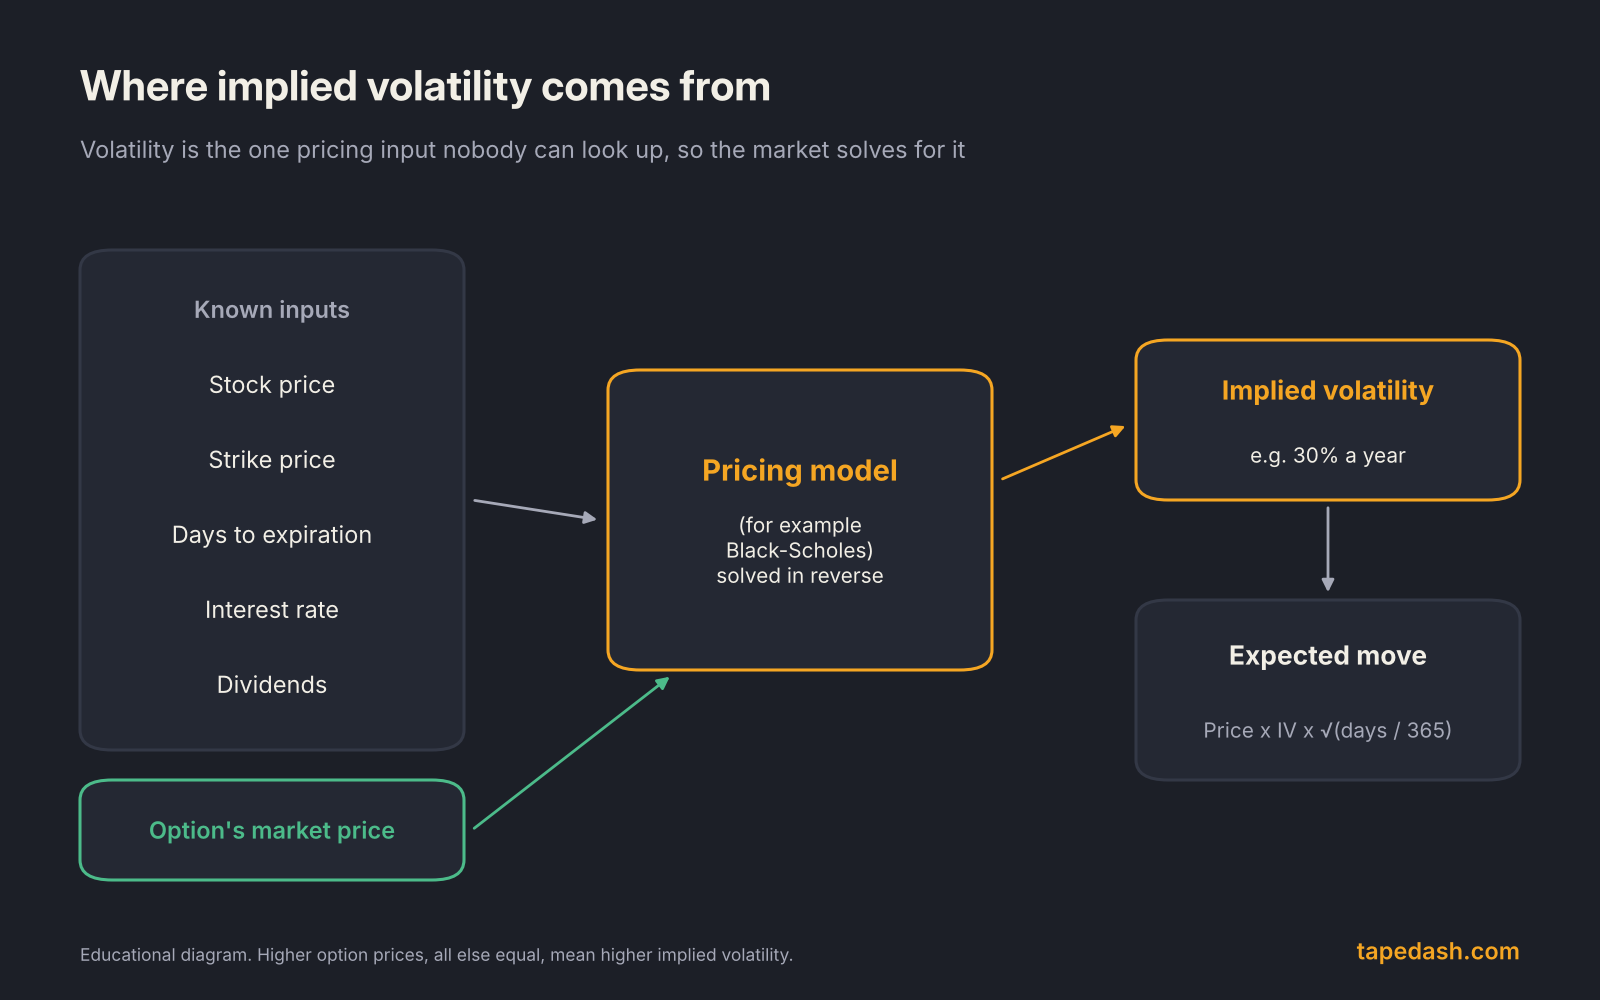
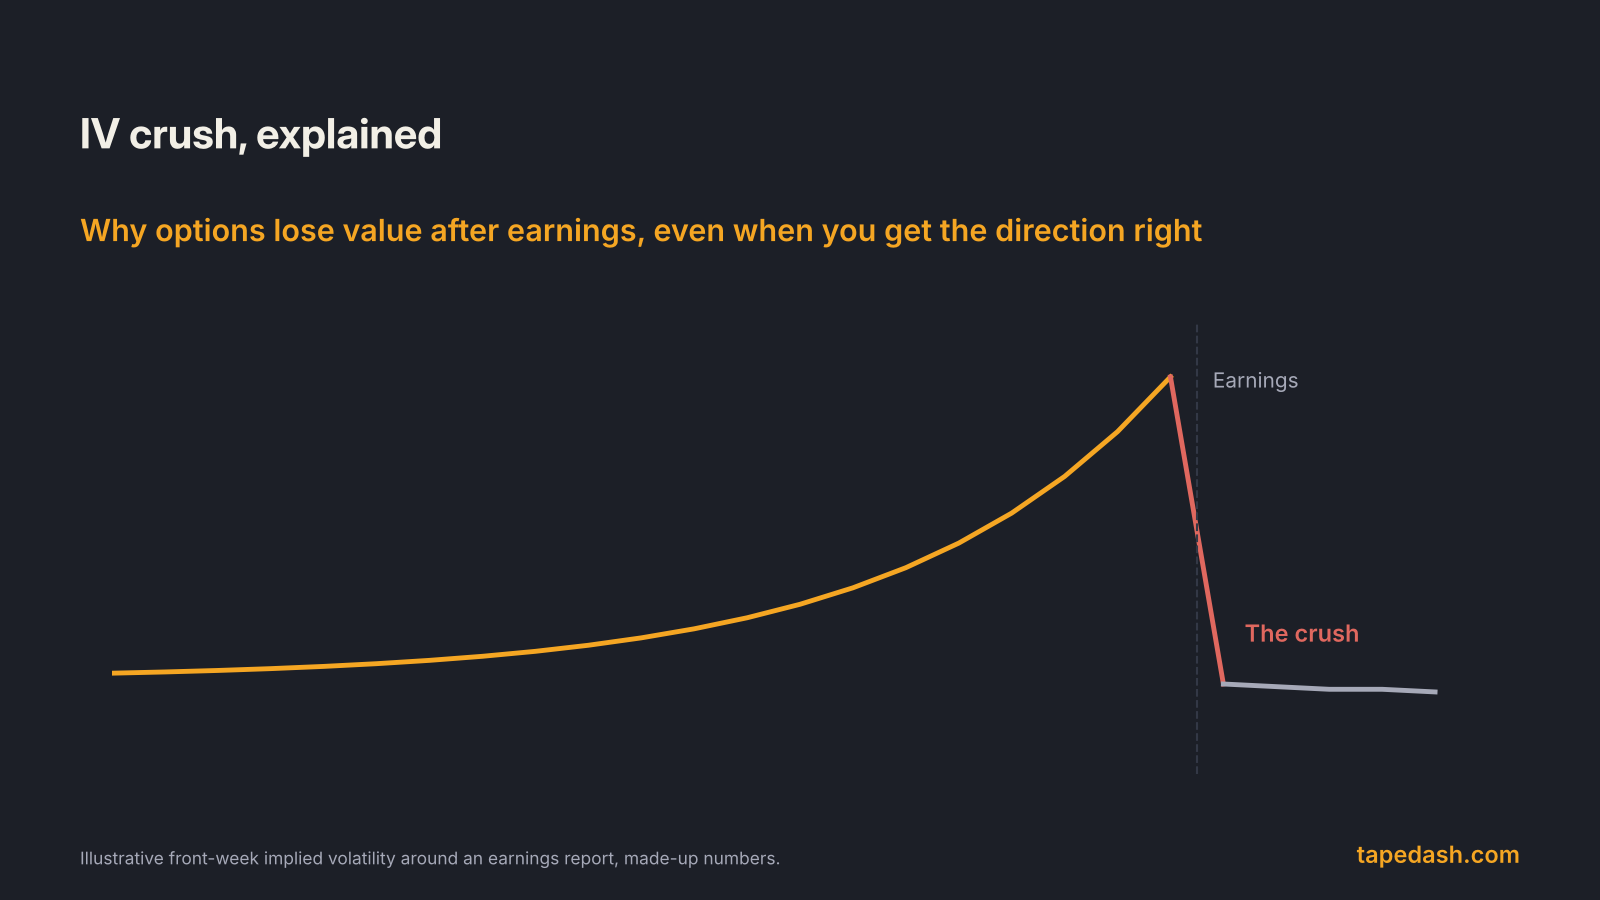
That framing explains a lot of IV behavior. When traders bid up options ahead of earnings or a Fed decision, IV rises, because a higher volatility input is the only way the model can justify the higher price. When the event passes and demand fades, IV falls. Implied volatility is a price, quoted in volatility units.
Two more details. IV is annualized, so a 30% IV means the market is pricing a one-standard-deviation move of about 30% over a full year, scaled down for shorter periods. And every option has its own IV. Different strikes and different expirations on the same stock carry different implied volatilities, which is why a platform’s single “IV” figure is usually an average or the at-the-money value.
Implied volatility vs historical volatility
Historical (or realized) volatility measures how much the stock actually moved over a past window. Implied volatility is the market’s forward-looking price for future movement. The gap between them is informative. When IV runs well above recent realized volatility, options are pricing in something the stock has not been doing lately, often a known event. When IV sits below realized volatility, options are cheap relative to how the stock has been behaving.
How to calculate the expected move from implied volatility
The standard formula, as laid out by Saxo and used in the Montreal Exchange’s worked examples, is:
Expected move = Stock price x Implied volatility x the square root of (Calendar days to expiration / 365)
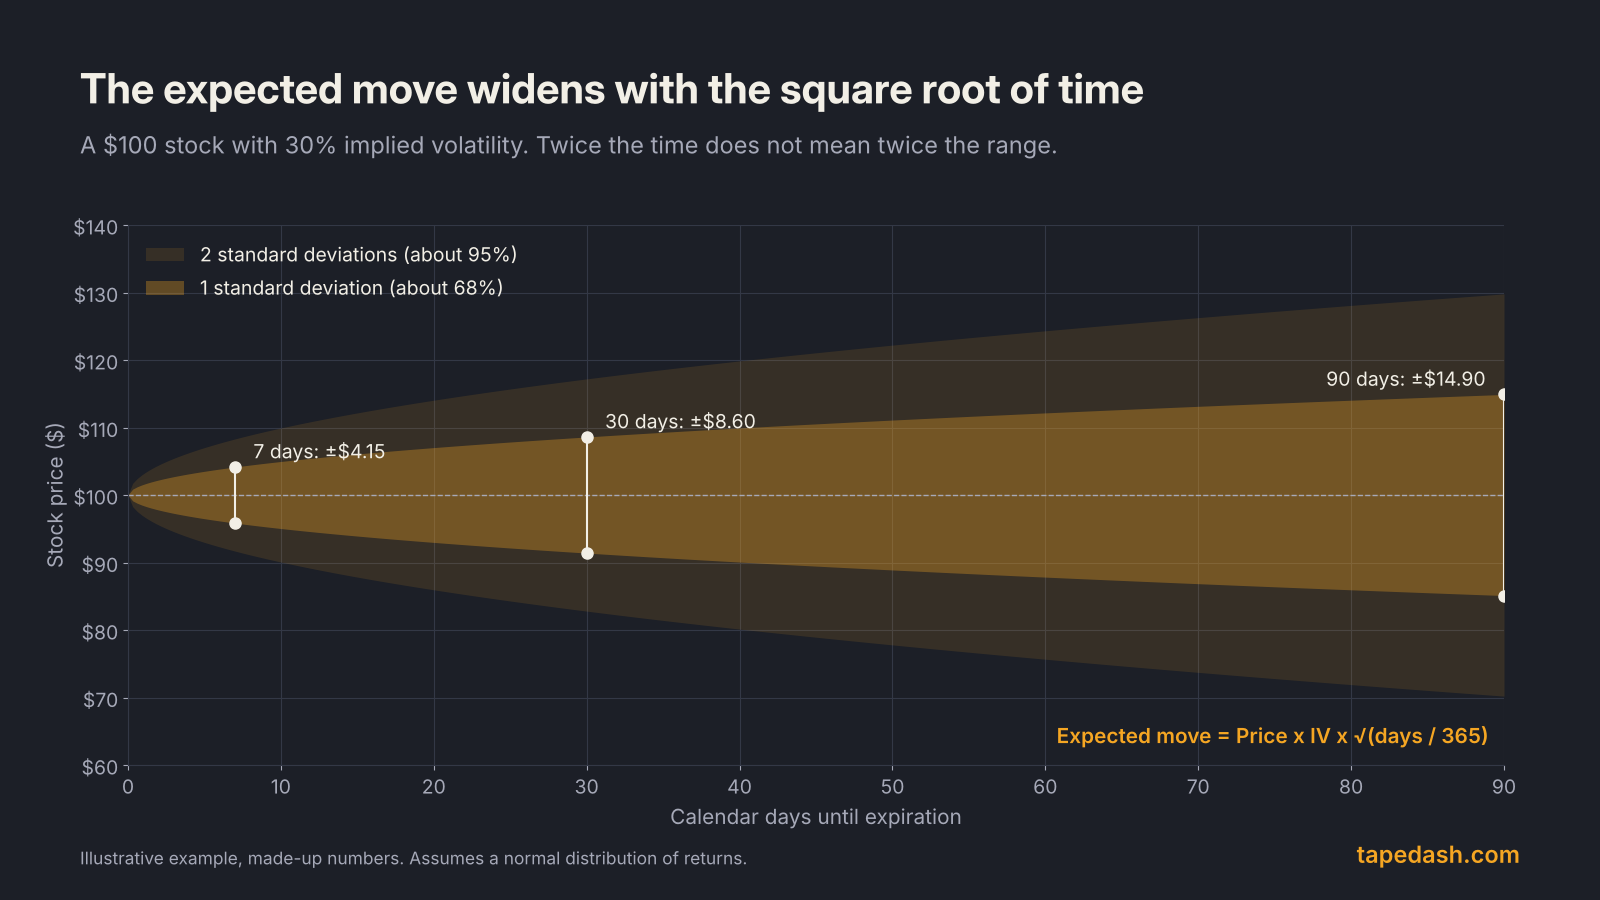
Here is an illustrative example with made-up numbers. A stock trades at $100 and its 30-day options carry 30% implied volatility.
- Square root of 30 / 365 is about 0.287.
- $100 x 0.30 x 0.287 = about $8.60.
The one-standard-deviation expected move is plus or minus $8.60, a range of roughly $91.40 to $108.60 by expiration.
The square root is the part people miss. Volatility does not scale with time in a straight line; it scales with the square root of time. Quadruple the time and the expected range only doubles. That is why a 90-day option on the same stock implies a range of about $14.90, not three times $8.60.
What one standard deviation actually means
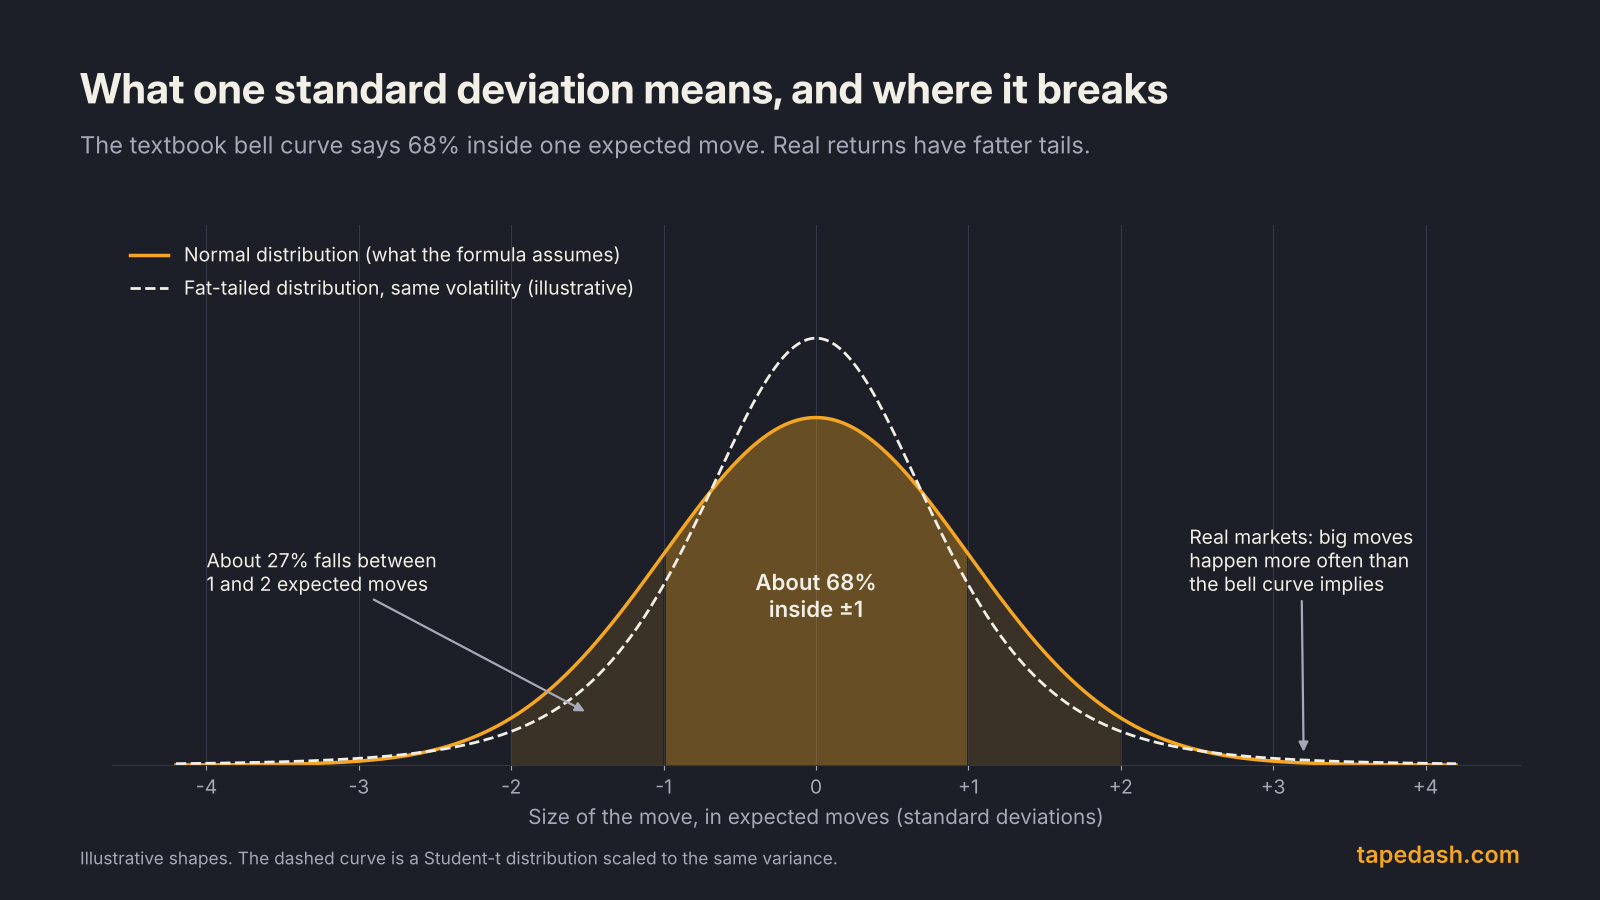
The expected move is a one-standard-deviation range. Under a normal distribution, about 68% of outcomes land inside one standard deviation and about 95% inside two. tastylive frames the expected move exactly this way: the lower end is minus one standard deviation, the upper end is plus one.
Read that carefully. A 68% range means that roughly one time in three, the stock is expected to finish outside it. A move beyond the expected move is not a shock. It is built into the price.
Where the math breaks
The formula assumes returns follow a normal distribution. Stock returns do not. They have fat tails, meaning large moves happen more often than the bell curve predicts, and they tend to cluster: volatile days follow volatile days. The 68% and 95% figures are a model’s output, not a guarantee, and Saxo’s guide cautions that actual moves can be far off, especially in volatile markets.
Three practical consequences follow. First, IV is not the same at every strike. Out-of-the-money puts on stock indexes usually carry higher IV than at-the-money options, because traders pay up for crash protection. Second, IV changes constantly, so today’s expected move is a snapshot. Third, a scheduled event inside the expiration, such as earnings, concentrates a big chunk of the expected move into a single day, which the plain formula does not show. We cover that in detail in IV crush and earnings options.
The straddle shortcut: reading the expected move off the chain
You do not always need the formula. The price of an at-the-money straddle (one at-the-money call plus one at-the-money put, same expiration) is itself a measure of the expected move. Saxo describes it as a quick, less precise estimate.
There is a clean bit of math behind the shortcut. For a normal distribution, the average absolute move is about 0.8 times one standard deviation. An at-the-money straddle pays off the absolute move, so it costs roughly 0.8 times the one-standard-deviation expected move. In our illustrative example, a 30-day straddle on the $100 stock at 30% IV would cost about $6.85 (0.8 x $8.60).
That gives you two ways to read it:
- The straddle price is the market’s estimate of the average move. If the straddle costs $6.85, the stock needs to move more than $6.85 by expiration for the straddle buyer to profit.
- Straddle divided by 0.8 is roughly the one-standard-deviation move. Some platforms quote the straddle itself as the expected move, others scale it. Know which one you are looking at.
This is the method most traders use around earnings, because the straddle in the first expiration after the report captures the event directly.
| Method | How to calculate | Best for | Watch out for |
|---|---|---|---|
| IV formula | Price x IV x square root of (days / 365) | Any expiration, scenario planning | Uses one IV for all strikes; assumes a normal distribution |
| At-the-money straddle | ATM call price + ATM put price | Earnings and event weeks, quick reads | Equals about 0.8x one standard deviation; wide bid-ask spreads distort it |
| VIX “rule of 16” | VIX / 16 = one-day S&P 500 move in % | Daily index ranges | Index only; a rule of thumb, not a forecast |
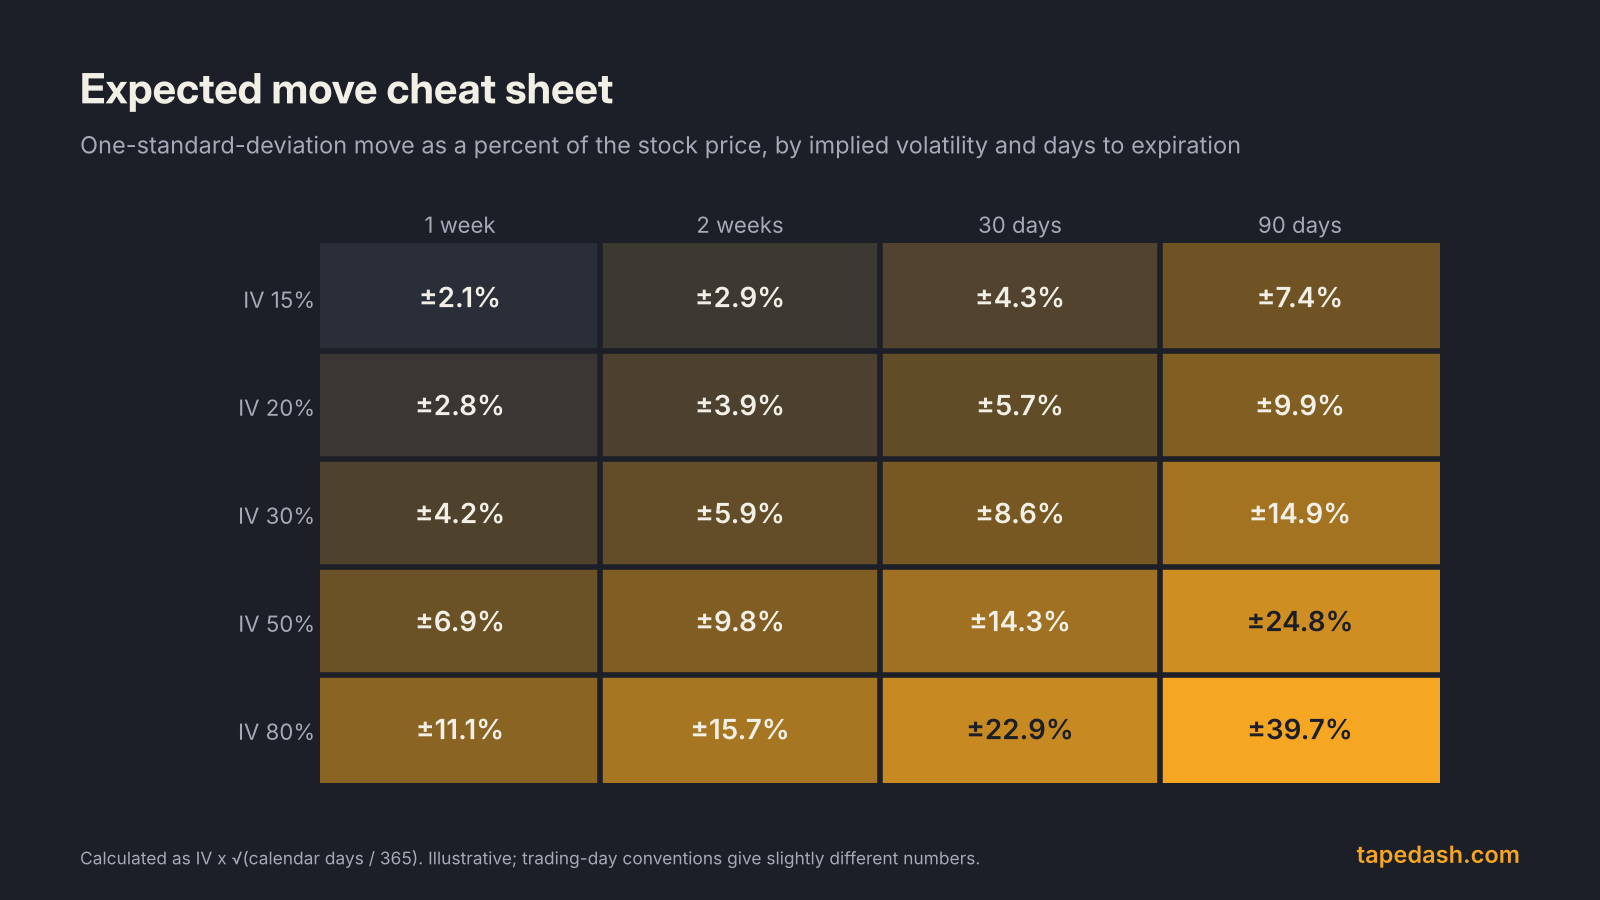
| Expected move cheat sheet | Look up IV and days in a table | Fast sanity checks | Rounding; calendar vs trading-day conventions differ |
The VIX and the expected move for the S&P 500
The Cboe Volatility Index, or VIX, is implied volatility for the whole market. Cboe’s methodology document describes it as a measure of the market’s expectation of 30-day volatility, calculated from S&P 500 option prices. Cboe introduced the original VIX in 1993, a date NerdWallet also gives in its explainer.
Because the VIX is quoted as an annualized percentage, you can turn it into an expected move the same way as any IV. For a one-day move, traders use the “rule of 16.” There are about 252 trading days in a year, and the square root of 252 is close to 16, so dividing the VIX by 16 gives a rough one-day expected move for the S&P 500. Fidelity’s options education material uses the same shortcut, noting that 16% implied volatility works out to about a 1% daily move, and Option Alpha describes the daily figure as roughly one-sixteenth of the annual number.
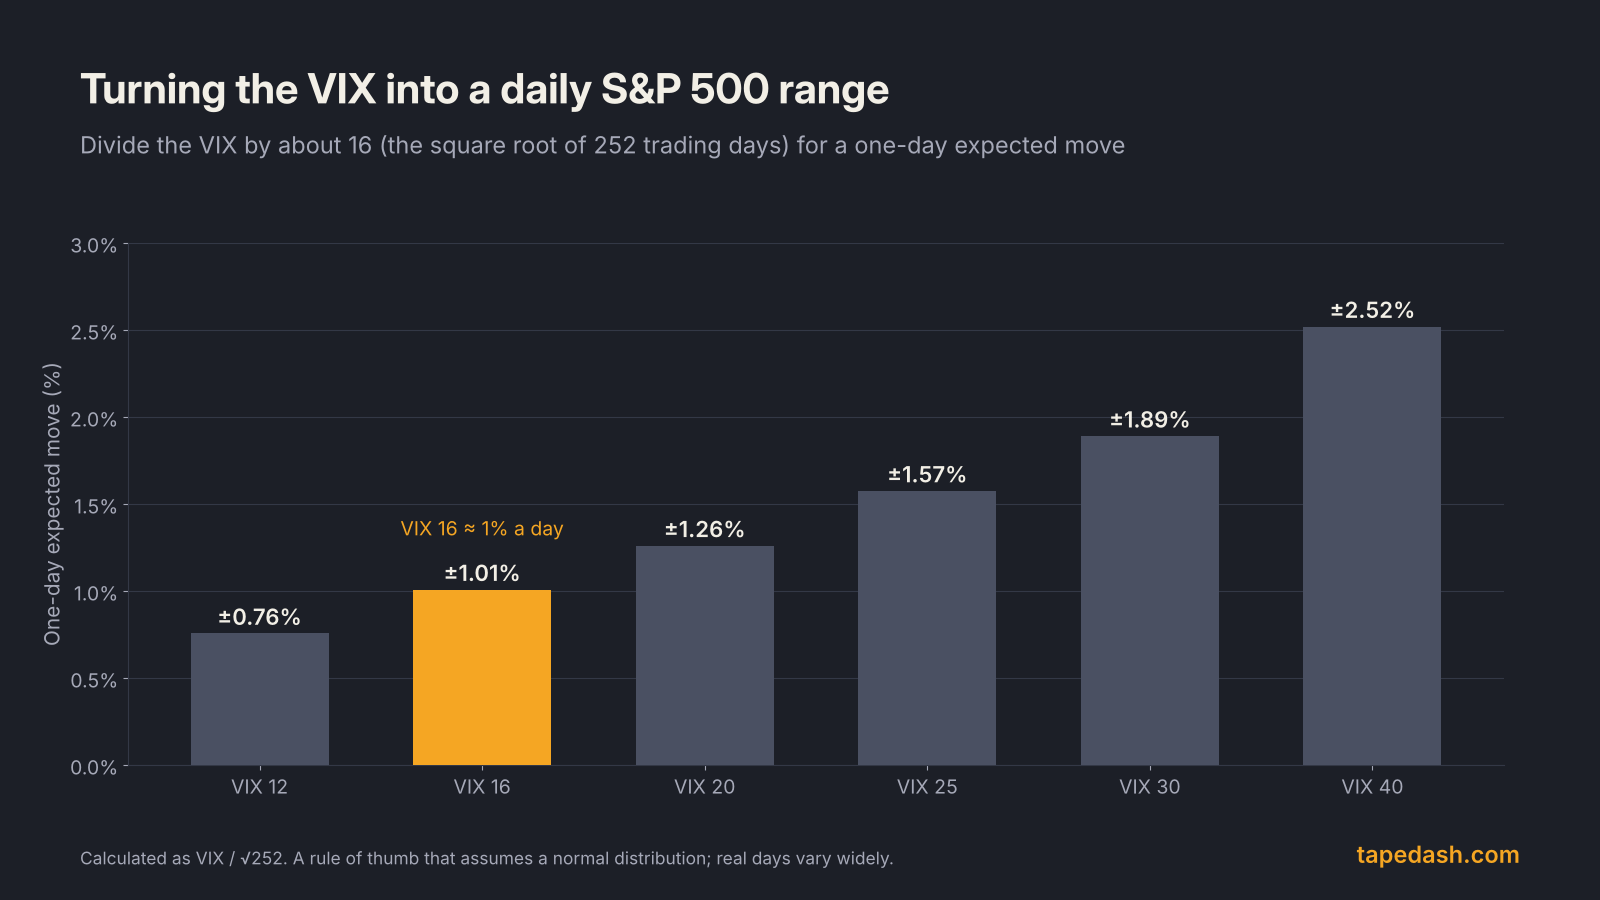
Note the switch in conventions: daily estimates usually use trading days (252), while the expiration formula above uses calendar days (365). Both are fine. Just do not mix them in one calculation.
How to use the expected move in your trading
This is how we put the number to work, step by step.
- Start every options idea by calculating the expected move for the expiration you are considering. It takes ten seconds and frames everything else.
- Place strikes in expected-move units, not dollars. A strike $5 away means something very different on a 15% IV utility and an 80% IV biotech. “Half an expected move away” or “1.5 expected moves away” is a language that travels across stocks.
- Ask what your trade needs. A long call that only pays if the stock moves two expected moves in a week is a low-probability bet, whatever the chart looks like. A short put sold outside one expected move has a cushion the market itself thinks is reasonable, but not a guarantee.
- Compare implied with realized. If a stock has been moving 1% a day and options imply 3%, ask what event the market is paying for. If options imply less than the stock has been moving, ask why.
- Check whether IV is high or low for this stock. The Options Industry Council describes two common gauges: IV Rank, which places today’s IV within its range over the past year on a 0 to 100 scale, and IV Percentile, the share of days in that period when IV was lower. Neither predicts direction; both tell you whether options are expensive by their own history.
- After the move, score it. When a stock “crashes” 4% on a day the options priced a 6% move, the market got less than it expected. That framing, more than the raw percentage, is what drives how options reprice afterward, and it is the core of reading an earnings report like a trader.
How TapeDash tracks implied volatility and expected moves
If you want to watch implied volatility and the expected move without doing the arithmetic by hand, this is what we track. The Volatility Desk in TapeDash is where we check implied volatility before any options idea, so the question of whether options on a stock are cheap or rich comes first, not last. The Earnings page shows the implied move for upcoming reports, read from the options market, which is the number to hold the actual reaction up against once the report is out.
When you are choosing a contract, the Contract Picker grades contracts for a ticker, direction and hold time, and its profit and loss simulator lets you check whether a contract needs more movement than the expected move before you commit. You can explore all three in the Terminal Preview, free with no account, or get the evening read in the free TapeDash Daily.
Implied volatility FAQ
Is high implied volatility good or bad?
Neither. High IV means options are expensive because the market expects big moves. That is a headwind for option buyers, who need the stock to move more to profit, and a tailwind for option sellers, who collect more premium but take on more risk. What matters is whether IV is high relative to what the stock is likely to do.
How accurate is the expected move?
It is a market-implied estimate, not a forecast. Under the normal distribution the formula assumes, the stock should finish inside one expected move about 68% of the time. Real returns have fatter tails and cluster around events, so treat the range as the market’s price for uncertainty, not as boundaries the stock will respect.
What is the difference between the expected move and the straddle price?
The at-the-money straddle price reflects the market’s estimate of the average absolute move, which is about 0.8 times the one-standard-deviation expected move. Some tools show the straddle itself as “the expected move,” and others show the one-standard-deviation figure. Check which one you are reading before comparing numbers across platforms.
The one idea to keep
Implied volatility is the options market telling you, in a single number, how much movement it is charging for. Convert it into an expected move every time, think about strikes and outcomes in those units, and remember that the range is a 68% estimate built on a bell curve that real markets do not always follow. The traders who get the most out of options are not the ones with the best forecasts. They are the ones who know exactly what the market is already pricing.
See it on the tape, not just in the headlines
TapeDash is the research desk for traders and investors: live options flow, dealer positioning, a real-time market scanner and trade alerts graded in public. Memberships open January 1, 2027, and the first 200 members lock Pro at $99 a month for as long as they stay.
Join the waitlistClick through the terminalSee the track recordSources
- Option Alpha: Implied Volatility
- The Motley Fool: Implied Volatility
- Saxo: Understanding and calculating the expected move of a stock, ETF or index
- tastylive: The Expected Move and the Normal Distribution
- Cboe: Volatility Index Methodology, Cboe Volatility Index
- NerdWallet: What Is the VIX Index?
- Fidelity: Trading Options and Earnings (webinar deck)
- Options Industry Council: The Crush Is Real
- Montreal Exchange: Understanding Volatility Crush
This article is for educational and informational purposes only. It is not financial, investment, medical or legal advice, and it is not a recommendation to buy or sell any security. Figures come from the sources listed and were checked on the date of publication; markets change quickly. Options trading involves substantial risk of loss.