Options Greeks Explained: Delta, Gamma, Theta and Vega in Practice
Options Greeks explained in plain words, with worked examples for delta, gamma, theta and vega, how they trade off, and how to use them to pick strikes.
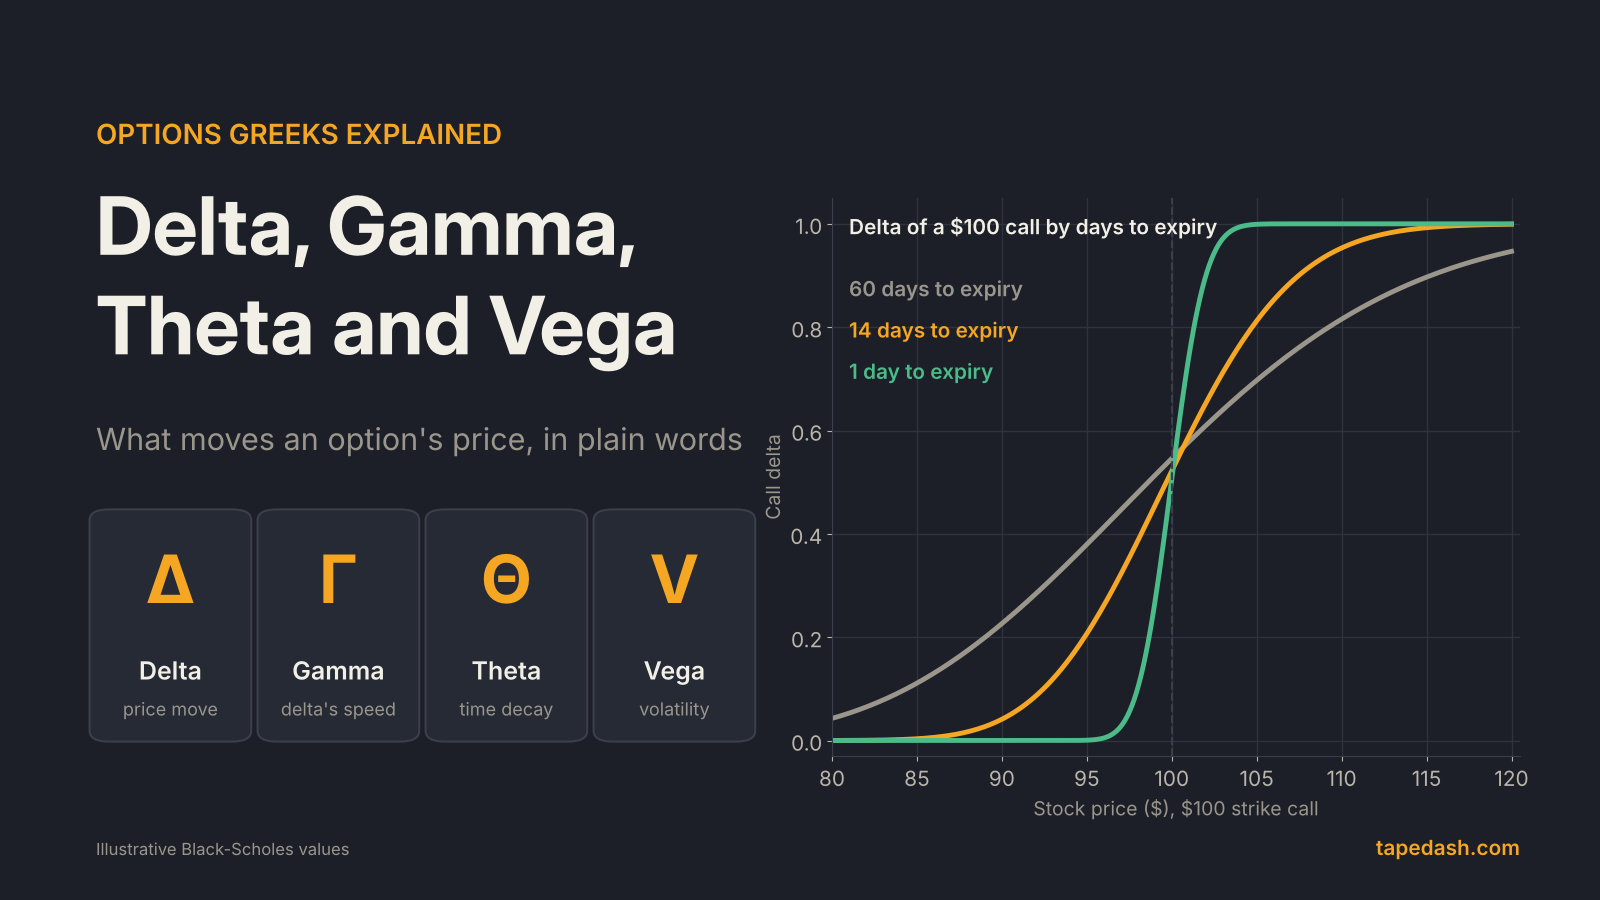
The options Greeks are four numbers that tell you why an option’s price changes. Delta is how much the option moves when the stock moves $1. Gamma is how fast delta itself changes. Theta is how much value the option loses each day from the passage of time. Vega is how much the price changes when implied volatility moves one point. Every option chain shows them, and most traders glance past them on the way to the bid and ask.
That is a mistake on a day like today. The Federal Reserve’s two-day meeting wraps up this afternoon, per the Fed’s calendar, and event days are when the Greeks stop being abstract. An option can be right on direction and still lose money because volatility drained out of it, or because the move came too slowly to outrun time decay. The Greeks tell you in advance which of those risks you own.
This guide takes each Greek in plain words, works through a single hypothetical option so you can see the numbers interact, and then turns it into a practical routine for choosing strikes and expirations. Every number in the worked examples comes from the Black-Scholes model run on made-up inputs, so treat them as illustrative, not as quotes on any real stock.
- Delta estimates the option’s dollar move per $1 in the stock and doubles as a rough guide to the odds of finishing in the money.
- Gamma is highest for at-the-money options close to expiration, which is why short-dated options swing so hard.
- Theta is the daily rent you pay to own an option. For at-the-money strikes it accelerates in the final weeks.
- Vega is largest in longer-dated options, and it is what turns an earnings “win” into a loss when implied volatility collapses after the report.
- Gamma and theta are two sides of one trade. Long options win if the stock moves more than the price implied; short options win if it moves less.
What are the options Greeks?
The Greeks are sensitivities. Each one isolates a single input to an option’s price (the stock price, time, or implied volatility) and asks how much the price changes when that input moves while everything else stays put. Cboe’s own primer frames them exactly this way, and adds a fifth, rho, for interest rates. Rho matters for long-dated contracts, but for most traders holding options for days or weeks it is the least important of the set, as the Corporate Finance Institute notes. We will stick to the four that drive day-to-day P&L.
Two conventions trip people up. First, Greeks on a chain are per share. A standard equity contract covers 100 shares, so a theta of -0.06 means about $6 a day per contract. Second, theta is usually quoted per calendar day, as the Options Industry Council’s Greeks slides describe it, though some platforms quote it per trading day. Check which one your platform uses before you compare numbers across tools.
The hypothetical option we will use
To keep everything consistent, every example below uses one imaginary stock trading at $100, with implied volatility of 30%, a 4% interest rate and no dividend. Our main contract is the $100-strike call with 30 days to expiration. Black-Scholes prices it at $3.59 per share, with delta 0.53, gamma 0.046, theta -0.062 and vega 0.114. Hold on to those five numbers; the rest of the article is about what they mean.
Delta: how much the option moves with the stock
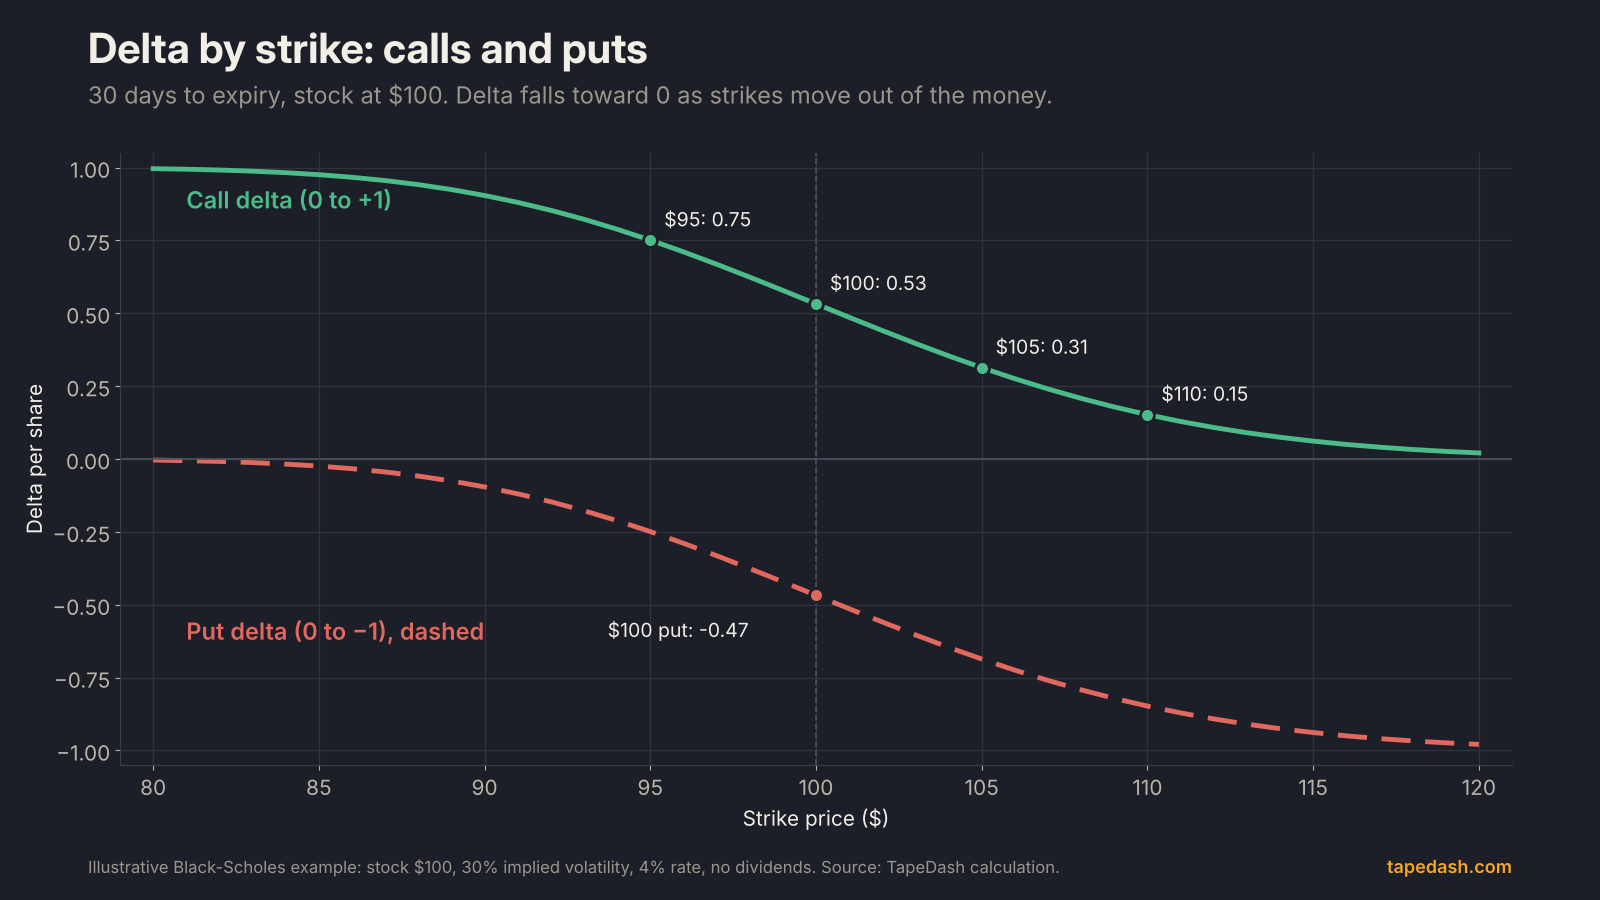
Delta is the first Greek anyone learns, and the most useful. The OIC defines it as the expected change in an option’s price for each one-point move in the underlying stock. Call deltas run from 0 to +1 and put deltas from 0 to -1.
Our $100 call has a delta of 0.53. If the stock ticks from $100 to $101, the call should gain about 53 cents, or about $53 per contract. The matching $100 put has a delta of -0.47, so it would lose about 47 cents on the same move. That also gives you the share-equivalent view: one call contract with a 0.53 delta behaves, for small moves, like owning 53 shares.
Delta as a rough probability
Delta has a second life as a quick estimate of the chance an option finishes in the money. The OIC slides give the example of a 70-delta call implying roughly a 70% chance of expiring in the money, and Option Alpha and Optiver describe it the same way. In our model, the $105 call has a delta of 0.31 while the model’s actual probability of finishing above $105 is about 28%. Close enough to be useful, not exact enough to bet the account on. Also remember that finishing in the money is not the same as making money: you still have to recover what you paid.
Gamma: how fast delta changes
Gamma is the rate of change of delta. Schwab defines it as how much an option’s delta is expected to change when the stock moves $1. Our call’s gamma is 0.046, so after a $1 rally its delta should climb from 0.53 to roughly 0.58.
Here is what that does to a real move. If the stock jumps $2, delta alone predicts a gain of $1.06. But delta is rising the whole way up, so the true gain is a little more. Add the gamma term (half of gamma times the move squared, about 9 cents) and you get a new price of about $4.75, which matches a full Black-Scholes repricing to within a fraction of a cent. That extra 9 cents is gamma at work: long options get longer as the stock rallies and shorter as it falls.
Why gamma explodes near expiration
Gamma is highest for at-the-money options and climbs as expiration approaches. Schwab’s example shows an SPX call’s gamma nearly tripling between 60 days and 7 days out, and Optiver says the same about short-dated at-the-money contracts. Our model makes the point dramatically: the $100 option’s gamma is 0.046 with 30 days left, 0.096 with 7 days left, and 0.254 with a single day left.
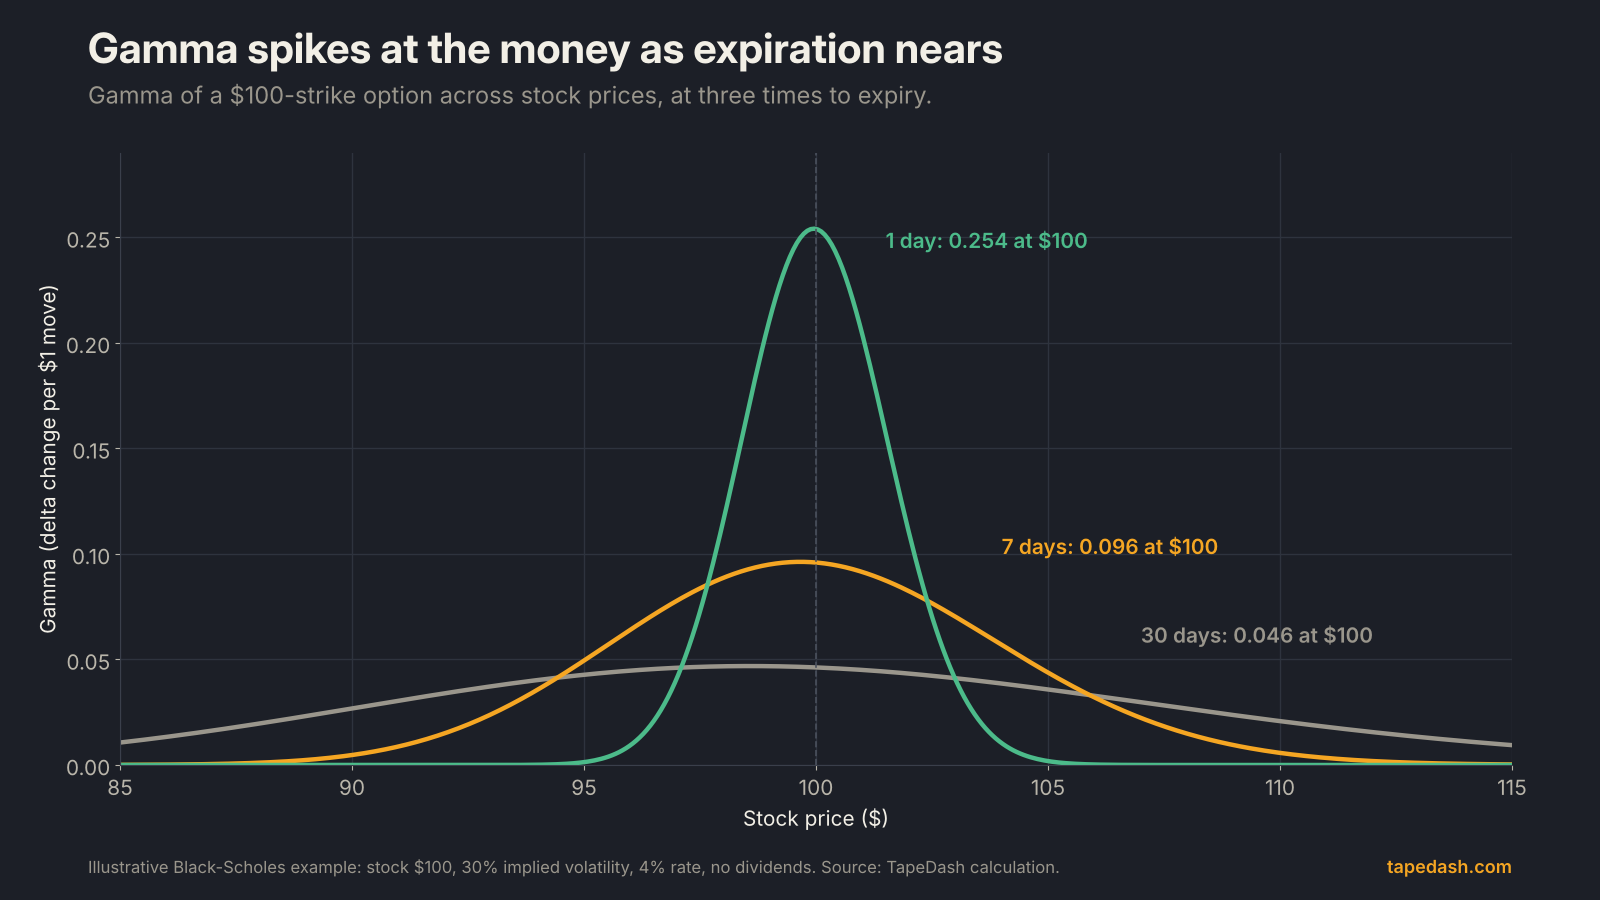
That spike is why 0DTE and weekly options can double or go to zero in an afternoon, and it is also the engine behind pinning and dealer hedging flows. We cover the market-wide version of this, where dealers’ combined gamma shapes how indexes trade, in our guide to dealer gamma exposure.
Theta: the daily cost of time decay
Theta measures how much value an option loses as one day passes, with everything else unchanged. Both calls and puts carry negative theta when you own them, according to the OIC. For our 30-day call, theta is -0.062: if the stock sits at $100 tomorrow and volatility does not move, the call should be worth about 6 cents less, roughly $6 per contract.
The key feature is that the decay is not a straight line. CME Group says that for at-the-money strikes, decay keeps accelerating into expiration, while tastylive puts it simply: the rate of time decay speeds up as expiration nears.

In our model the same at-the-money call loses about 4.6 cents a day with 60 days left, 6.2 cents with 30, 12.4 cents with 7, and 32 cents on its final day. Measured against the option’s price, the difference is even starker: the 60-day call gives up under 1% of its value per day, while a 7-day out-of-the-money call can lose close to a quarter of its value overnight.
Vega: sensitivity to implied volatility
Vega measures how much an option’s price changes when implied volatility moves one percentage point. The OIC’s vega page gives the example of a vega of 0.15 meaning about 15 cents of premium change per one-point move in IV. Owning options means being long vega, so both calls and puts gain value when IV rises and lose it when IV falls.
Our 30-day call has a vega of 0.114. If implied volatility climbs from 30% to 35% with the stock unchanged, the call gains about 57 cents, from $3.59 to about $4.16. Nothing about the stock changed; the market simply started paying more for the possibility of movement.
Vega grows with time to expiration. The OIC says longer-term options tend to have higher vega than near-term ones, and tastylive makes the same point. In our model the at-the-money vega is 0.161 at 60 days, 0.114 at 30 days and only 0.055 at 7 days. If you want exposure to a change in volatility, longer-dated options give you more of it. If you want to avoid it, shorter-dated options carry less, though they come with more gamma and theta instead.
How the Greeks work together
In real trading the inputs never move one at a time. The useful skill is adding the Greeks up to estimate what a busy day will do to a position, then checking whether the risk you are carrying is the risk you meant to carry.
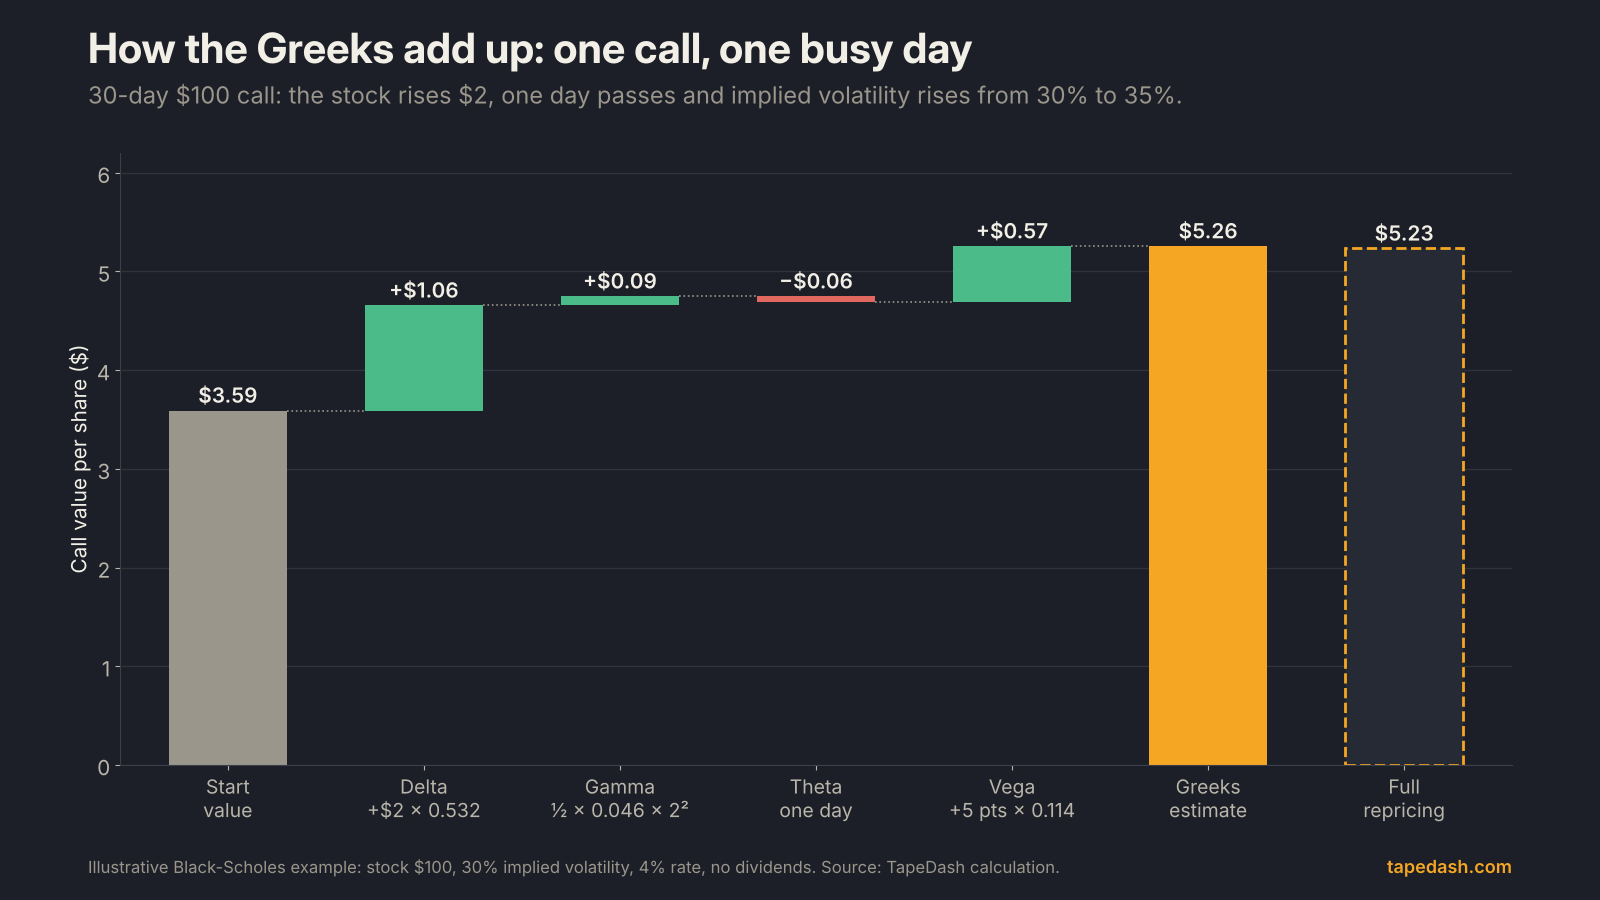
Take our call through one eventful day: the stock rises $2, a day passes, and implied volatility rises from 30% to 35%. Delta adds about $1.06, gamma about $0.09, theta subtracts about $0.06 and vega adds about $0.57. The Greeks estimate a new price of $5.26. A full repricing gives $5.23. In this example, vega contributed more than half as much as delta, which surprises most people the first time they see it.
The gamma vs theta tradeoff
Gamma and theta are linked. When you own an option you are long gamma and short theta: you pay decay every day in exchange for profiting from big moves. When you sell an option you collect the decay and accept that a big move will hurt. Schwab describes the seller’s side of this directly: collecting theta near expiration means carrying large negative gamma.
There is a neat way to see the break-even. Imagine a market maker who owns our 30-day call and hedges its delta by shorting 53 shares. Overnight, the hedged position loses theta (about 6 cents) and gains roughly half of gamma times the squared move. Set those equal and the break-even move is about $1.64 in either direction.
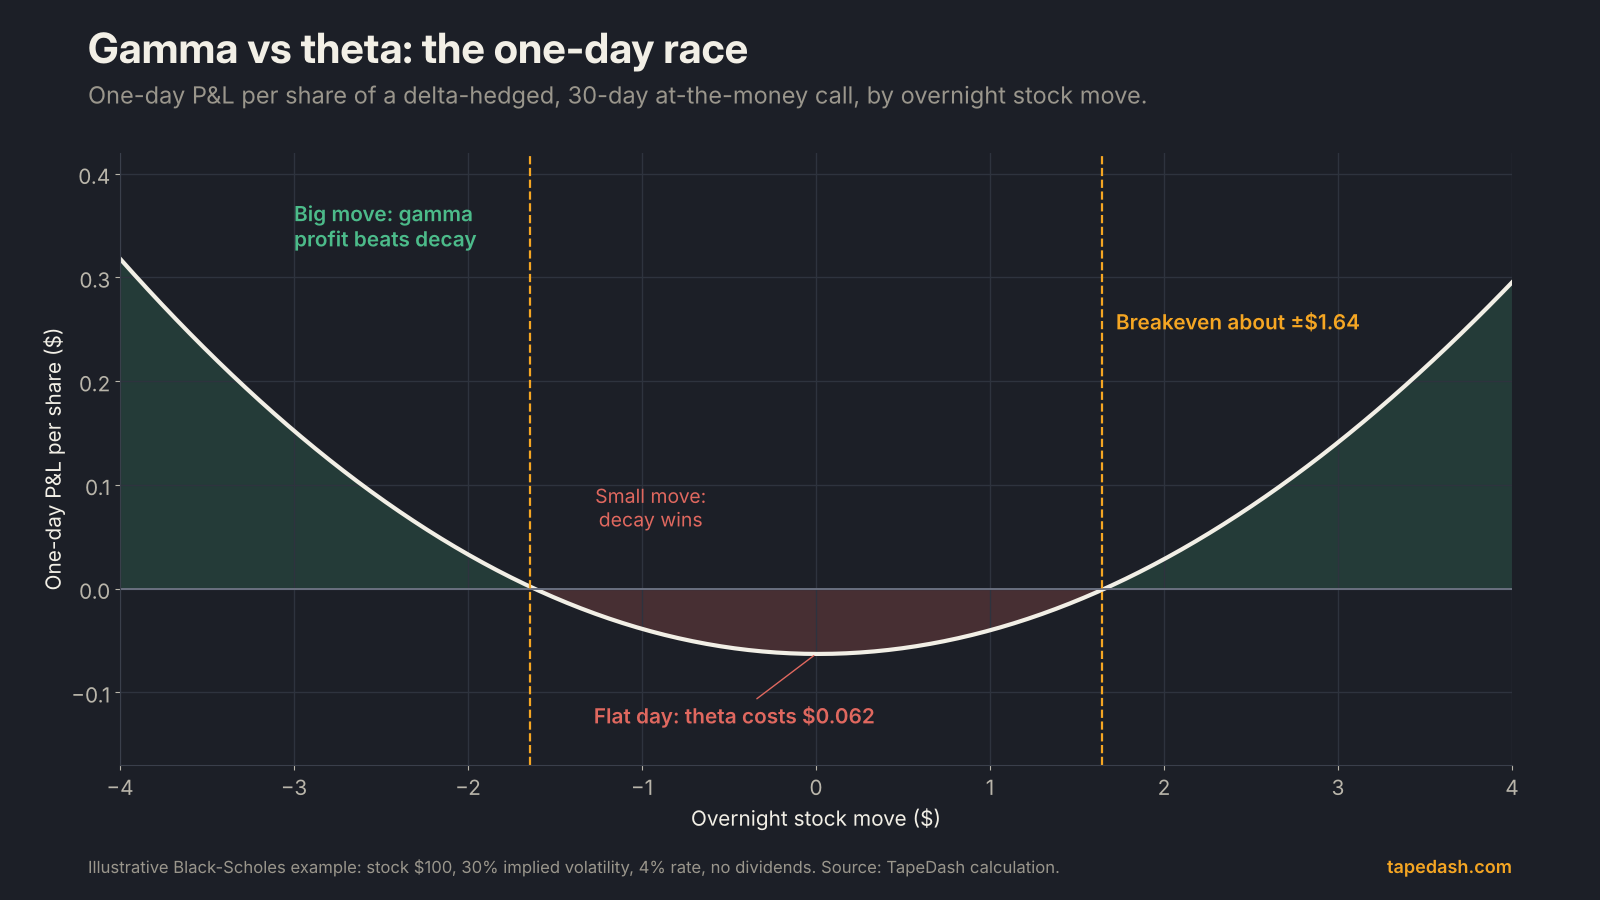
That $1.64 is not random. A 30% annual volatility works out to about $1.57 per calendar day on a $100 stock, nearly the same number. That is the whole game in one sentence: buying options is a bet that the stock will move more than implied volatility says it will, and selling them is a bet that it will move less. The Greeks just put a dollar figure on it.
Vega into earnings and other events
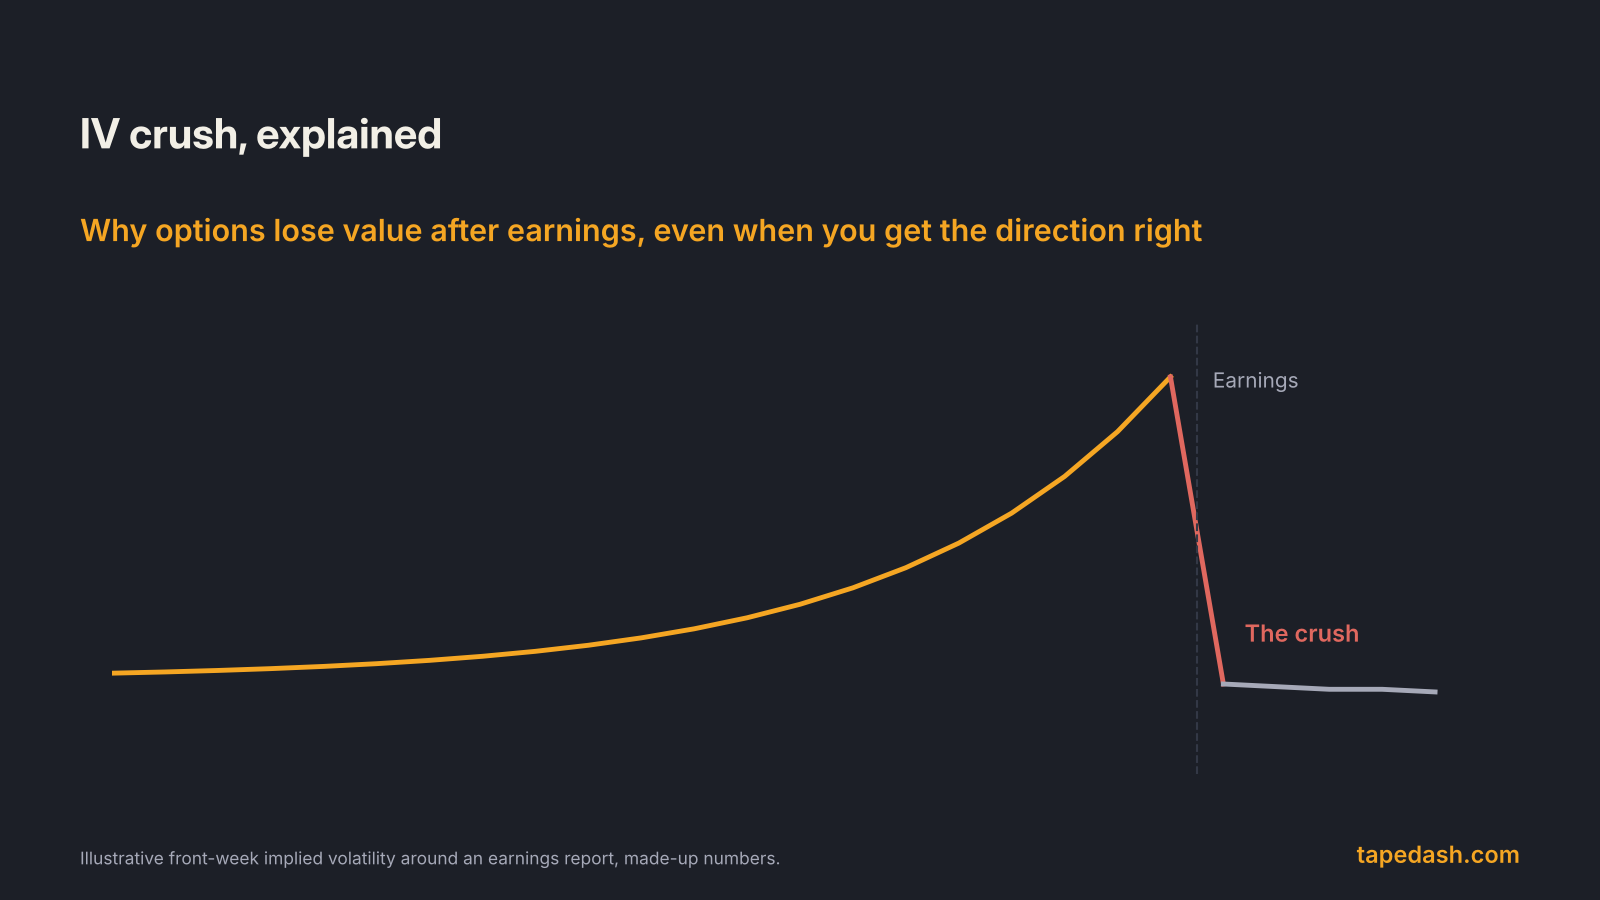
Implied volatility tends to build before scheduled events (earnings, FDA decisions, big economic releases like today’s Fed decision) and then drop once the news is out. Vega tells you how much that drop costs. Our model makes it concrete with a 7-day $100 call bought the day before earnings at 70% implied volatility, which falls to 35% after the report.
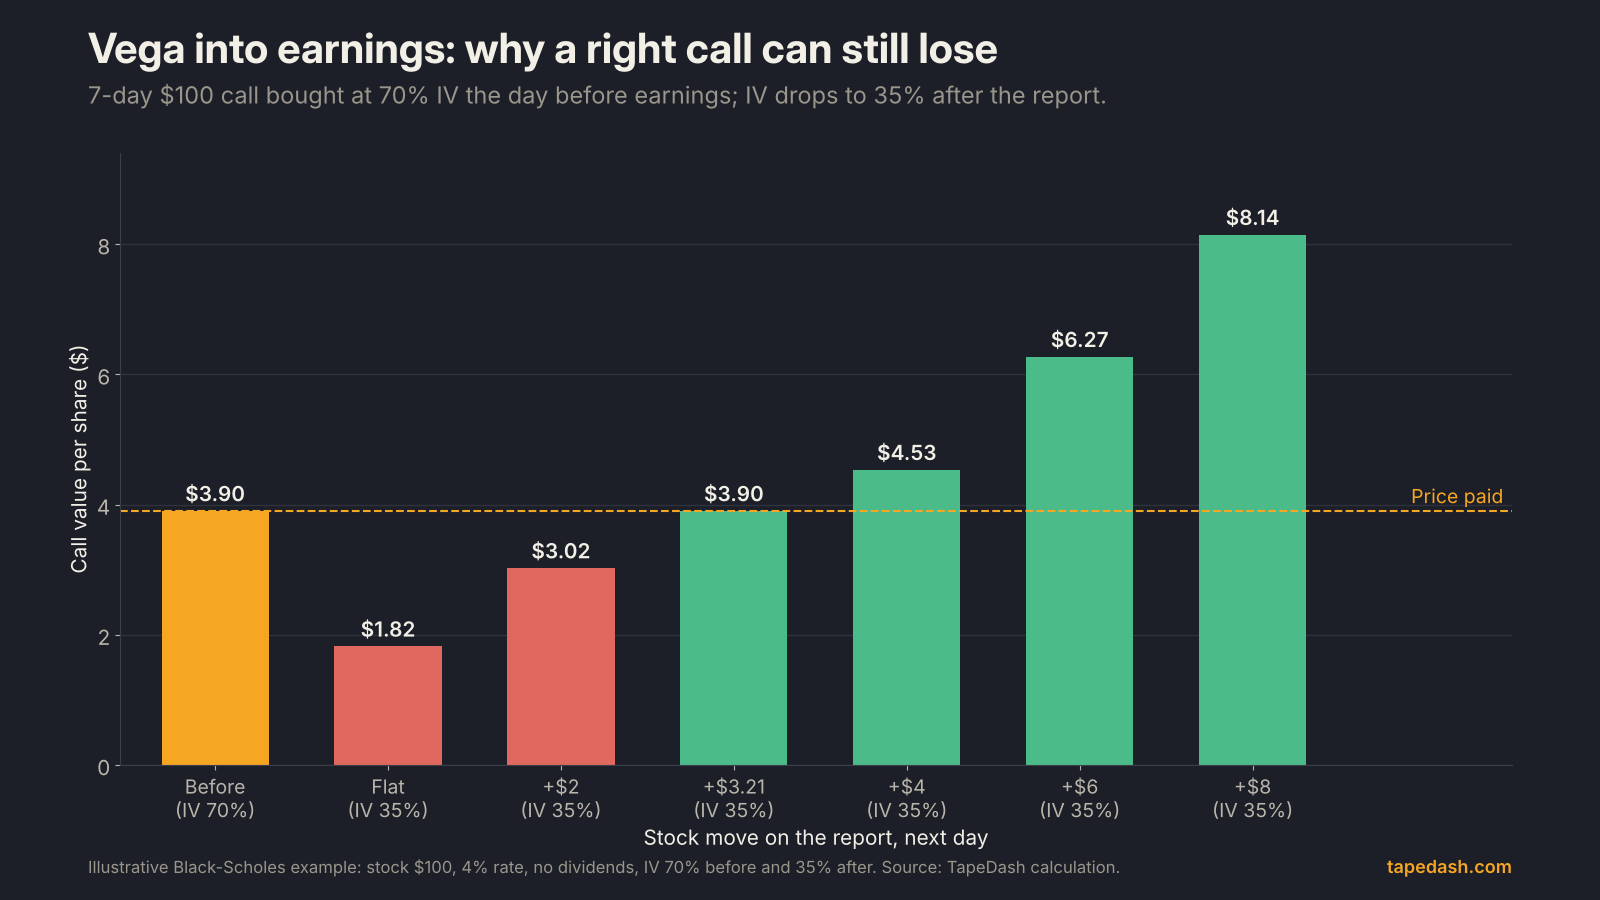
The call costs $3.90 going in. If the stock does nothing, the volatility drop alone cuts it to $1.82, a loss of more than half. If the stock rises $2, the call is still worth only $3.02. The stock needs to rally about $3.21 before the buyer breaks even. This is the trap of buying options right before earnings, and we break down the full mechanics in our post on IV crush. The cleanest way to judge whether a pre-event option is expensive is to compare its price with the expected move the options market is implying.
Options Greeks at a glance
| Greek | Plain-words meaning | Our 30-day $100 call | Helps the option buyer when | Largest for |
|---|---|---|---|---|
| Delta | Price change per $1 stock move | 0.53 (about $53 per contract per $1) | The stock moves in your direction | Deep in-the-money options (near 1) |
| Gamma | Change in delta per $1 stock move | 0.046 | The stock moves a lot, either way | At-the-money options near expiration |
| Theta | Value lost per day from time | -0.062 (about $6 per contract per day) | Never; it is the cost of owning | At-the-money options in the final weeks |
| Vega | Price change per 1-point IV move | 0.114 (about $11 per contract per point) | Implied volatility rises | At-the-money, longer-dated options |
How to use the Greeks to choose strikes and expirations
Here is how I think about it as a process. None of this tells you what to trade; it tells you what you are signing up for once you have an idea.
Step one: pick the delta that matches your conviction
Delta is the dial between probability and payoff. A higher-delta option (in the money, 0.60 to 0.80) behaves more like stock and needs less movement to work, but it costs more. A low-delta option (0.15 to 0.30) is cheap and pays a lot if you are right, but the market is telling you it will probably expire worthless. Many traders who sell premium start around the 30-delta strike for exactly that reason, while buyers who want stock-like exposure lean toward 0.60 and above.
Step two: match the expiration to your timeline
The comparison below uses our model stock to show how much the same idea changes with the calendar. Watch the theta-to-price column: it is the percentage of the option you lose each day if nothing happens.
| Contract (illustrative) | Price | Delta | Gamma | Theta per day | Theta as % of price | Vega |
|---|---|---|---|---|---|---|
| 7-day $100 call | $1.70 | 0.52 | 0.096 | -$0.124 | 7.3% | 0.055 |
| 7-day $105 call | $0.26 | 0.13 | 0.050 | -$0.064 | 24.3% | 0.029 |
| 30-day $100 call | $3.59 | 0.53 | 0.046 | -$0.062 | 1.7% | 0.114 |
| 30-day $105 call | $1.66 | 0.31 | 0.041 | -$0.054 | 3.3% | 0.102 |
| 60-day $100 call | $5.17 | 0.55 | 0.033 | -$0.046 | 0.9% | 0.161 |
| 60-day $105 call | $3.09 | 0.39 | 0.031 | -$0.043 | 1.4% | 0.155 |
The cheap 7-day out-of-the-money call is the classic lottery ticket: it bleeds nearly a quarter of its value per day if the stock stands still. The 60-day contracts cost more in dollars but lose a sliver per day, at the price of more vega. A simple rule that holds up well: give the trade more time than you think it needs, because the decay curve punishes being early far more than being late.
Step three: check vega against the calendar
Before buying, look for scheduled events between today and expiration. If an earnings report or major data release falls inside your window, implied volatility is probably already high, and your vega exposure is a bet that it stays that way. If you want direction without the volatility bet, spreads help: buying one option and selling another against it cancels much of the vega and theta, at the cost of capping the payoff.
Step four: size by dollar Greeks, not contract count
Ten contracts of a 0.20-delta call and two contracts of a 0.80-delta call are roughly the same directional bet. Converting delta into share-equivalents and theta into dollars per day makes positions comparable. Once everything is in share-equivalents and dollars per day, it is much easier to keep any single position from dominating the account.
What to watch next
A few dates on the calendar will put these Greeks to work:
- November 20, 2026: the standard monthly options expiration, the third Friday of the month per the MarketXLS expiration calendar. Gamma on at-the-money strikes will be at its highest that week.
- December 8 and 9, 2026: the next two-day FOMC meeting, with the decision on December 9, per the Federal Reserve and Finance Calendar. It comes with a Summary of Economic Projections, so index options expiring that week will carry the event in their price.
- December 18, 2026: the quarterly expiration, when stock options, index options and index futures all expire together, as listed by both MarketXLS and Option Samurai.
Around each of these, watch how implied volatility behaves before and after the event. That is vega at work, and it is the Greek most traders forget to check.
How to see the Greeks in TapeDash
If you want to watch these numbers on real contracts instead of a made-up stock, this is where we look. On the Flow page, search a ticker and its full option chain loads under the live tape. Click any row and it expands to show the bid and ask volume along with delta, gamma, theta and vega for that contract. Clicking through to a single contract’s page puts its implied volatility, open interest and Greeks side by side, so when an unusual print shows up on the tape you can see right away whether it was a high-delta stock substitute or a cheap, fast-decaying lottery ticket.
The Strategy Builder goes one step further and adds up the Greeks for the whole position: delta as share-equivalents, theta in dollars per day, vega in dollars per IV point, and gamma. Its implied volatility slider lets you run the earnings test from this article yourself (slide IV down and watch the P&L), and its read flags when earnings fall before your expiration. You can click through the layout of both pages in the Terminal Preview with sample numbers and no account; the Strategy Builder preview is there too. Live chains and Greeks are part of Pro, and the first 200 members lock Pro at $99 a month for as long as they stay.
Options Greeks FAQ
Which option Greek matters most?
For most traders it is delta, because it sets the direction and size of the bet. But the one that most often explains a surprise loss is theta for short-dated options and vega for options bought before an event. Check all four before entering a trade.
Why did my option lose value when the stock went my way?
Usually one of two reasons. Either time decay took more than the stock move added (theta beat delta), or implied volatility fell and vega took the gain away. The second is common right after earnings or other scheduled news.
Are the Greeks the same on every platform?
The concepts are the same, but the numbers can differ slightly. Platforms use different models, different implied volatility inputs and different conventions for theta (calendar days versus trading days). Use one source consistently when comparing contracts.
The one idea to keep
Every option is a bundle of four bets: on direction, on the size of the move, on how fast it happens, and on what volatility does in the meantime. The Greeks tell you how much of each you own. Read them before you place the trade, not after it goes wrong, and you will rarely be surprised by an option’s price again.
See it on the tape, not just in the headlines
TapeDash is the research desk for traders and investors: live options flow, dealer positioning, a real-time market scanner and trade alerts graded in public. Memberships open January 1, 2027, and the first 200 members lock Pro at $99 a month for as long as they stay.
Join the waitlistClick through the terminalSee the track recordSources
- Cboe: Learning the Greeks, An Expert's Perspective
- Options Industry Council: Understanding the Greeks (slides, hosted by Fidelity)
- Options Industry Council: Vega
- CME Group: Options Theta, The Greeks
- Charles Schwab: Options Greeks, Gamma Explained
- Optiver: Option Greeks explainer
- tastylive: Option Greeks
- Option Alpha: Options Greeks
- Corporate Finance Institute: Option Greeks
- Federal Reserve: Meeting calendars and information
- Finance Calendar: FOMC Rate Decision December 2026
- MarketXLS: Option Expiration Calendar 2026
- Option Samurai: Triple Witching Dates 2026 and 2027
This article is for educational and informational purposes only. It is not financial, investment, medical or legal advice, and it is not a recommendation to buy or sell any security. Figures come from the sources listed and were checked on the date of publication; markets change quickly. Options trading involves substantial risk of loss.