What Is Options Flow? A Plain-English Guide for Beginners
What options flow is, where the data comes from, who is on the other side, what makes a trade unusual, and the mistakes beginners make reading it.
Options flow is the running record of option trades as they happen: which contract traded, how many, at what price, at what time, and whether the buyer or the seller was the one in a hurry. When people say they “watch the flow”, they mean they watch that stream, usually filtered down to the trades that are large, fast or out of the ordinary, because those are the ones most likely to come from someone with money and a view.
That’s the whole idea. A stock chart tells you what price did. Options flow tells you what traders were willing to pay for exposure while it did it, which is often a step earlier and always more specific: a strike, a date and a direction.
This guide covers the basics: what the data is, where it comes from, who sits on the other side of every trade, what makes a trade “unusual”, and the mistakes almost everyone makes in their first month of reading it. If you already know the basics and want the reading technique (sweeps, blocks, bid versus ask, real bets versus hedges), our companion piece on how to read options flow picks up where this one ends.
- Options flow is the stream of option trades as they print: contract, size, price, time and which side was aggressive.
- Every US option trade is reported to one consolidated feed (OPRA), so everyone sees the same trades; the difference is how they’re filtered.
- A market maker is on the other side of most trades, and their hedging is part of why big options trades can move stocks.
- “Unusual” usually means large relative to normal, bigger than existing open interest, short-dated, out of the money and paid for at the ask.
- Flow is evidence, not instruction: many big trades are hedges, spreads or closing trades, and you never know who placed them.
What options flow means
Every option trade is a contract between two parties for one specific option: a ticker, a strike price, an expiration date, and a call or a put. When that trade happens, the exchange reports it, and it shows up as a “print”: a single line with the contract, the number of contracts, the price paid and the time.
String those prints together and you have the tape. Options flow is the tape, viewed live, with some context added: the dollar amount spent (the premium), where the price landed relative to the quoted bid and ask, how the trade size compares with normal activity in that contract, and how it compares with the open interest (the number of contracts already open before today).
The reason traders care is leverage. A trader who wants to make a large, directional bet on a stock before an event can do it with far less capital in options than in shares. That makes options the natural venue for conviction, and it makes the options tape one of the few places where you can see conviction being expressed in real size.
There’s a second reason, less obvious and just as important. When someone buys a large block of calls, the market maker who sold them usually hedges by buying stock. That hedging is mechanical. So a burst of aggressive call buying can push the stock up on its own, regardless of whether the original buyer was right. Flow isn’t only a window into opinions. Sometimes it’s a cause of the move.
Where options flow data comes from
Options in the US trade on more than a dozen separate exchanges, and the SEC’s April 2026 market-structure data shows activity has spread across more of them over time, with no single venue holding a dominant share. That fragmentation sounds like it would make the tape impossible to follow. It doesn’t, because of one piece of plumbing.
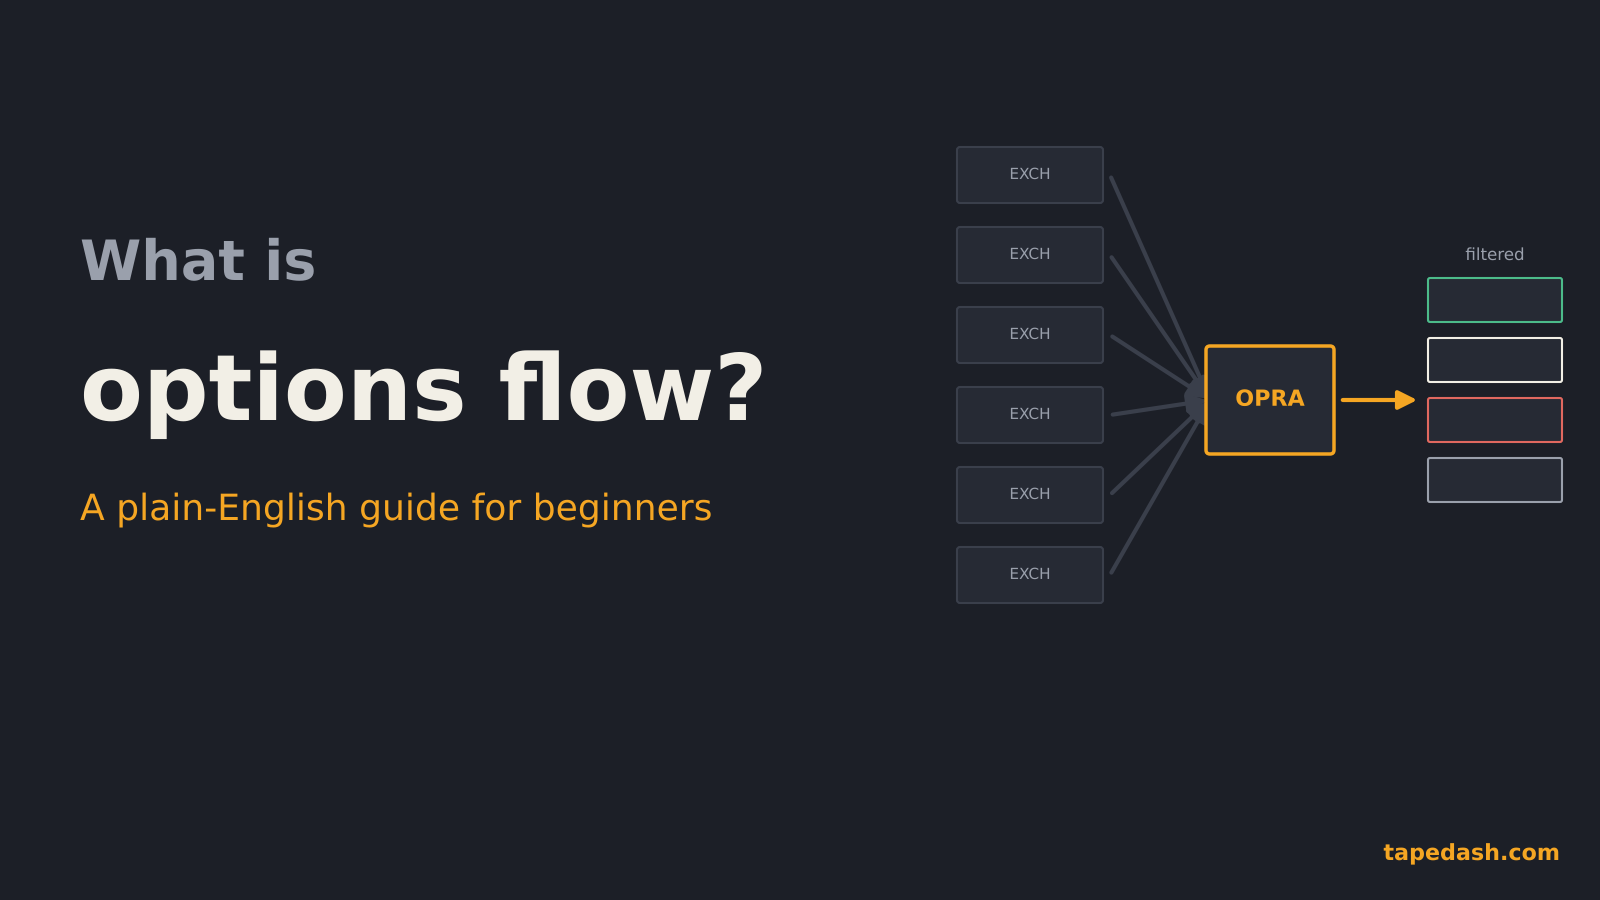
Every exchange reports every trade and every quote to the Options Price Reporting Authority (OPRA), which publishes one consolidated feed. A trade on any exchange shows up on OPRA within milliseconds. Brokers, data vendors and platforms like ours all start from that same feed.
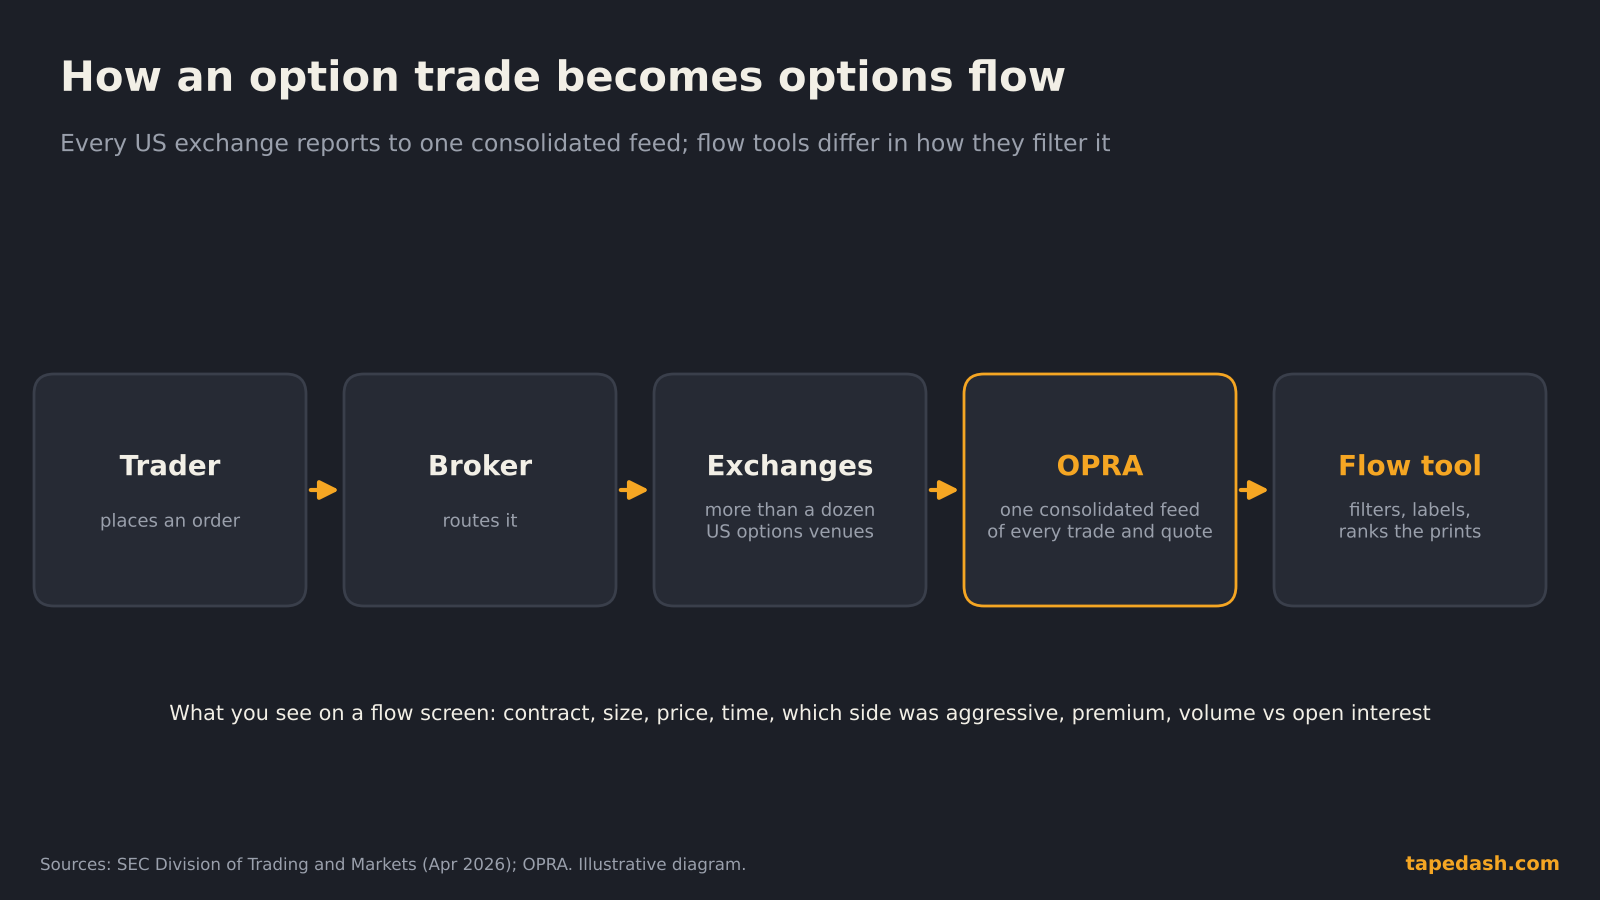
Every US option trade ends up in one consolidated feed. What differs between flow tools is the filtering and labeling on top.
The feed is enormous. The SEC staff report puts OPRA’s median daily message count at roughly 131 billion in December 2025, up from about 9 billion in January 2017, most of it quotes rather than trades. Volume has kept climbing too: the Options Clearing Corporation and Cboe both put 2025 at more than 15 billion contracts, a record, and FOW and Cboe both describe growth of about a quarter over 2024.
That’s why nobody reads raw options flow. The useful work is in the filter: throwing out the millions of small, routine trades so the few hundred that matter are visible. When two flow services show you different “top trades” for the same day, they’re looking at the same OPRA feed through different filters.
Who is on the other side of an options trade
Beginners often picture options flow as one smart trader against another. Most of the time, it isn’t.
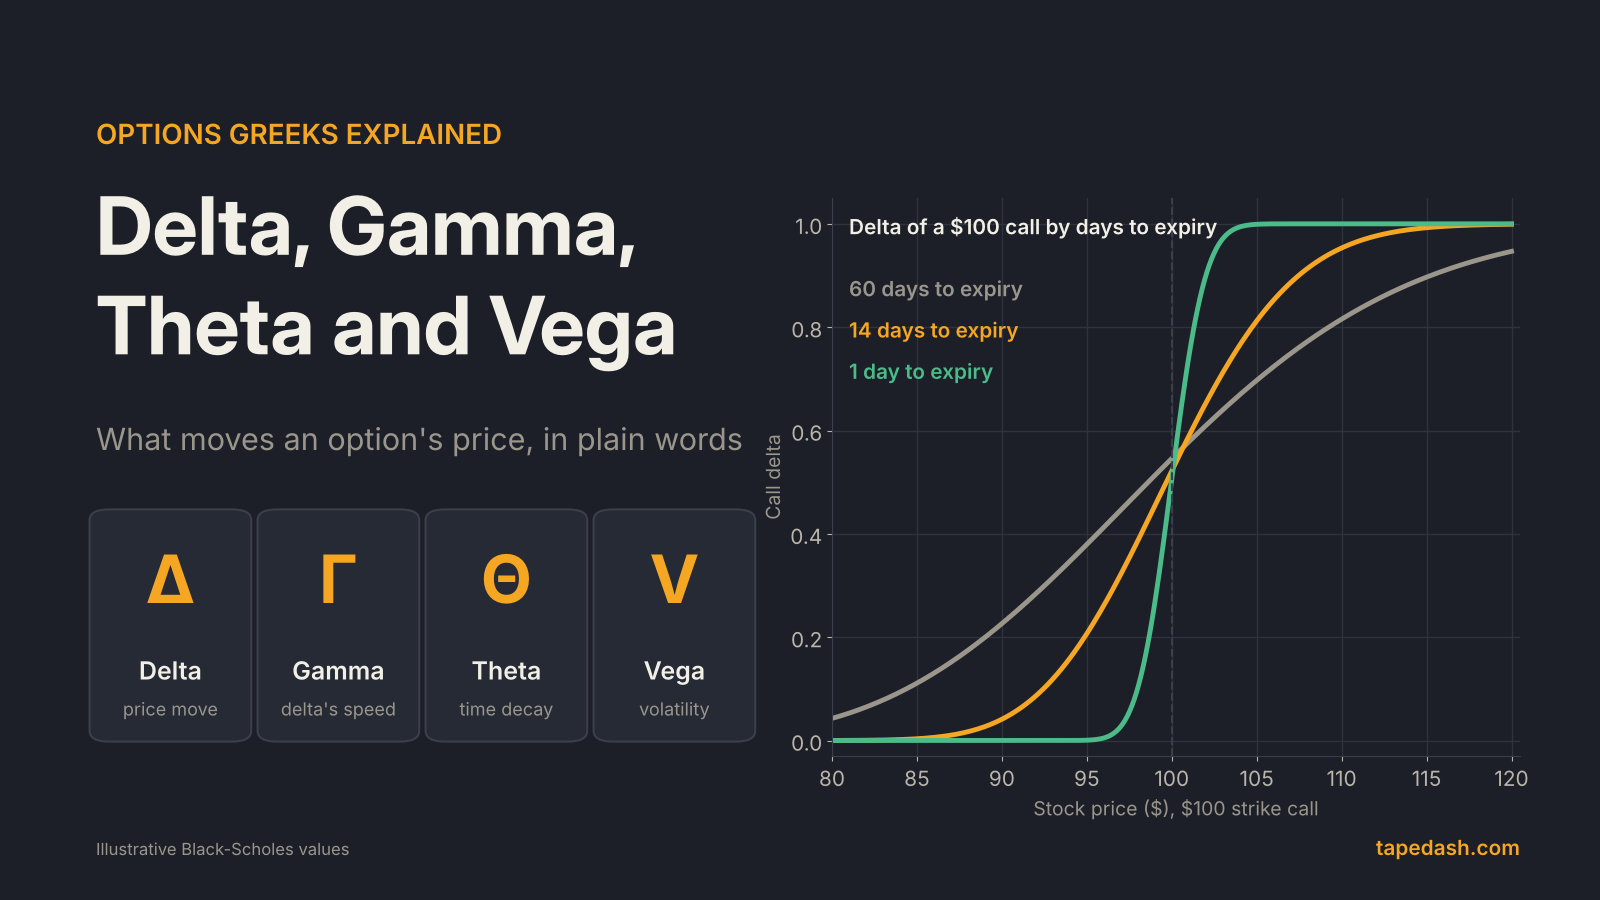
The other side of the typical trade is a market maker: a firm whose job is to quote a bid and an ask in thousands of contracts at once and to earn the spread between them. Market makers don’t want a directional bet. When a customer buys 5,000 calls from them, they are now short those calls, which means they lose money if the stock rises. So they hedge, usually by buying shares of the stock in proportion to the option’s delta.
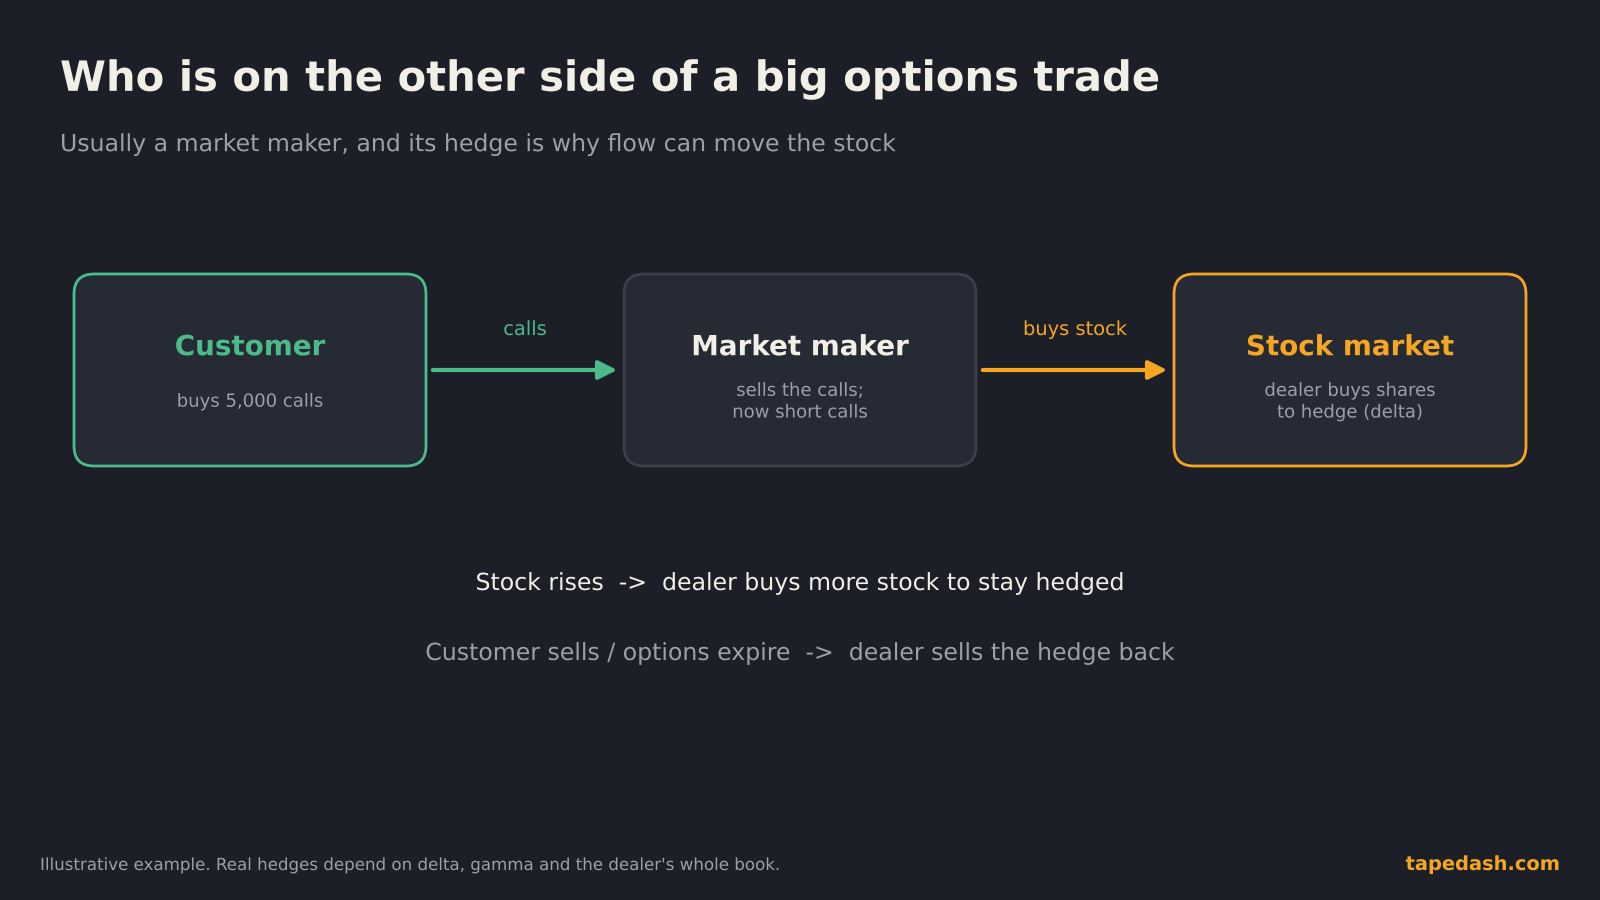
The hedge is the reason large option trades can move a stock: the dealer’s stock buying or selling is mechanical.
This has three consequences for anyone reading flow.
First, a large trade in a thin contract can move the underlying stock, because the hedge has to be bought or sold in the market. Second, those hedges keep adjusting as the stock moves and time passes, which is what our explainer on dealer gamma exposure is about. Third, the “smart money” framing is only half right: the customer may be informed, but the counterparty is usually a hedger who doesn’t care about direction at all.
What makes options flow “unusual”
Most option volume is routine: market makers adjusting, funds rolling positions, retail traders buying a few contracts. “Unusual options activity” is the subset that stands out. There is no single official definition, but the same handful of tests show up in almost every serious filter.
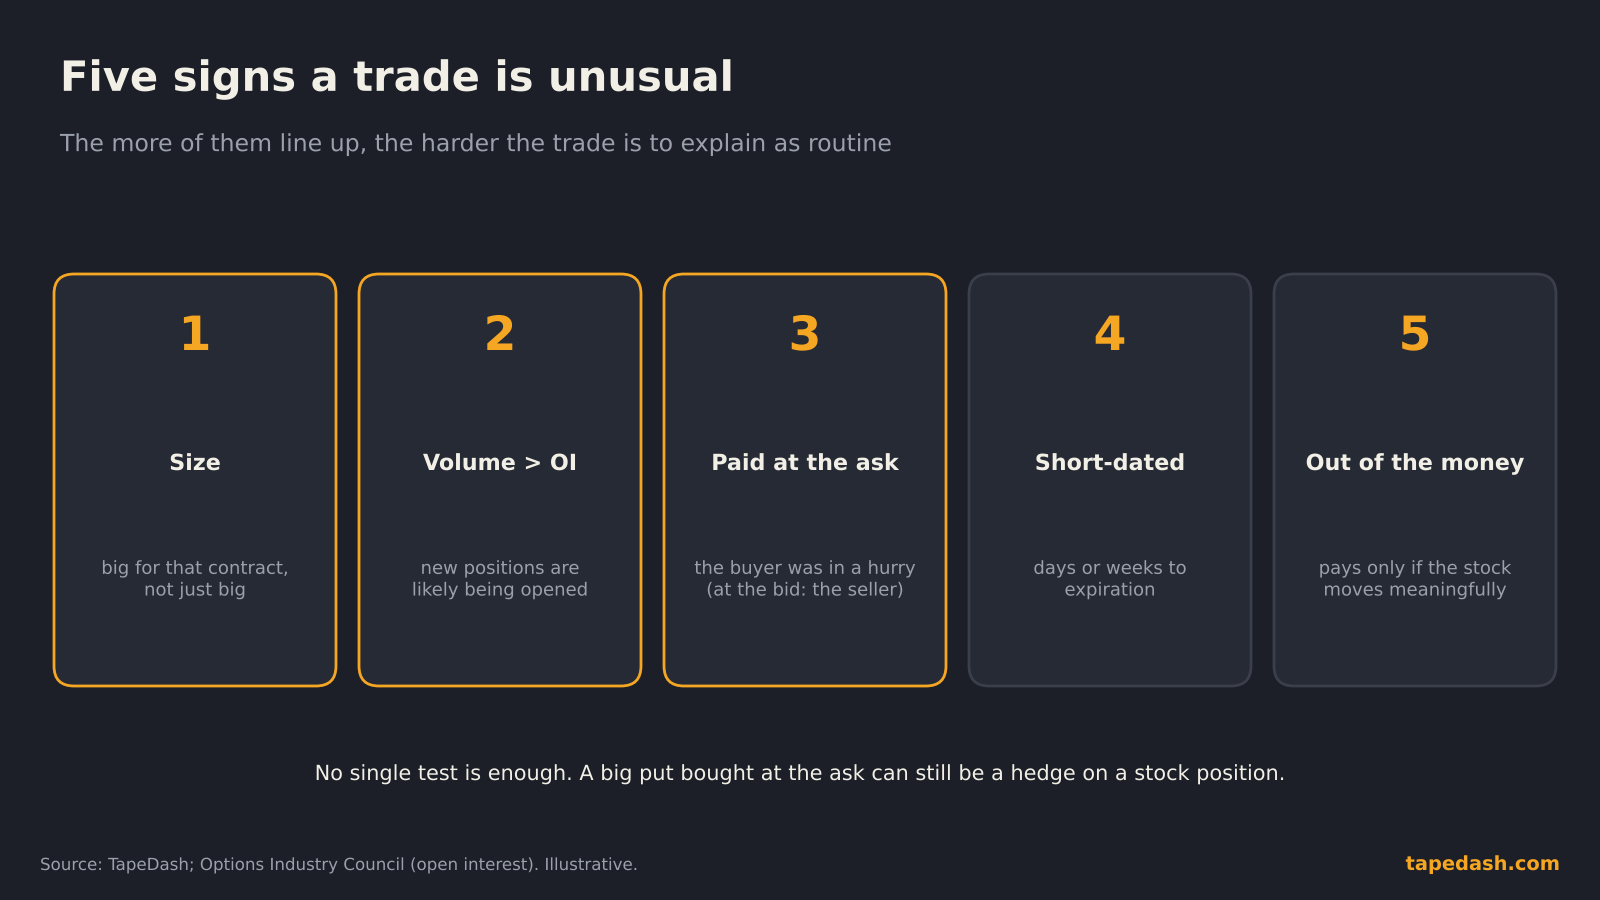
No single test makes a trade meaningful. The more of them line up, the harder the trade is to explain as routine.
Size relative to normal. A 2,000-contract trade means nothing in a contract that trades 200,000 a day and a great deal in one that trades 300. Good filters compare the trade with that contract’s own history, not with a fixed number.
Volume versus open interest. Open interest is the number of contracts that were open before today, published once a day. When a single day’s volume is larger than the existing open interest, new positions are very likely being opened. The Options Industry Council’s guide to open interest is a good primer on why that distinction matters.
Aggression. A trade filled at or above the ask means the buyer paid up to get it done now; one filled at or below the bid means the seller did. A buyer who crosses the spread is telling you speed mattered more than price.
Time to expiration. Short-dated options are cheap and decay fast. Someone spending heavily on contracts that expire in days or weeks has a view about something happening soon.
Strike. Out-of-the-money options pay off only if the stock moves meaningfully. Heavy buying there is a bet on a move, not on drift.
The table below sets options flow next to three related data sets that beginners often mix up.
| Data | What it shows | When it updates | Best for | Main limitation |
|---|---|---|---|---|
| Options flow | Individual option trades: contract, size, price, side | Live, trade by trade | Spotting new, aggressive positioning as it happens | Can’t tell opening from closing on its own |
| Options volume | How many contracts traded today in total | Live, running total | Measuring overall interest in a ticker or contract | Says nothing about direction |
| Open interest | Contracts still open at the last close | Once a day, before the open | Confirming whether yesterday’s trades opened positions | Always a day behind |
| Dark pool prints | Large stock trades done off-exchange | Reported with a short delay | Seeing institutional share accumulation | Usually no side or intent attached |
If you want to go deeper on the last row, our piece on dark pool prints covers how those trades are reported and how to read them.
Does options flow actually predict anything?
This is the honest question, and the answer is “sometimes, under conditions”.
The best-known evidence comes from Jun Pan and Allen Poteshman, whose study was later published in the Review of Financial Studies in 2006. Using Cboe data that identified trades opening new positions by buyers, they built put-call ratios from those trades alone. Stocks with low ratios (more opening call buying) outperformed stocks with high ratios over the next day and the next week, by more than 40 basis points and more than 1% respectively on a risk-adjusted basis. They traced most of the effect to information held by the option traders themselves rather than to stocks being mispriced.
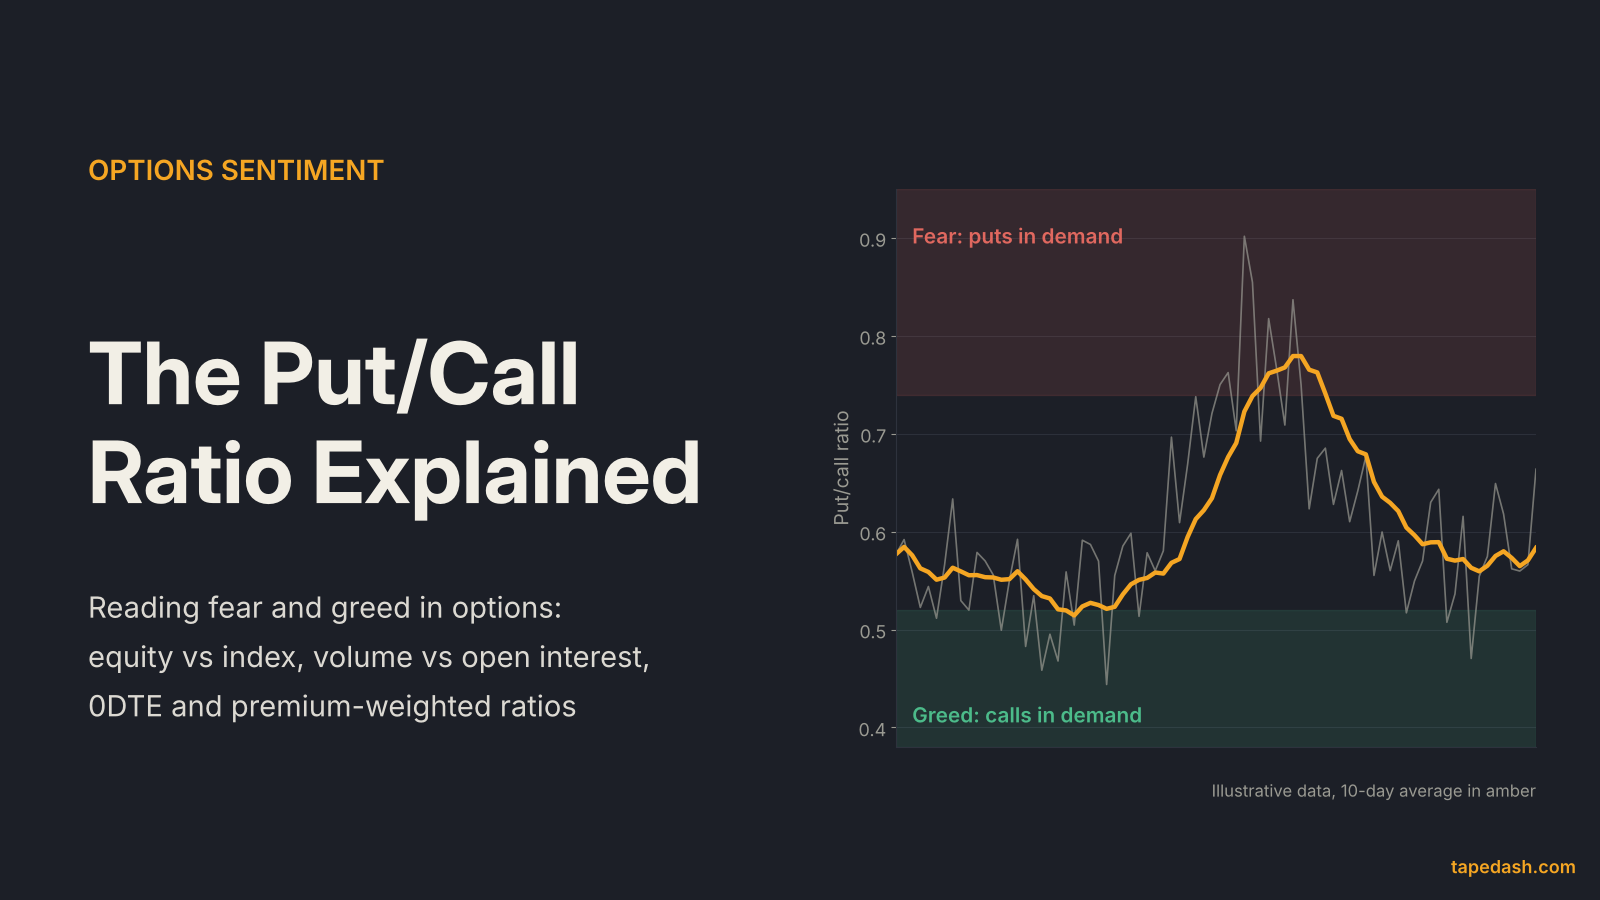
Two details in that research matter more than the headline. The signal came from opening trades, not all volume, which is exactly the distinction most free flow feeds can’t make in real time. And the effect was stronger where option leverage was higher and where informed traders were more likely to be active. That’s the academic case for filtering hard and for checking open interest the next morning, and it’s why a raw put-call ratio, which our put-call ratio explainer breaks down, is a much blunter tool than opening-trade flow.
What the research does not say is that following individual large trades makes money. Studies average across thousands of trades. Any single print can be a hedge, a spread, a closing trade or simply wrong.
Common mistakes beginners make with options flow
Treating every big put as a bearish bet. Large put purchases are often portfolio insurance. A fund that owns $500 million of a stock may buy puts before earnings to cap its downside. That’s a hedge, and it says nothing about what the fund expects.
Ignoring the other legs. Many large prints are one leg of a spread: calls bought at one strike and sold at another, or a call bought against a put sold. Read as a single trade, a bull spread can look like aggressive call buying when the trader’s real view is much more limited.
Assuming the trade opened a position. A big print can just as easily be someone closing out. Without the next day’s open interest, you’re guessing. That’s the single best reason to check a trade the morning after.
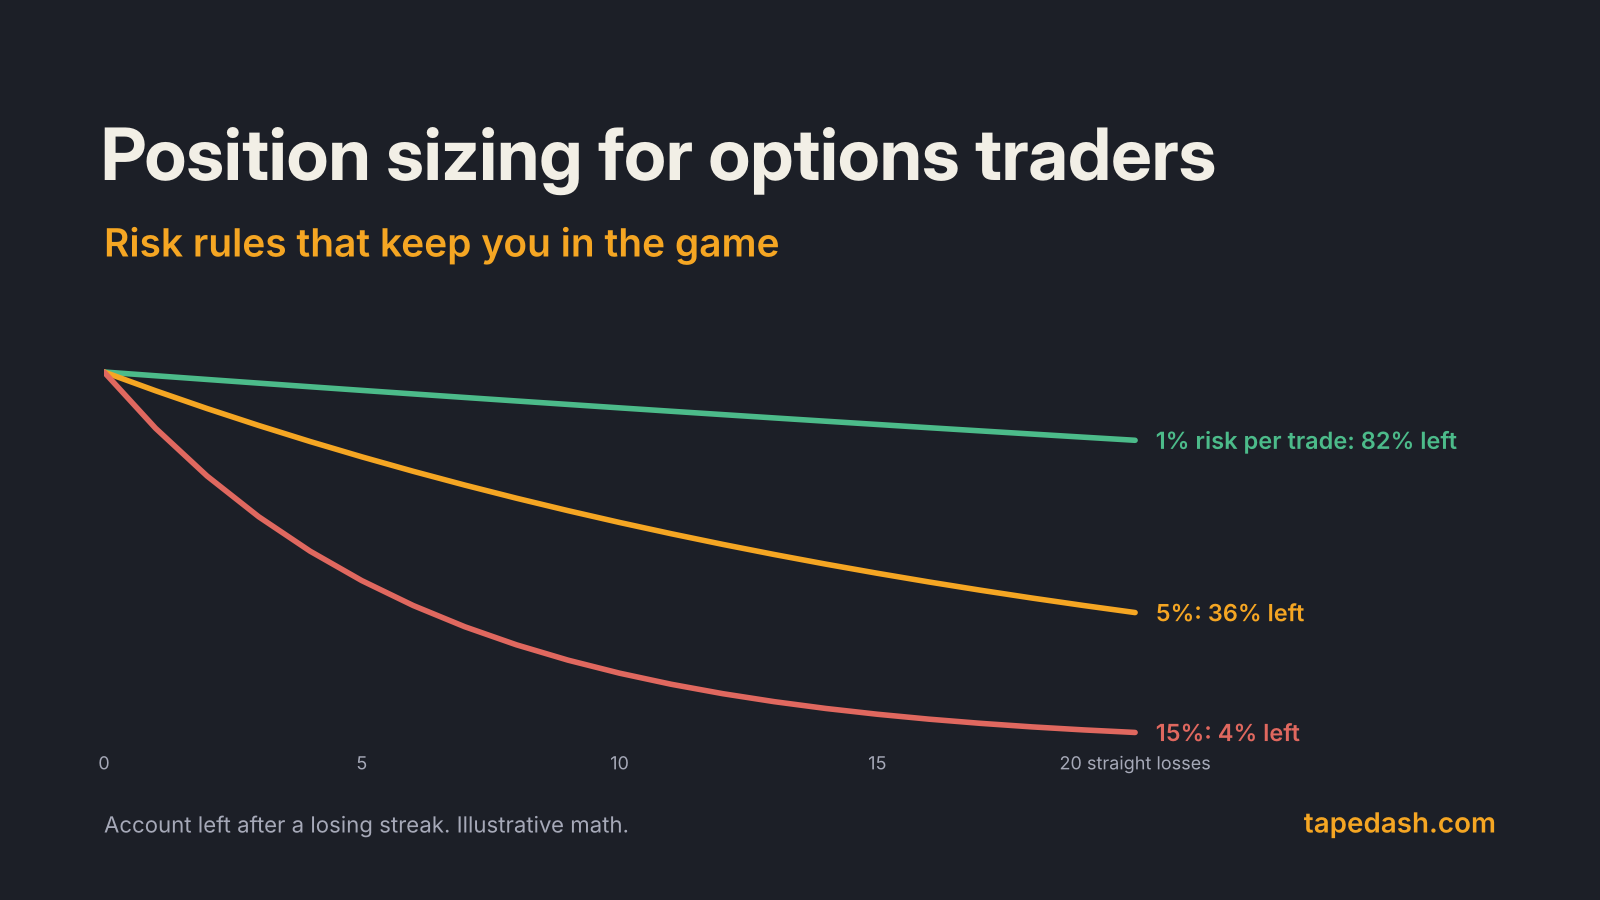
Following without a plan. Even a well-informed trade has a time horizon, a size and a risk budget you don’t know. If you copy the direction without your own exit and your own position size, you have taken their idea and none of their risk management. Our guide to options position sizing covers how to set that budget before you trade.
Mistaking volume for importance. The most-traded contracts every day are dominated by index ETFs and a handful of mega-cap stocks. High volume there is normal. The interesting trade is often the modest-sized one in a contract that rarely trades at all.
How to start reading options flow
A simple routine works better than a complicated one.
- Start with a short list. Pick ten to twenty tickers you already follow. Flow is far easier to read when you know a stock’s normal behavior.
- Filter for size and aggression together. Look for trades that are large for that contract and filled at the ask (bullish if calls, bearish if puts) or at the bid (the reverse).
- Check volume against open interest. If today’s volume in the contract is well above yesterday’s open interest, new positions are likely.
- Look for repetition. One print is an anecdote. The same strike and expiration bought again and again across the session, or over several days, is a pattern.
- Confirm the next morning. When open interest updates, see whether the contract’s open interest rose by roughly the size you saw. If it did, the position is still on.
- Put it next to the chart and the calendar. Flow into an earnings date, an FDA decision or a product event means something different from flow on a quiet week.
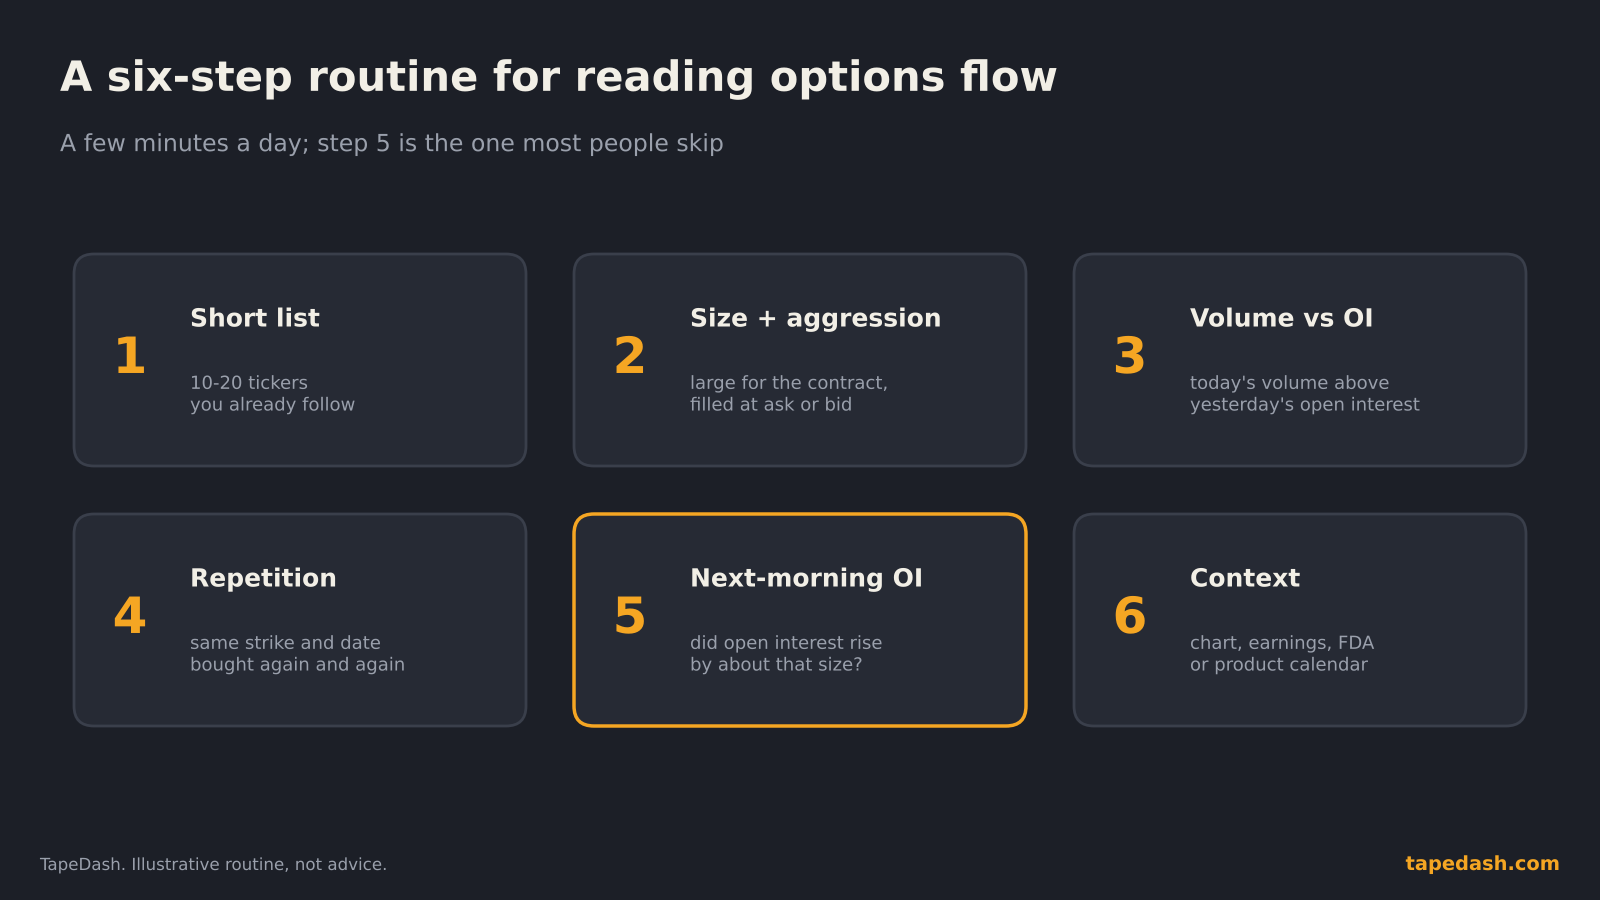
A routine you can run in a few minutes a day. Step five is the one most people skip.
When you’re ready for the finer points, such as telling a sweep from a block or sizing a print by delta rather than premium, the how to read options flow guide goes through each with examples.
Frequently asked questions about options flow
Is options flow the same as unusual options activity?
Not quite. Options flow is every trade. Unusual options activity is the filtered subset that stands out by size, aggression, timing or strike. Most people who say “flow” mean the filtered version.
Is options flow data delayed?
The consolidated OPRA feed is real time. Some free sources show it with a delay, and open interest, which you need to confirm whether trades opened or closed, only updates once a day before the open.
Can options flow tell me who placed a trade?
No. Trades are anonymous. You can infer a lot from size, timing and structure, but no public feed tells you whether the buyer was a hedge fund, a market maker or an individual.
How we track options flow at TapeDash
If you want to watch this yourself, here’s what we built around it. Flow Signals and Large Prints apply the filters above (size relative to the contract, aggression, sweeps, timing) and grade each trade on what happened next, so you can see which kinds of prints have mattered and which haven’t. Hottest Chains shows the most-traded contracts with volume against open interest and which side filled, and OI Changes does step five for you every morning: it lists the contracts whose open interest grew or shrank the most overnight and labels each one as opened and bought, opened and sold, or closed out.
For the sentiment view, Options Pulse scores each stock and sector on whether today’s opening trades lean toward buying calls or buying puts, which is the same opening-trade idea the academic research is built on. Every tool explains its numbers in plain English, and you can see all of them in Every TapeDash tool, explained, or try the layout in the Terminal Preview.
The one idea to remember
Options flow is evidence about what people with money are doing, delivered faster and more specifically than a price chart can. Treat it the way a good analyst treats any single data point: interesting on its own, useful only once it’s confirmed by open interest, repeated, and read in the context of the stock, the calendar and your own plan.
See it on the tape, not just in the headlines
TapeDash is a market research and data analytics platform for traders and investors: live options flow, dealer positioning, a real-time market scanner, stock ratings, and macro and earnings data in one terminal. Memberships open Black Friday, November 27, and the first 200 members lock Pro at $69.99 a month on their account, even if they cancel and come back later.
Join the waitlistClick through the terminalSee the track recordSources
- OCC: 2025 annual report, a message from leadership
- Cboe: The state of the options industry, 2025
- FOW: US options volume grows a quarter in 2025 to new record
- SEC Division of Trading and Markets: Roundtable on options market structure, supporting data (April 9, 2026)
- Pan and Poteshman: The information in option volume for future stock prices (NBER working paper 10925)
- Pan and Poteshman, Review of Financial Studies 2006 (RePEc)
- Options Industry Council: Open interest, why it matters
- Exegy: What is the Options Price Reporting Authority (OPRA)
- Options Price Reporting Authority (Wikipedia)
This article is for educational and informational purposes only. It is not financial, investment, medical or legal advice, and it is not a recommendation to buy or sell any security. Figures come from the sources listed and were checked on the date of publication; markets change quickly. Options trading involves substantial risk of loss.