Dark Pool Prints Explained: What Big Off-Exchange Trades Mean
Dark pool prints explained: how off-exchange trades get reported, what a big print can and can't tell you, which prints to ignore, and how traders use them as levels.
A stock is drifting through a quiet afternoon when a single trade for a few million shares appears on the tape, printed at a price that is not on any exchange’s order book. A few minutes later it is all over social media as a “dark pool print,” usually with a confident caption about institutions loading up. The print is real. What it means is a much harder question.
A dark pool print is the public record of a trade that was executed off exchange, in a venue that did not show the order before it traded. In the US, those trades are reported to FINRA and show up on the consolidated tape within seconds, but without the buyer, the seller, or even the name of the venue. That is why dark pool prints are useful as levels (prices where very large size changed hands) and much weaker as signals of direction.
This guide explains what dark pools are, how their trades get reported, how much of the market now trades this way, which prints to throw out, and the process we use when we put large off-exchange prints on a chart.
- Dark pools are trading systems that match orders without publicly displaying them first. Their trades are reported to a FINRA facility and appear on the tape afterward.
- About half of US stock volume traded off exchange in 2025, but most of that is wholesalers and other principal trading, not classic dark pools.
- A print shows price, size and time. It does not show who bought, who sold, which venue, or whether it was part of a larger order.
- Filter before you read. Late reports, prior-reference-price trades and average-price trades can print far from the live market and carry little information.
- Use big prints as reference levels, confirmed by price, rather than as buy or sell signals.
What is a dark pool?
The SEC’s investor education site defines alternative trading systems as SEC-regulated electronic systems that match orders for buyers and sellers, and notes they are not registered as exchanges (Investor.gov). A dark pool is an ATS that does not publish the size and price of the orders resting in it. Participants can place large orders without advertising them to the rest of the market.
Why would anyone want that? Because size moves prices. If a pension fund shows a bid for two million shares on a lit exchange, every fast trader in the market sees it and steps in front. Corporate Finance Institute sums up the motive well: large orders can move prices on their own, and keeping them hidden helps prevent other traders from front-running them. Dark pools let big buyers and sellers find each other with less information leakage.
They are not unregulated. Dark pools that trade exchange-listed stocks must file Form ATS-N with the SEC, which publicly discloses how the system operates and what the broker-dealer running it does around it (SEC). Dark refers to the order book before the trade, not to the trade itself.
How much stock trading happens off exchange
More than most people assume. In 2025, slightly more than half of all US stock volume traded somewhere other than an exchange. Cboe’s 2025 U.S. Equities Year in Review put the off-exchange share at 50.6% of total consolidated volume, and Rosenblatt Securities reported the same figure, 50.61%, calling it a record. Bloomberg captured the trend early in 2025 with a headline about Wall Street entering a darker age.
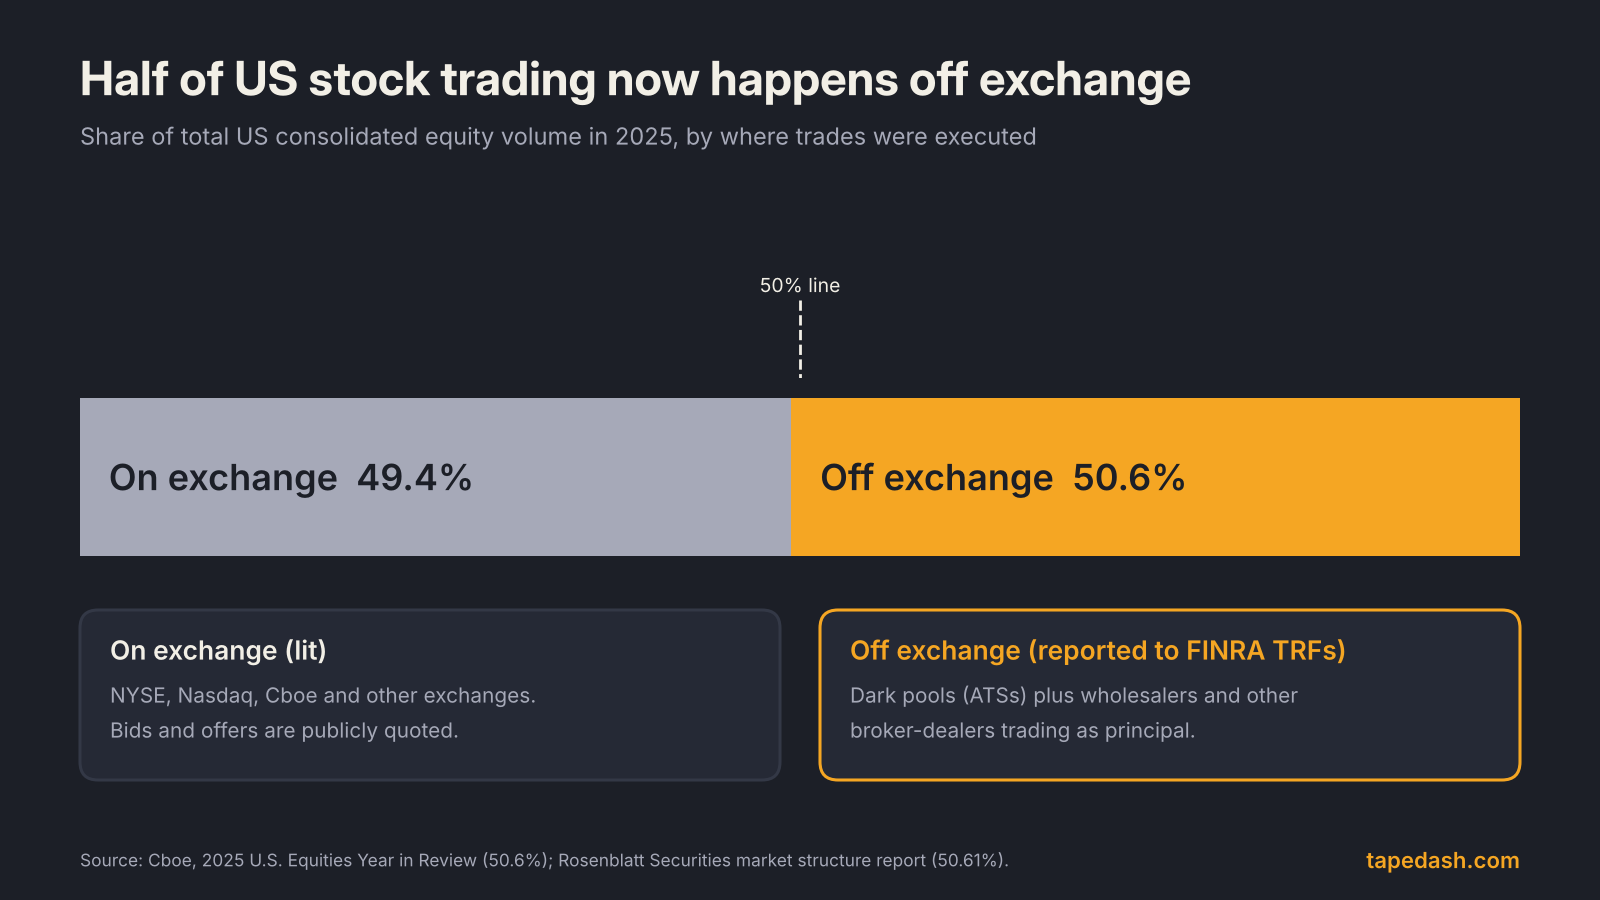
The detail that matters for reading prints: “off exchange” and “dark pool” are not the same thing. The off-exchange bucket includes dark pools, but a much bigger slice comes from wholesalers and other broker-dealers trading as principal, a lot of it retail orders filled by market-making firms. Cboe’s breakdown shows the large majority of off-exchange volume going through principal dealers rather than ATSs. So when a flow tool labels every off-exchange trade a “dark pool print,” it is using the term loosely. Some of those prints are institutions crossing blocks in a dark pool. Many more are retail orders or dealer trades.
How dark pool prints get reported
Here is the path a large order typically takes. An institution hands it to a broker, whose algorithm slices it into pieces and routes them across lit exchanges, dark pools and sometimes principal desks. Pieces that fill on an exchange are reported by that exchange. Pieces that fill off exchange must be reported to a FINRA Trade Reporting Facility, and that is where a “dark pool print” comes from.
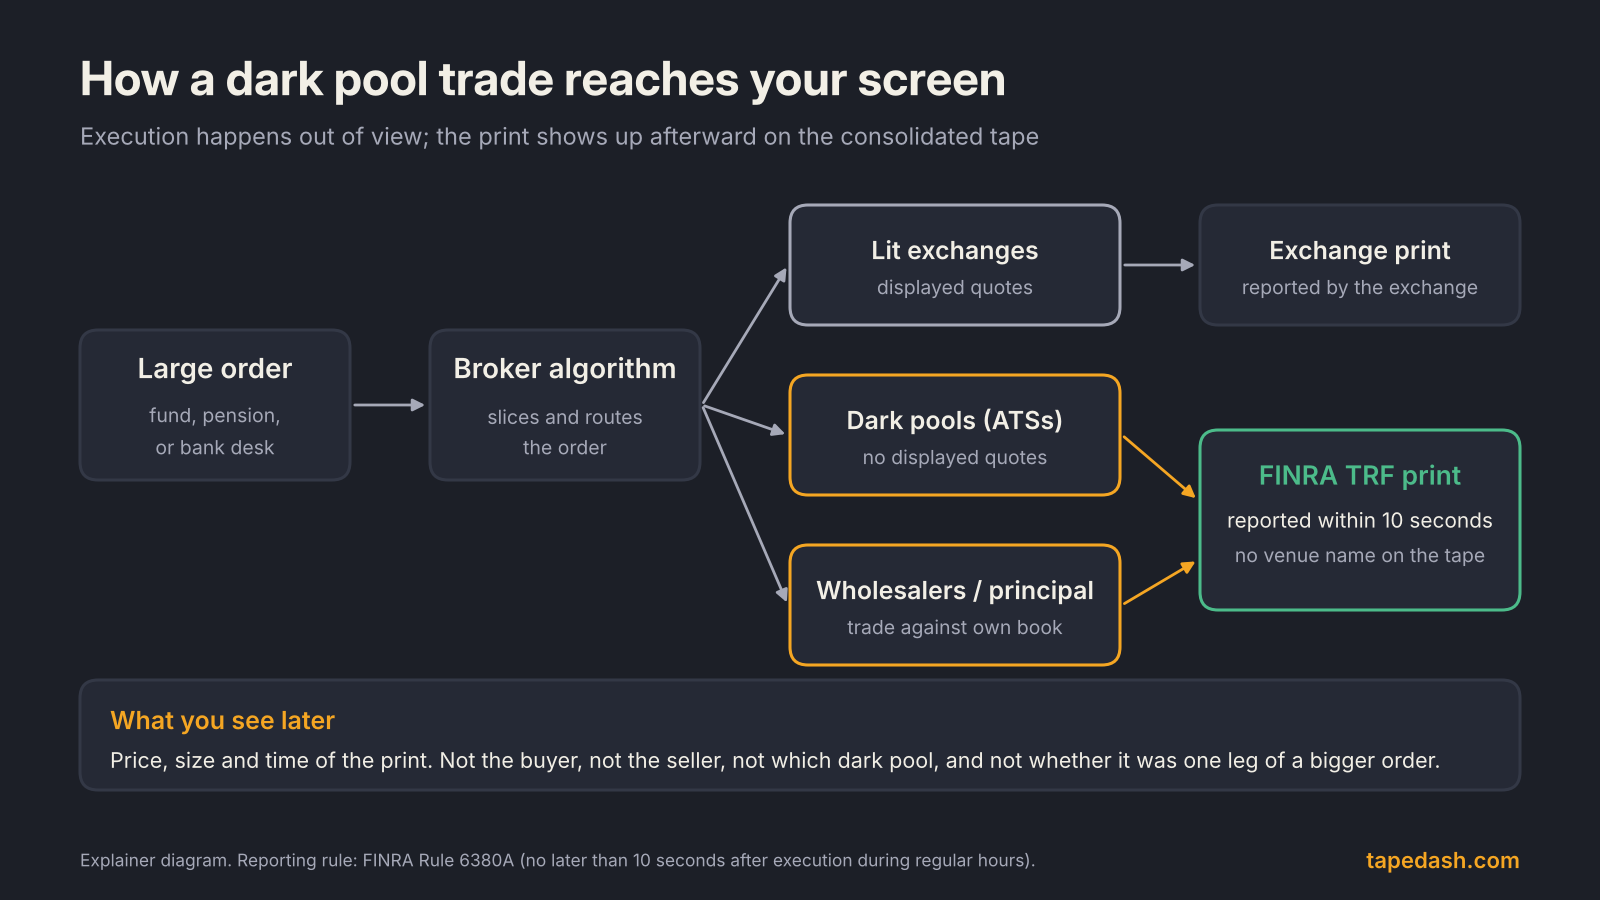
The timing rule is strict. FINRA Rule 6380A requires covered trades to be reported “as soon as practicable but no later than 10 seconds after execution” during normal hours, and a TRF reference guide from Pineify describes the same 10-second standard. So the print itself is close to real time.
What you do not get is just as important. The same Pineify guide makes the point that a TRF print can reflect ATS or non-ATS broker-dealer activity, so the tape alone cannot tell you whether a given print came from a dark pool or a wholesaler. You also do not see whether the buyer or seller initiated, and you do not see the rest of the order. A 500,000-share print might be the entire trade or one slice of a ten-million-share program that will take a week.
What dark pool prints can and can’t tell you
Start with the limits, because that is where most bad reads come from.
A print has no direction. Every trade has a buyer and a seller. On a lit exchange you can at least infer who was more aggressive by whether the trade hit the bid or lifted the offer. Many dark pool trades are crossed at or near the midpoint of the quote, which makes that inference weak or impossible. A huge print is not “institutional buying” any more than it is institutional selling.
A print has no context. You cannot see whether it closes an old position, opens a new one, is the hedge leg of something else, or is a fund rebalancing an index weight it was required to hold.
A print is not always current. Some trades are legitimately reported with special conditions that let them print away from the live market. More on those below.
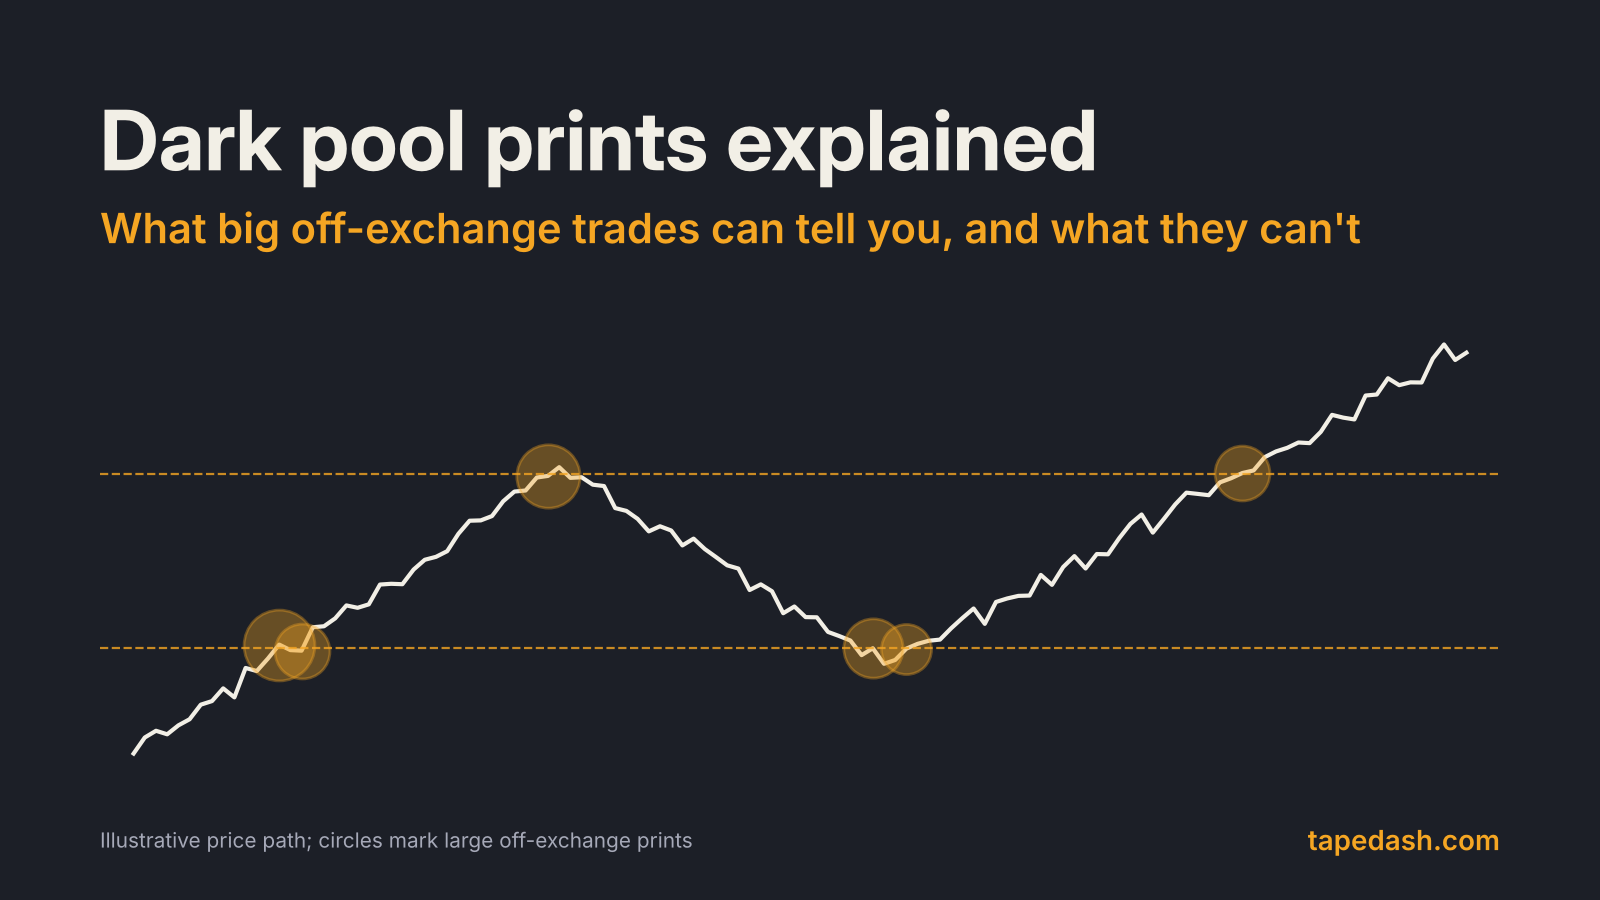
What a print can tell you is where very large size was willing to trade. If several big prints cluster at the same price over days or weeks, that price represents a lot of positioning. Traders who were part of that volume tend to defend it, add to it, or exit near it, and other traders watch it for the same reason. That is the honest use case: dark pool prints as a map of where meaningful money changed hands, not a forecast of where it is going.
Which dark pool prints to ignore
FINRA requires modifiers on several kinds of trades that can print far from the current market. Rule 6380A calls for them on trades reported more than 10 seconds late, on trades whose price is based on a prior reference point in time, and on trades priced by an average-weighting or other special formula. Each of those can look like a giant, out-of-place print to a scanner that does not filter them.
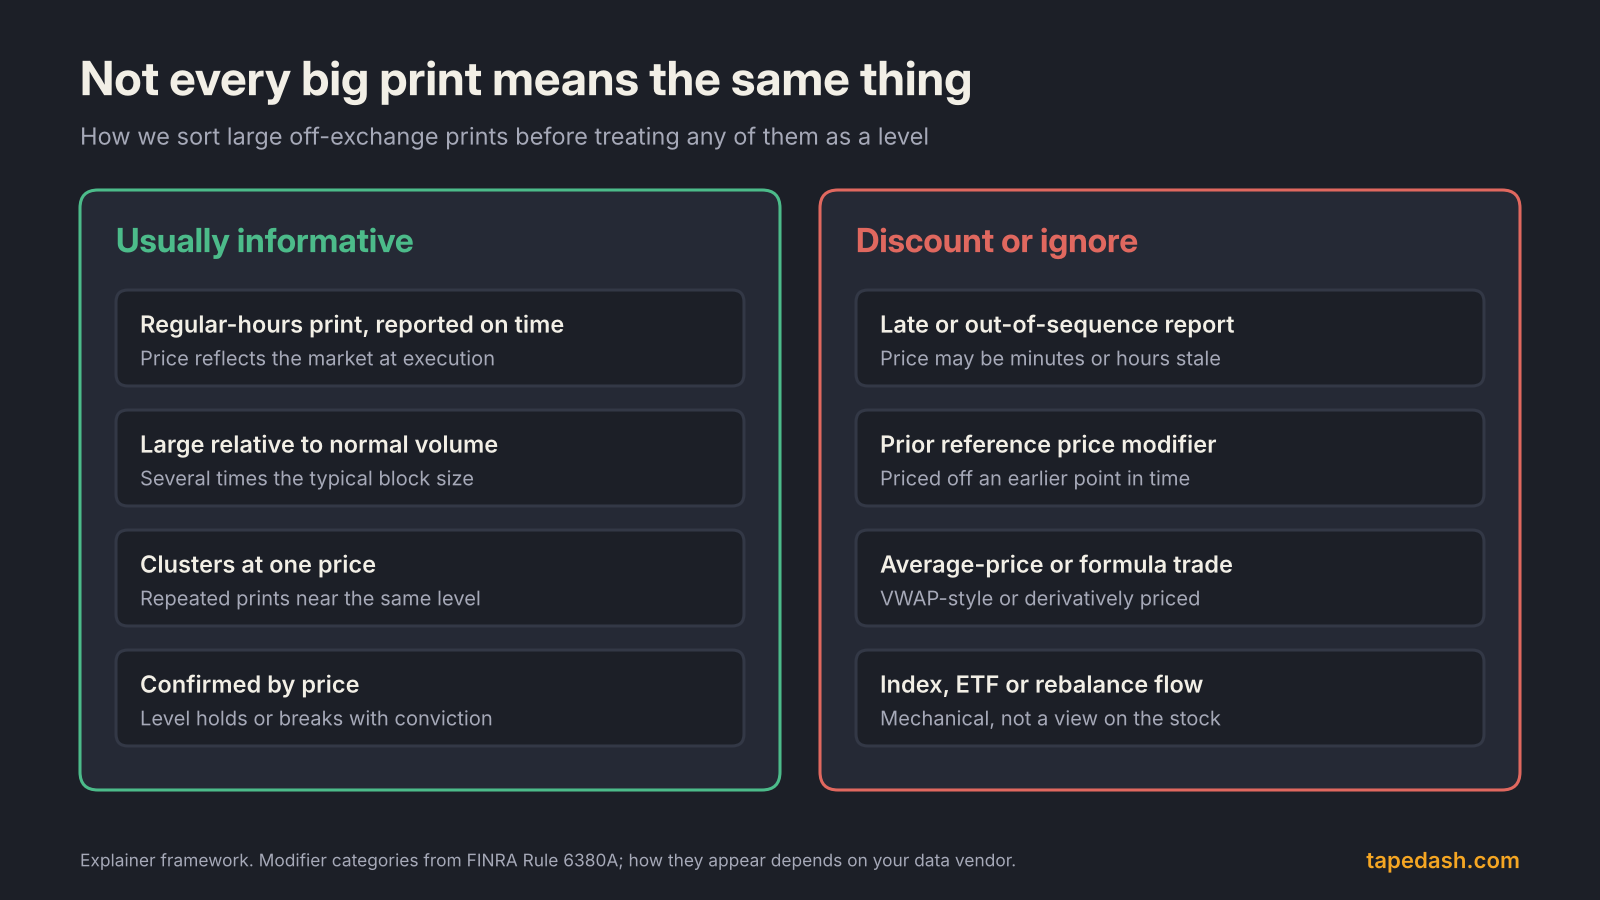
In practice, three filters remove most of the noise:
- Drop late and out-of-sequence prints. A trade agreed hours ago and reported now tells you about the price hours ago.
- Drop prior-reference and average-price trades. A VWAP-style fill or a trade pegged to an earlier price was not priced by the market at that moment.
- Be wary of rebalance days and ETF flows. Index rebalances and ETF creation activity produce enormous mechanical trades that say nothing about anyone’s view of the stock.
How these show up depends on your data vendor’s condition codes, so learn what your feed marks and how it labels venue types. If a tool does not let you see trade conditions at all, treat its “biggest dark pool prints” list with extra caution.
How to use dark pool prints as levels
This is the process we follow. It is less exciting than “follow the whales,” and it holds up much better.
- Filter the prints. Keep regular-hours prints reported on time. Throw out late, prior-reference and average-price trades.
- Judge size relative to the stock. A print that is a large share of the stock’s normal daily volume matters more than one that just has a big dollar value in a mega-cap.
- Look for clusters, not single prints. Repeated large prints near one price over several sessions mark a level. One print is an anecdote.
- Draw the level and wait for price. The level is a reference. What matters is how price behaves when it returns there: a hold with rising volume says buyers are defending it; a clean break says they are not.
- Combine with other evidence. Options positioning, the broader trend and the market regime all change how much weight a level deserves. Our guides to reading options flow and dealer gamma cover two of the most useful companions.
- Plan the trade around the level, not the print. If you use a print level for an entry, your stop belongs on the other side of it, and your size should assume the level can fail.
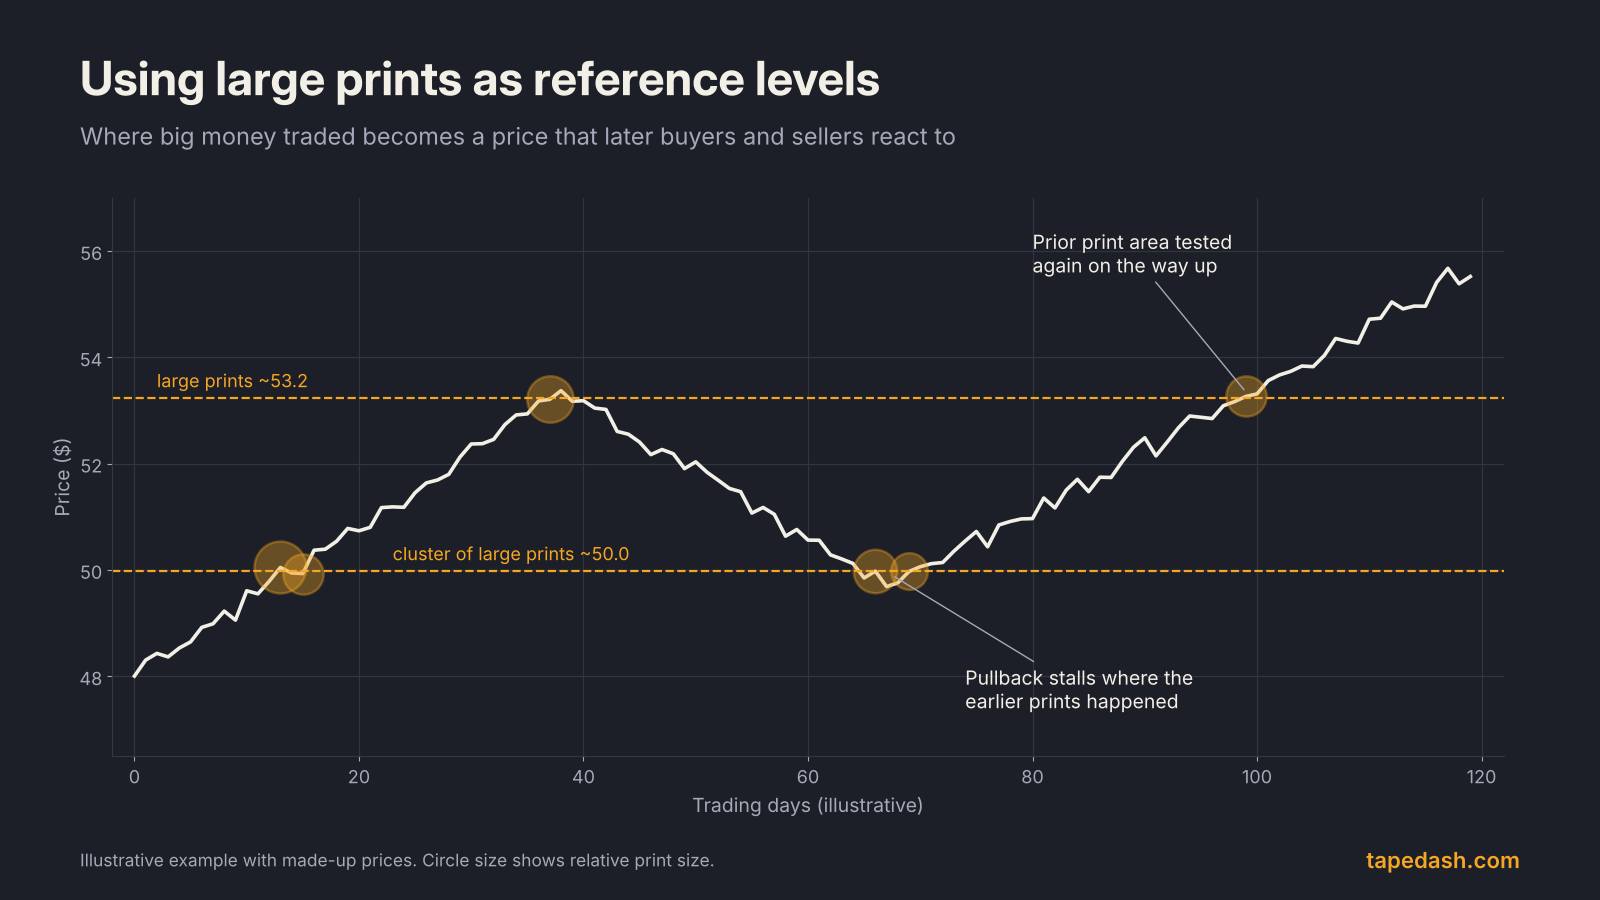
Notice what the chart does not claim. It does not say the prints caused the bounce. It says that a price where a lot of size traded became a reference point, and price behavior there gave traders something concrete to act on and to define risk around.
Reading FINRA’s delayed dark pool data
Individual prints come out within seconds, but the venue-level picture arrives much later. FINRA publishes weekly ATS volume by security and by venue on a delay: two weeks for Tier 1 NMS stocks (broadly, S&P 500 and Russell 1000 members plus some exchange-traded products) and four weeks for Tier 2 stocks and OTC equity securities, according to FINRA’s Regulatory Notice 19-29 and Advisor.ca’s report on the data’s launch.
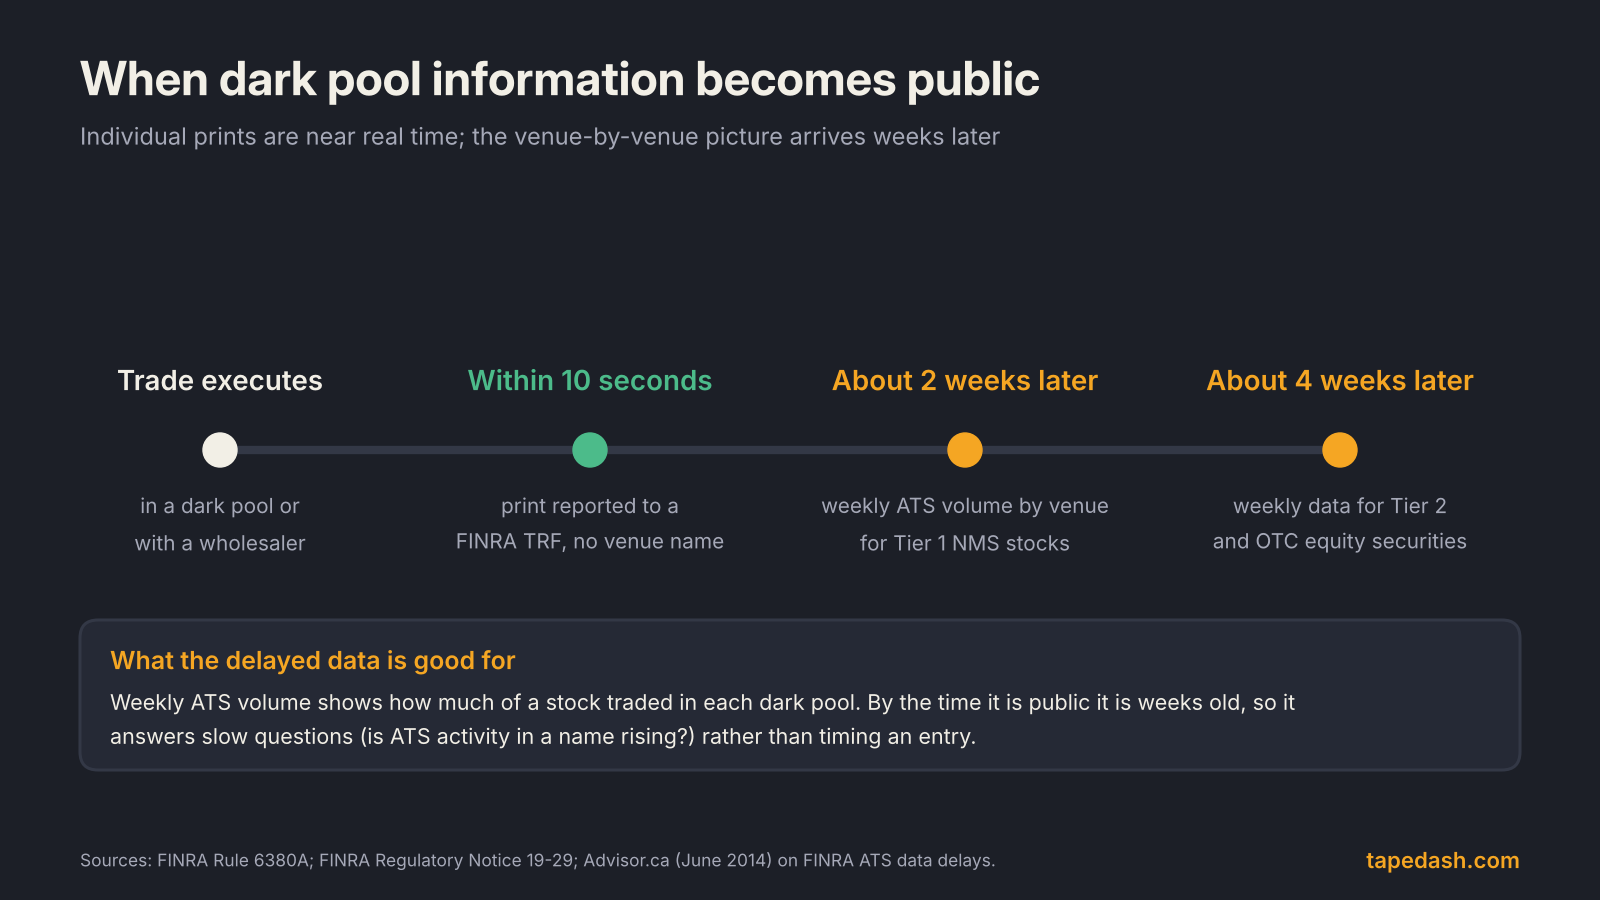
For traders, that lag makes the weekly data a tool for slow questions, such as whether ATS activity in a name has been rising for a month, rather than for timing an entry.
Lit exchanges, dark pools and wholesalers compared
| Lit exchange | Dark pool (ATS) | Wholesaler or principal dealer | |
|---|---|---|---|
| Orders shown before trading | Yes, quotes are displayed | No | No |
| Who typically trades there | Everyone | Institutions, brokers, algorithms | Mostly retail order flow |
| How the trade is reported | By the exchange | To a FINRA TRF within 10 seconds | To a FINRA TRF within 10 seconds |
| Venue named on the tape | Yes, the exchange | No | No |
| Typical trade size | Small slices | Small slices plus occasional blocks | Mostly small retail-size orders |
| What a big print can tell you | Aggressor side is easier to infer | Where large size crossed, usually not the direction | Rarely informative one print at a time |
Frequently asked questions about dark pool prints
Are dark pool prints bullish?
Not by themselves. Every print has a buyer and a seller, and the tape does not tell you which side initiated. A large print near a stock’s lows can be a buyer accumulating or a holder exiting into available liquidity. The level becomes meaningful only when later price action shows which side is defending it.
Why do dark pool prints sometimes show a price far from the market?
Usually because of how the trade was priced or reported. Trades reported late, trades priced off an earlier reference time, and average-price or formula trades can all print away from the live quote. Filter those out before you draw any levels.
Are dark pools legal?
Yes. They are regulated trading systems operated by registered broker-dealers. Those trading exchange-listed stocks file public Form ATS-N disclosures with the SEC, and their trades must be reported to FINRA within seconds. “Dark” describes the hidden order book, not a lack of oversight.
How we track dark pool activity at TapeDash
If you want to follow large off-exchange prints without doing the filtering by hand, start with the Dark Pool page in TapeDash, then pair it with the Accumulation Tracker to see whether big prints in a name are recurring over weeks rather than showing up once. Large Prints keeps the session’s biggest options trades alongside, so you can see whether stock and options positioning point the same way.
You can explore the layout in the free Terminal Preview with no account, or join the TapeDash waitlist and free daily. When we open the doors, the first 200 members lock Pro at $99 a month for as long as they stay.
The one idea to remember
A dark pool print tells you where size traded, not which way it was leaning. Filter out the stale and formula-priced prints, look for clusters rather than single trades, and let price action at those levels tell you who is in control.
See it on the tape, not just in the headlines
TapeDash is the research desk for traders and investors: live options flow, dealer positioning, a real-time market scanner and trade alerts graded in public. Memberships open January 1, 2027, and the first 200 members lock Pro at $99 a month for as long as they stay.
Join the waitlistClick through the terminalSee the track recordSources
- Investor.gov (SEC): Alternative Trading Systems (ATSs) glossary entry
- SEC: Regulation of NMS Stock Alternative Trading Systems (Form ATS-N)
- FINRA Rule 6380A: Transaction reporting
- FINRA Regulatory Notice 19-29
- Advisor.ca: FINRA makes dark-pool data public
- Cboe: 2025 U.S. Equities Year in Review
- Rosenblatt Securities: Let There Be Light, US edition market structure report
- Bloomberg Law: Wall Street enters darker age with most stock trading now hidden
- Corporate Finance Institute: Dark pool
- Pineify: Trade Reporting Facility guide
This article is for educational and informational purposes only. It is not financial, investment, medical or legal advice, and it is not a recommendation to buy or sell any security. Figures come from the sources listed and were checked on the date of publication; markets change quickly. Options trading involves substantial risk of loss.