How to Read Options Flow: Real Bets vs Hedges
How to read options flow without getting fooled: sweeps, blocks, bid vs ask, volume vs open interest, and a simple checklist for telling real bets from hedges.
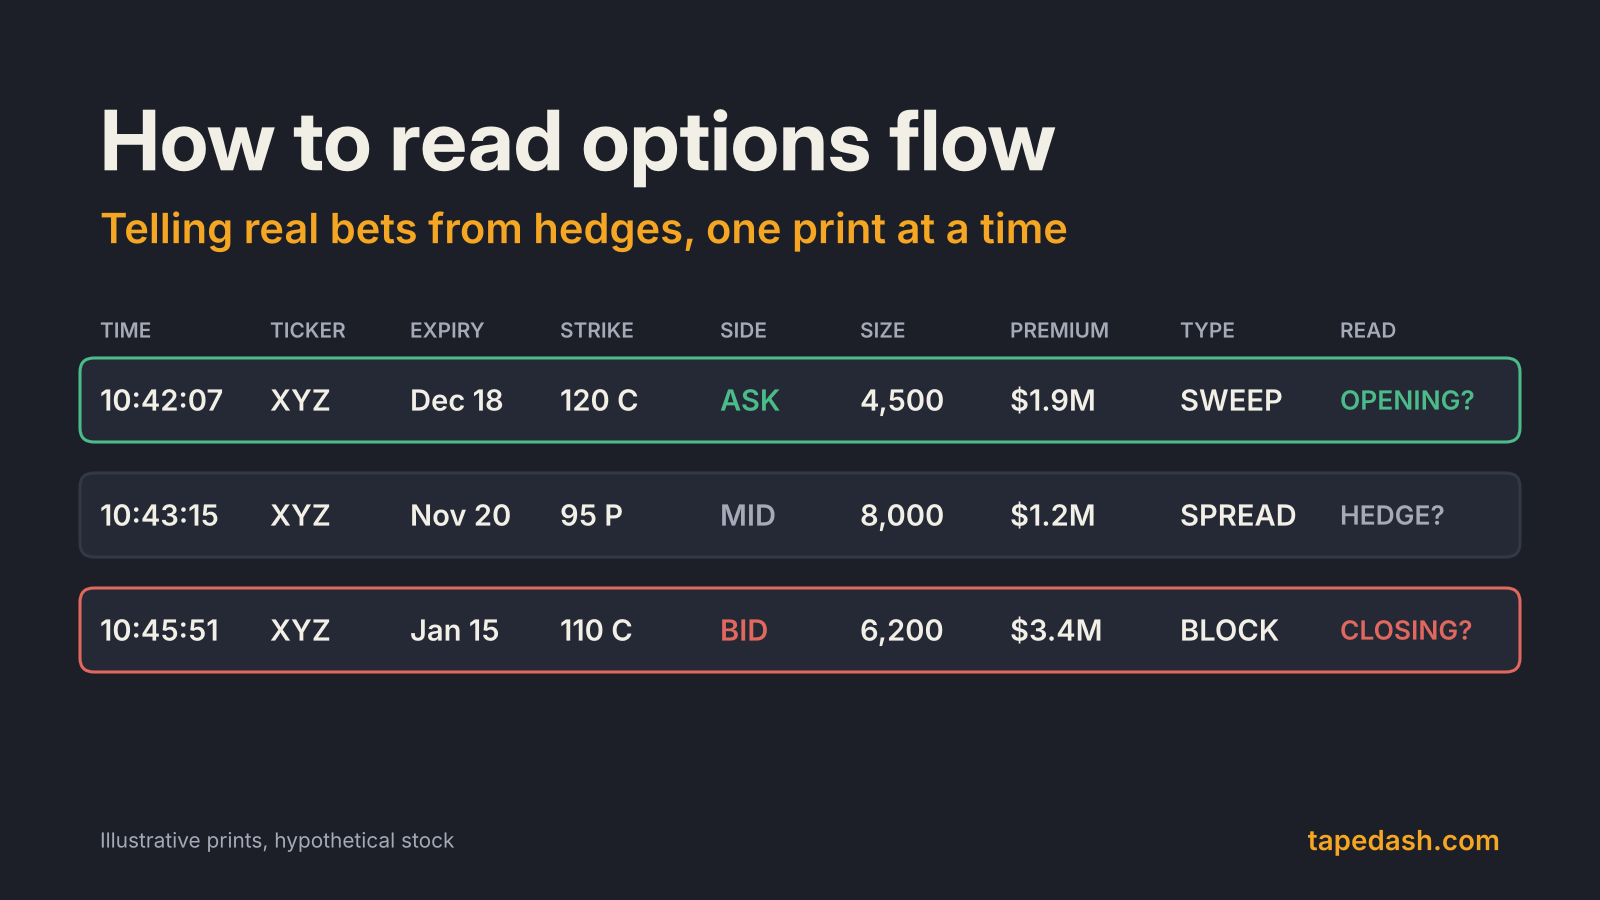
A $2 million call sweep hits a flow scanner, the screenshot spreads, and within minutes a lot of people are convinced someone knows something. Sometimes they do. Far more often, that print is a hedge, a roll, one leg of a spread, or a fund closing a position it opened weeks ago. The trade is real. The story attached to it usually is not.
Reading options flow well comes down to one skill: separating new, directional bets from everything else. You do it by asking a short list of questions about each print. Where did it fill against the bid and ask? How big is it next to the open interest already there? Is it a single leg or part of a structure? Does it make sense as protection for a stock position? And did open interest actually rise the next morning?
The noise problem keeps getting bigger. OCC, which clears US listed options, reported that cleared volume rose about 24% in 2025 from the year before, a jump FOW also reported. More contracts means more big-looking prints, and most of them mean less than they appear to. This guide walks through how we read the tape, field by field, and the checklist we use before we take any print seriously.
- Options flow is the stream of individual options trades. It shows what traded, not why, and most large prints are not fresh directional bets.
- Side matters most. A trade at the ask suggests a buyer; one at the bid suggests a seller. Even the best simple rule gets roughly one in six trades wrong.
- Open interest is the confirmation. If a big print was opening, open interest should rise by about that much the next morning.
- Hedges look like bets. Put buying against stock, collars, rolls and spread legs can all show up as huge one-sided prints.
- Size by delta, not premium. The same dollar amount can mean wildly different exposure depending on the strike.
What options flow is, and what it is not
Every options trade on a US exchange is reported to a consolidated feed, and flow tools filter that firehose down to the trades that look interesting: large size, large premium, unusual strikes, or urgency. What you see on a flow screen is a list of prints. Each print tells you when something traded, in which contract, at what price, in what size, and under what condition.
What it does not tell you is who traded, whether they were opening or closing, or what else they hold. Those three gaps are where nearly every bad read comes from.
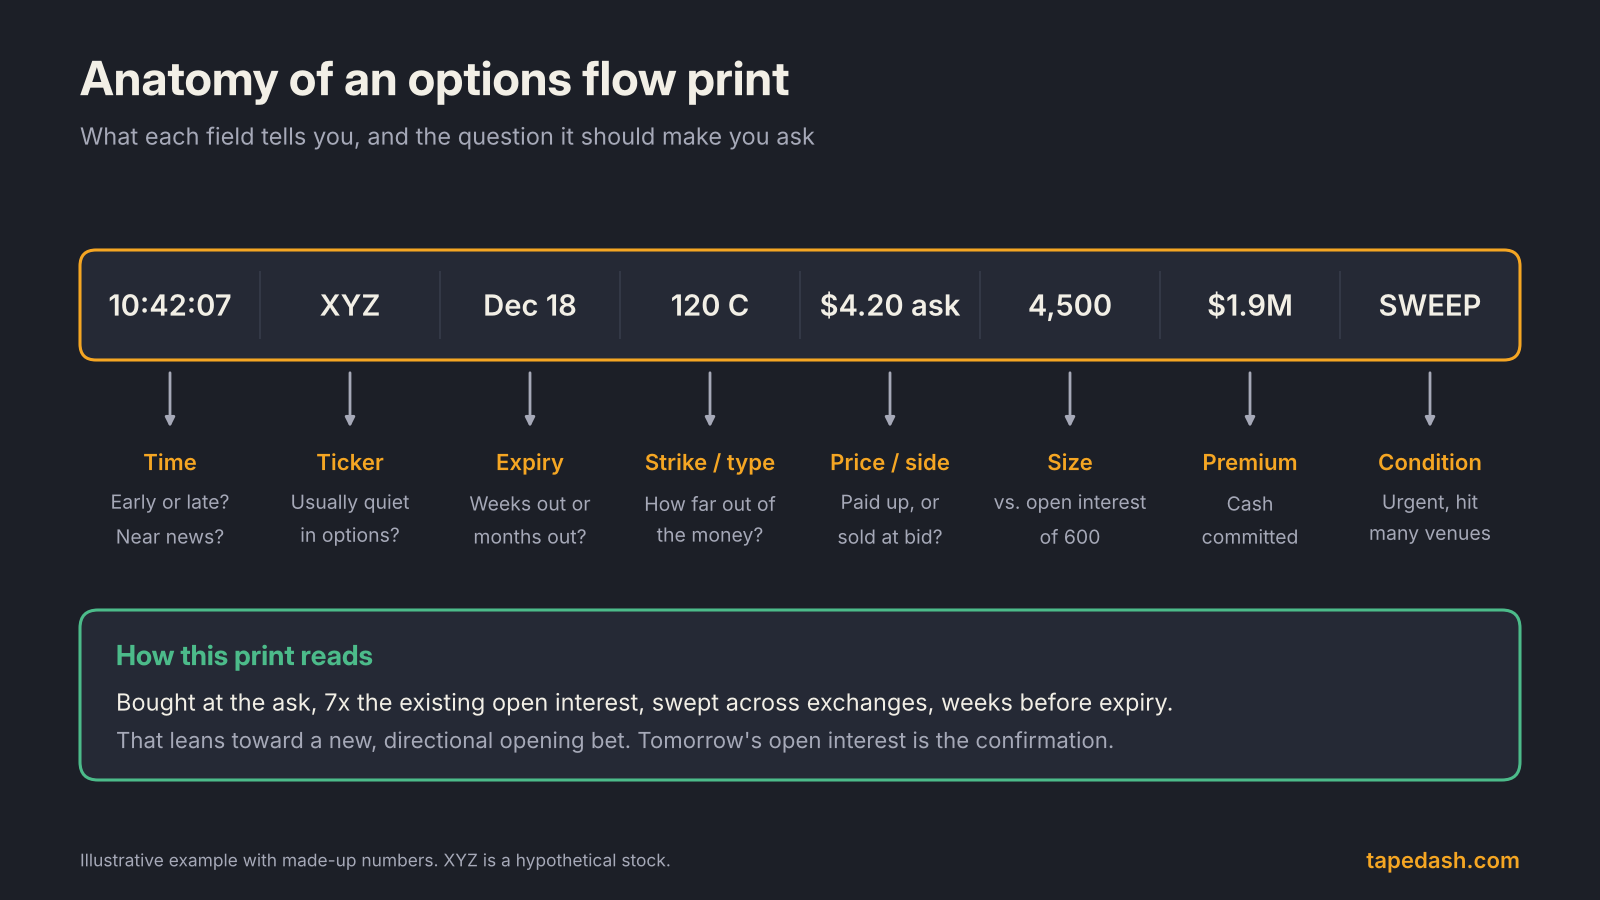
Get in the habit of reading every field, not just the premium. A print that is huge in dollars but sits in a strike with 40,000 contracts of open interest is a very different animal from one that is seven times the existing open interest in a strike nobody has touched.
Sweeps, blocks and splits: reading the trade type
Flow tools tag prints by how they were executed. These tags are useful, but each one has a common misreading.
Sweeps. A sweep is a large order broken into pieces and filled quickly across several exchanges, taking whatever size is available at each venue’s best price. SoFi’s guide describes sweeps as favoring speed over price, which is why traders read them as urgency. Benzinga’s explainer adds the right warning: a sweep does not reveal strategy, and a large buyer may be hedging or taking profits. Urgency tells you someone wanted to get done now. It does not tell you why.
Blocks. A block is a single large trade, often negotiated off-screen and printed in one piece. Blocks frequently come from institutions doing planned business such as overwriting a stock position, rolling a hedge, or putting on a collar. Because they are negotiated, they often print near the middle of the spread, which makes the side harder to read.
Splits and multi-leg trades. Many large prints are one leg of something bigger. A put spread, a risk reversal, a calendar or a roll all print as separate legs. If you only see the leg that crossed your scanner’s filter, you can easily read a hedged structure as an outright bet.
Bought or sold? How to read the side of an options trade
The most important field is the price relative to the bid and ask at the moment of the trade. A fill at or above the ask suggests the initiator was buying and willing to pay up. A fill at or below the bid suggests the initiator was selling. A fill in the middle is ambiguous.
This is called the quote rule, and it is the backbone of every flow tool’s “bought” and “sold” tags. It works reasonably well, with limits worth knowing. A 2003 study by Savickas and Wilson in the Journal of Financial and Quantitative Analysis tested common classification rules against option data where the true direction was known.
The researchers found that even the best of the common methods misclassified a meaningful share of trades, and the simple tick rule did far worse, according to the paper’s abstract as listed on Cambridge Core and RePEc. The trades most often misread were those printed outside the quoted spread and components of complex multi-leg orders. Markets are faster now and the error rates have surely moved, but the lesson holds: a “bought” tag is an inference, not a fact, and it is least reliable on exactly the large, complex trades that get the most attention.
Volume vs open interest: was it opening or closing?
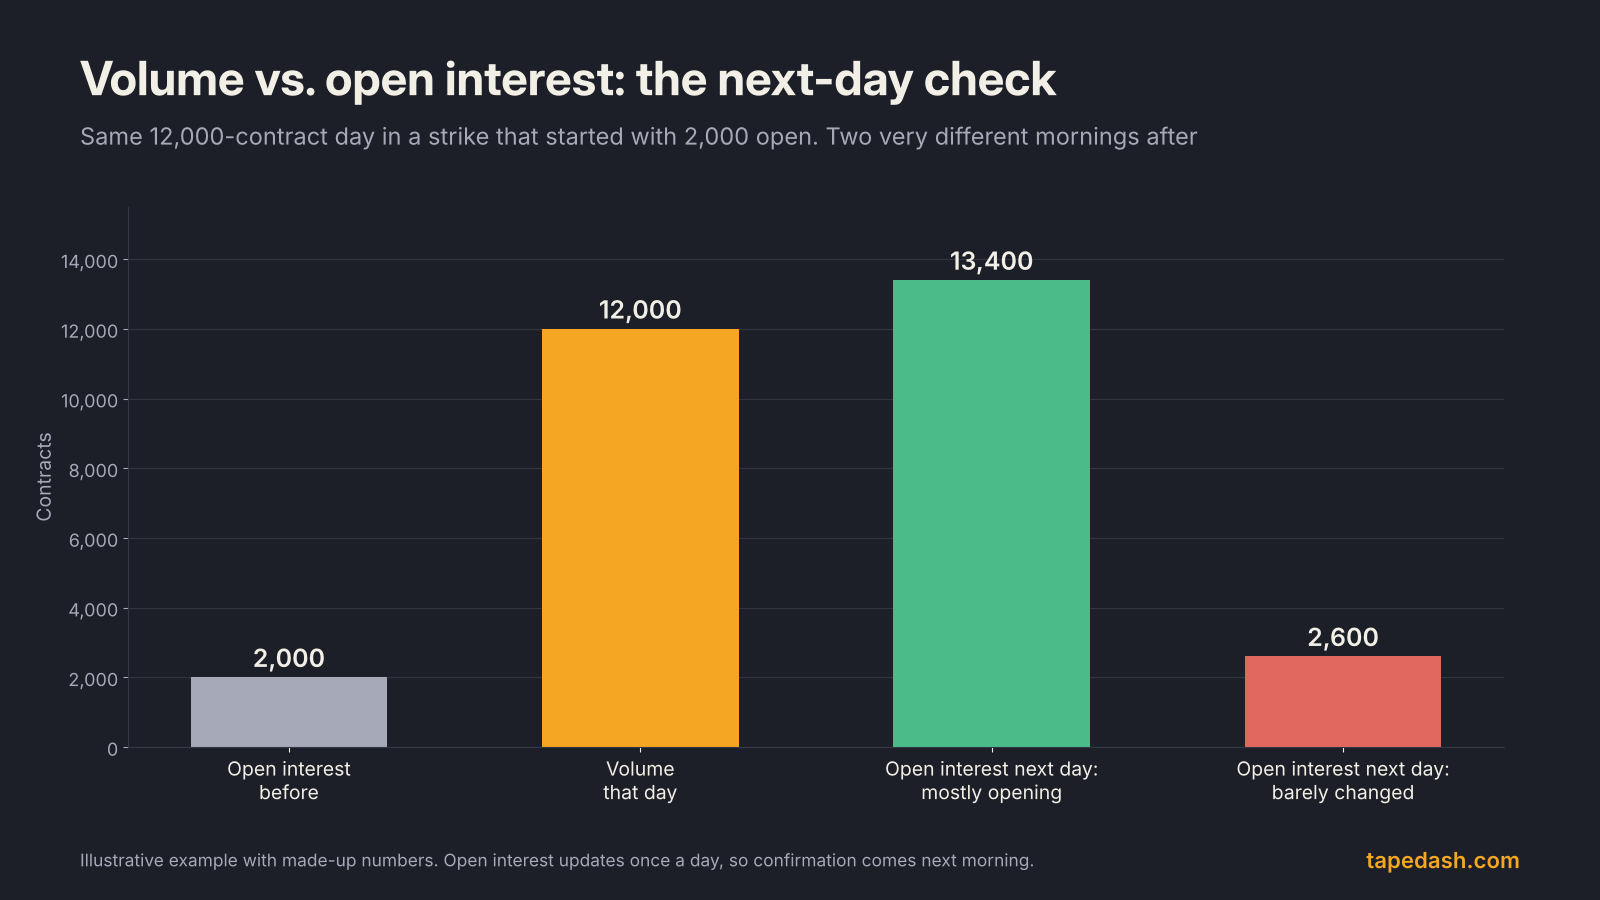
Open interest is the number of contracts still outstanding. The Options Industry Council explains how it moves: it rises when both sides of a trade are opening new positions, falls when both are closing, and stays the same when an existing position simply changes hands.
That gives you a clean test. If today’s volume in a strike is far larger than yesterday’s open interest, at least some of it had to be opening. Then check the next morning. If a 12,000-contract print was mostly new positions, open interest should be up by something close to that amount. If open interest barely moved, the volume was day trading, offsetting, or positions changing hands.
There is a more direct source for professionals. Cboe sells Open-Close data that breaks volume on its exchanges into buys and sells, opening and closing, and by participant type, including customers, professional customers, broker-dealers and market makers. It only covers Cboe’s own venues and costs money, so most retail traders lean on the open interest check. It works, it is free, and it only requires patience until the next morning.
Real bets vs hedges: how to tell the difference
Here is the uncomfortable part. In our experience reading the tape, a large share of the biggest prints are hedges of one kind or another. Big pools of capital own big stock positions, and options are often the cheapest way to manage that risk. That produces flow that looks dramatic and means something much more ordinary.
The most common impostors:
- Protective puts. A fund that owns a large stake buys puts ahead of earnings. On a scanner it looks like a bearish bet. In reality it is insurance on a long position.
- Collars. The same fund buys puts and sells calls to pay for them. If you only see the call leg, it looks like someone dumping calls; if you only see the put leg, it looks like a bearish wager.
- Overwriting. Selling calls against stock to collect income produces large call prints at the bid, month after month.
- Rolls. Closing one expiration and opening another prints two large trades in the same name minutes apart. Neither is new conviction.
- Dealer hedges. Market makers adjust their own risk, sometimes with options, as covered in our guide to dealer gamma.
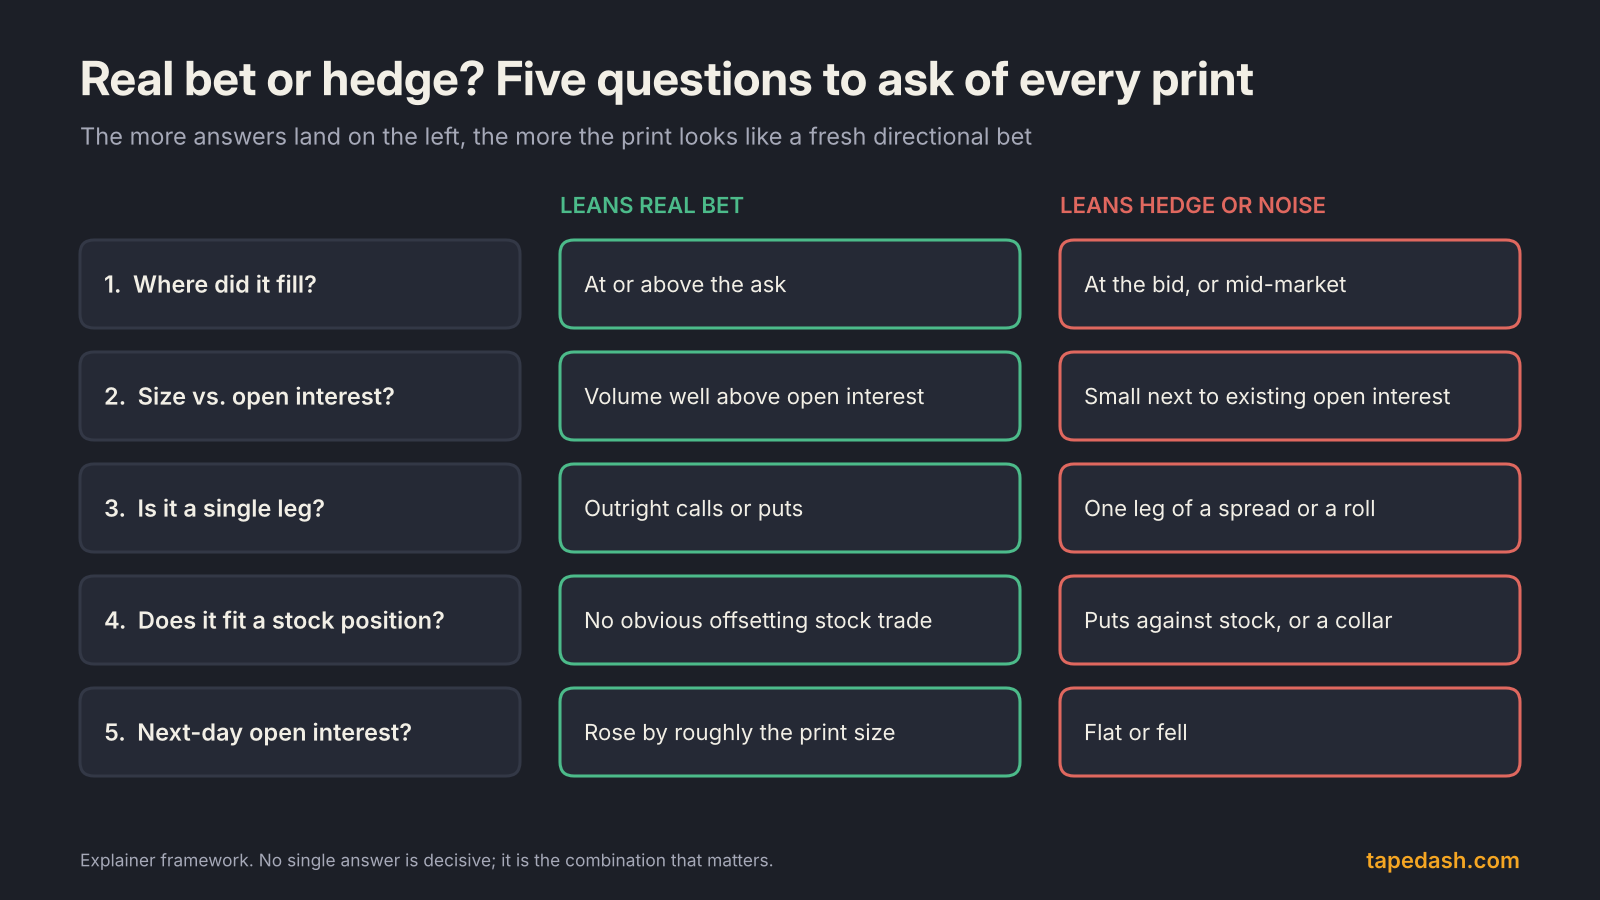
A print that passes the checklist looks like this: bought at or above the ask, single leg, several times the existing open interest, in a strike and expiry that does not obviously pair with a stock hedge, followed by a matching jump in open interest the next day. Those are rarer than flow feeds make them look, which is exactly why they are worth noticing when they show up.
Premium vs delta: sizing what a print really means
Flow screens love to sort by premium, because big dollar figures are eye-catching. But premium alone is a poor measure of how much exposure someone took on.
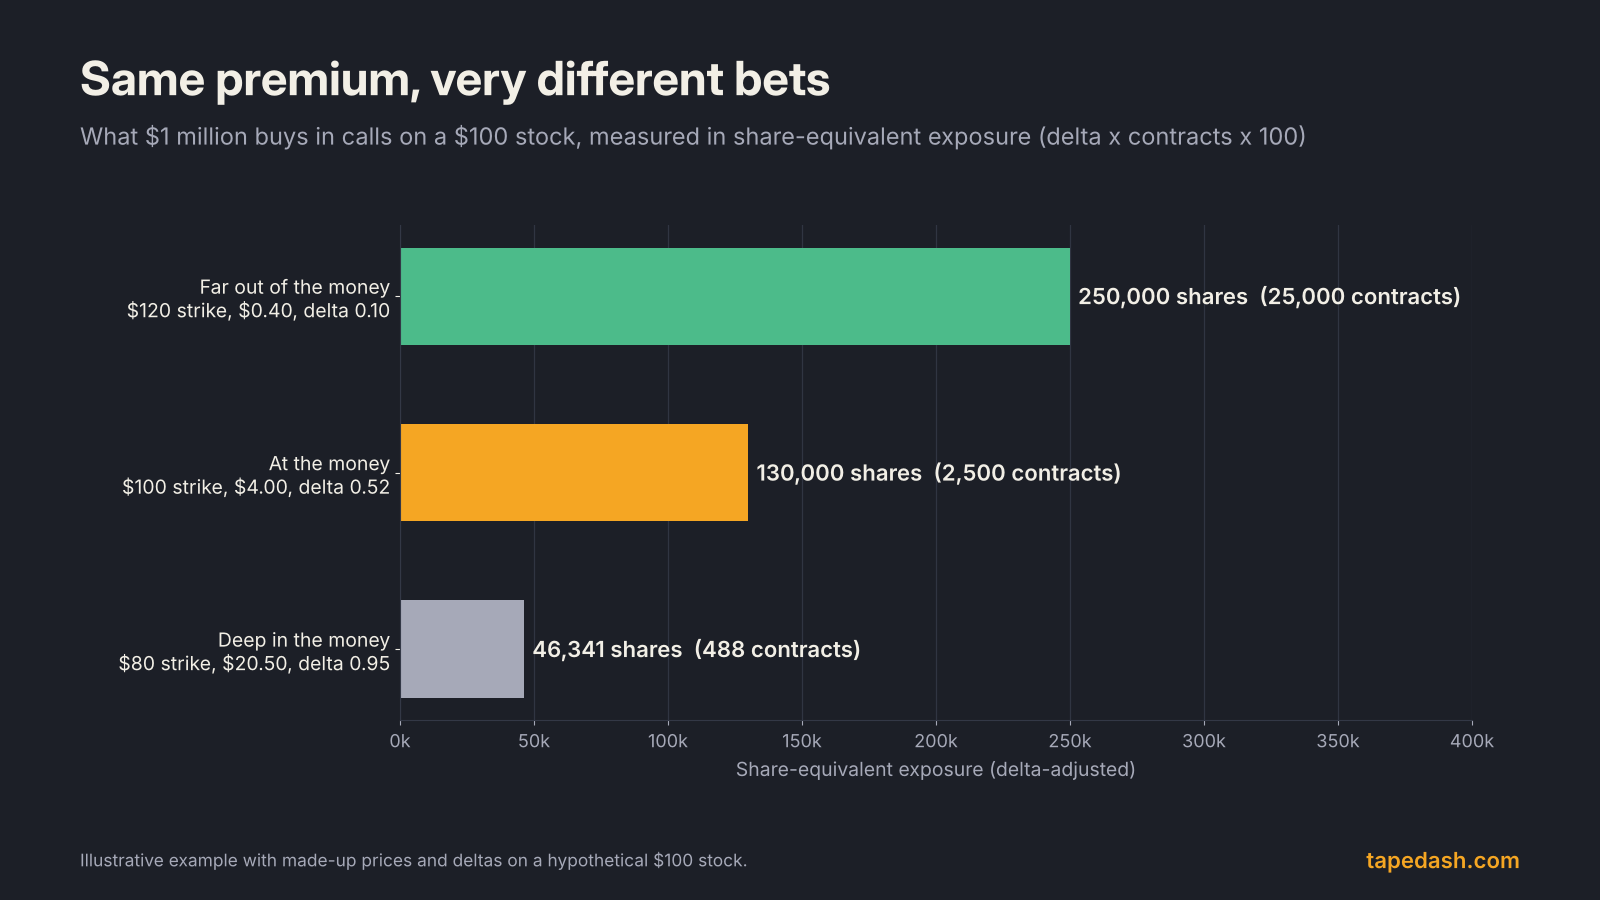
A million dollars of deep in-the-money calls is mostly a stock substitute with a small cushion. The same million in at-the-money calls is a cleaner directional bet with a defined loss. The same million in far out-of-the-money calls is a lottery ticket in size: lots of share-equivalent exposure on paper, but most of it disappears if the move does not come quickly. When we assess a print, we look at delta-adjusted size and at how far the stock must travel by expiration for the trade to pay, not just at the headline premium.
Common options flow patterns and what they usually mean
| Pattern on the tape | Often read as | More likely explanation | What would confirm a real bet |
|---|---|---|---|
| Large call sweep at the ask, short-dated | Aggressive bullish bet | Could be a real bet, or a short covering its calls | Open interest jumps next day; stock confirms |
| Large put block near the mid, weeks out | Bearish bet | Protective hedge on a stock position | Single leg, no matching call sale, OI rises |
| Call block at the bid, monthly expiry | Someone dumping calls | Covered call writing (overwriting) | Hard to confirm; usually income, not direction |
| Two big prints minutes apart, adjacent expiries | Two separate bets | A roll from one expiry to the next | Net open interest change across both strikes |
| Huge out-of-the-money volume before earnings | Insider knowledge | Event speculation or cheap tail hedges | Repeat buying over several days, rising OI |
| Matching put buy and call sale in one print | Bearish puts plus bearish calls | A collar on an existing stock position | Rarely a directional signal at all |
How to use options flow, step by step
This is the process we follow before letting any print influence a decision.
- Filter for relevance first. Ignore prints in strikes with heavy existing open interest unless the size is truly unusual. Focus on prints that are large relative to what is already there.
- Read the side. At or above the ask leans buy. At or below the bid leans sell. Mid-market prints get no directional credit.
- Check the structure. Look for other legs printed within the same second or minute in the same name. If you find them, evaluate the structure, not the leg.
- Ask whether it could be a hedge. Earnings, index events and big holder concentrations all raise the odds that a put buy is protection rather than a bet.
- Size it properly. Translate premium into delta-adjusted exposure and note how far the stock needs to move by expiry.
- Wait for open interest. Check the next morning. No open interest increase, no conviction credit.
- Look for repetition. One print is an anecdote. The same direction, in the same name, across several days with rising open interest is a pattern.
- Let price have the last word. If flow says bullish and the stock keeps making lower lows, the tape wins.
Flow also clusters around the calendar. Monthly options expire on the third Friday, so the next one lands on November 20, according to the MarketXLS and Macroption calendars, and rolls tend to pick up in the days before it. Expect more two-sided noise that week. For what happens to option prices right after an earnings report, see our guide to IV crush.
Frequently asked questions about options flow
Is unusual options activity a reliable signal?
On its own, no. Unusual activity just means volume is large relative to normal, and a big share of that is hedging, rolling and spread trading. It becomes useful when it passes the checks above: bought at the ask, opening, single leg, and repeated with rising open interest.
What is the difference between a sweep and a block?
A sweep is one large order split into pieces and filled quickly across multiple exchanges, which signals urgency. A block is one large trade printed at a single price, often negotiated, which more often reflects planned institutional business such as a hedge or overwrite.
Should I follow “smart money” options trades?
Treat them as a lead to research, not a trade to copy. Even when a print is a real bet, you do not know the trader’s other positions, time horizon or risk limits. Their $2 million position might be a small hedge inside a billion-dollar book. Size your own trade by your own rules, as covered in our guide to options position sizing.
How we read options flow at TapeDash
If you want to put this checklist to work, start with Large Prints and Flow Edge in TapeDash. Large Prints keeps the session’s biggest options trades in one place, which makes it much easier to notice when two prints in the same name are really a roll or the two legs of a collar. Flow Edge is where we look when we want to know whether a name’s flow is building in one direction over several days, which is the repetition test from step 7. Market Tide and DTE Tide add the market-wide view, so a single bullish print gets weighed against what the rest of the tape is doing.
You can explore the layout in the free Terminal Preview, no account needed, or run your own screens in the Live Scanner. For a daily read on the most notable flow, join the free TapeDash Daily.
The one idea to remember
Options flow shows you what traded, not why. Most big prints are hedges, rolls or pieces of larger structures, and the few real bets reveal themselves through the side of the fill, the size relative to open interest, and the open interest change the next morning. Ask the questions before you believe the story.
See it on the tape, not just in the headlines
TapeDash is the research desk for traders and investors: live options flow, dealer positioning, a real-time market scanner and trade alerts graded in public. Memberships open January 1, 2027, and the first 200 members lock Pro at $99 a month for as long as they stay.
Join the waitlistClick through the terminalSee the track recordSources
- OCC: Annual 2025 and December 2025 volume
- FOW: US options volume grows a quarter in 2025 to new record
- Options Industry Council: Open interest, why it matters
- SoFi: Guide to options sweeps
- Benzinga: What are options sweeps
- Cboe DataShop: Open-Close volume data
- Savickas and Wilson: On inferring the direction of option trades (Cambridge Core)
- Savickas and Wilson: On inferring the direction of option trades (RePEc IDEAS)
- MarketXLS: Option expiration calendar 2026
- Macroption: Options expiration calendar
This article is for educational and informational purposes only. It is not financial, investment, medical or legal advice, and it is not a recommendation to buy or sell any security. Figures come from the sources listed and were checked on the date of publication; markets change quickly. Options trading involves substantial risk of loss.