IV Crush: Why Options Lose Value After Earnings
IV crush is the drop in implied volatility after earnings that can sink an option even when you call the direction right. Here is how it works and how to plan for it.
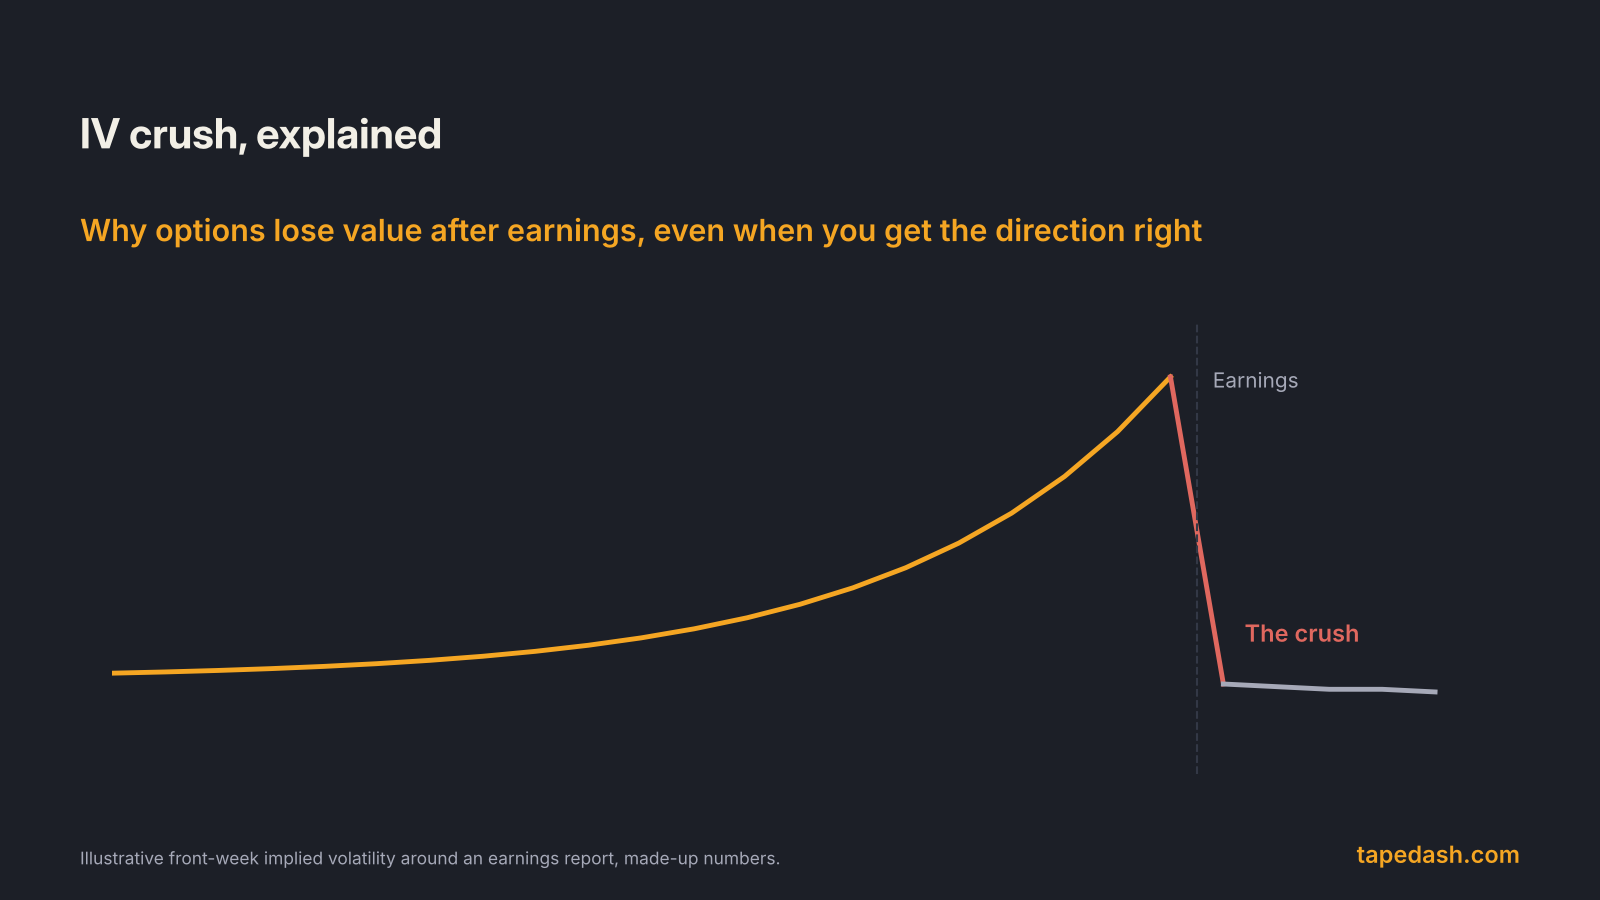
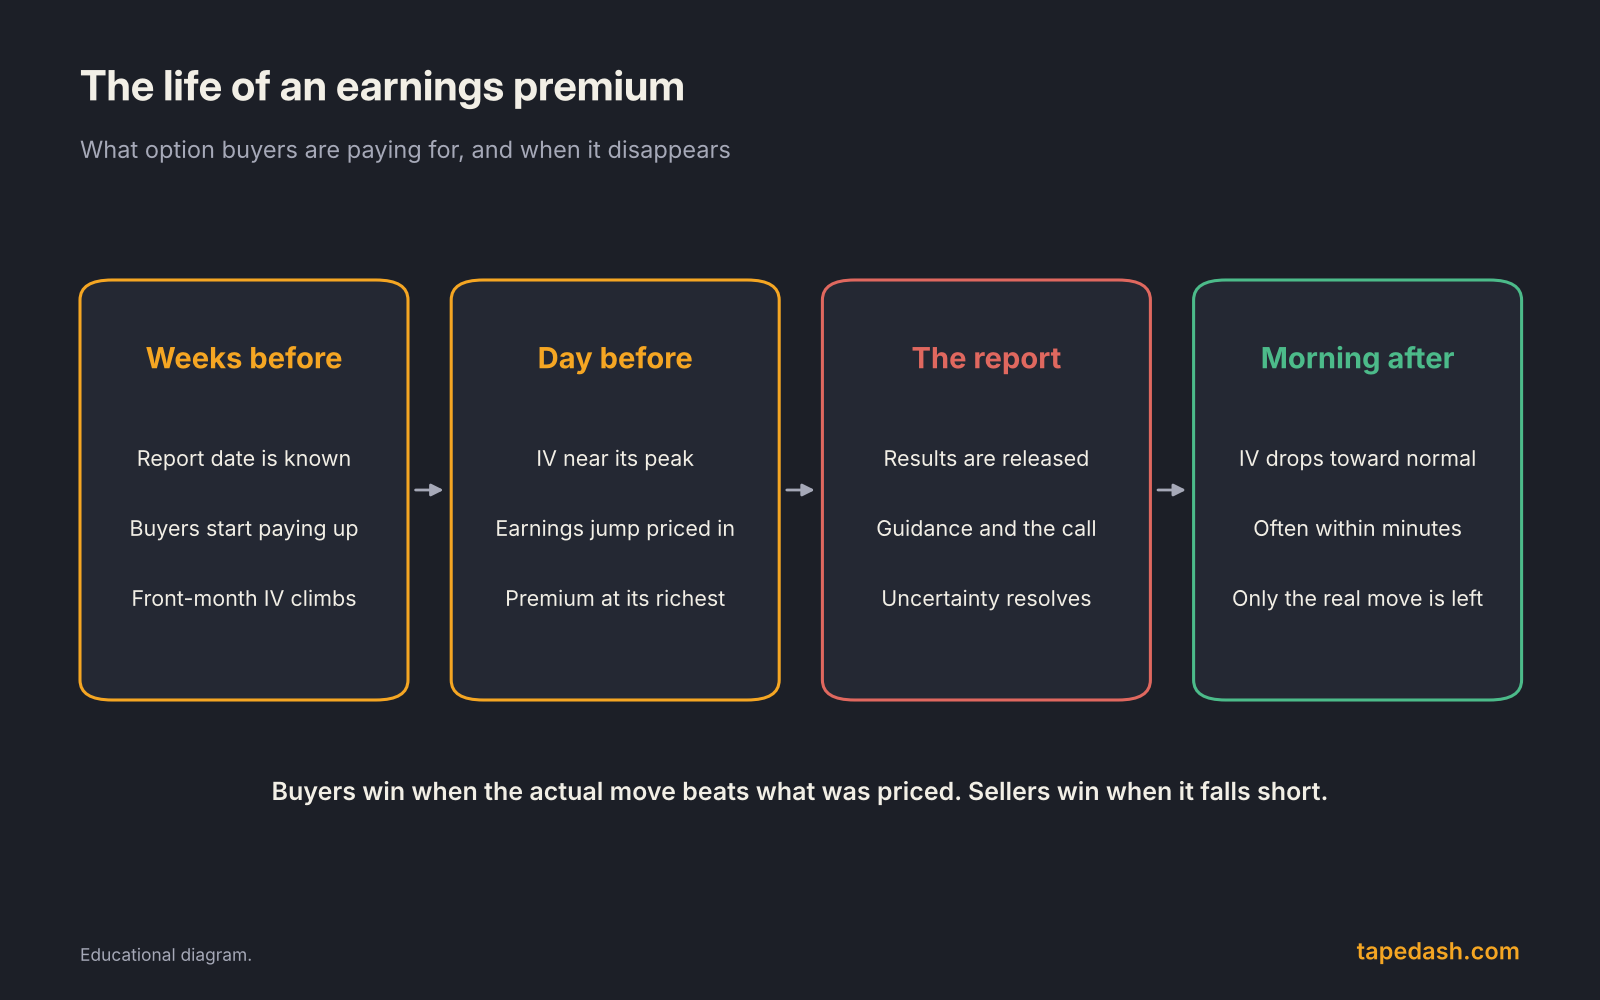
IV crush is the sharp drop in implied volatility that hits options right after a scheduled event, most often an earnings report. Before the report, traders pay extra for options because nobody knows the result. Once the numbers are out, that uncertainty is gone, implied volatility falls, and option prices fall with it. The crush can be large enough that a call loses money even though the stock went up.
That last part is what catches people. You buy calls the day before earnings, the company beats, the stock rises 3%, and the next morning your calls are worth less than you paid. You were right on direction and still lost, because you paid for a bigger move than the one you got.
With earnings season in full swing this time of year, this is one of the most practical concepts an options trader can learn. This guide explains why the crush happens, how to estimate it before you trade, which positions it helps and hurts, and the process we use around every report.
- IV crush is the collapse in implied volatility after uncertainty resolves. Earnings are the most common trigger; drug approvals and central bank decisions can do it too.
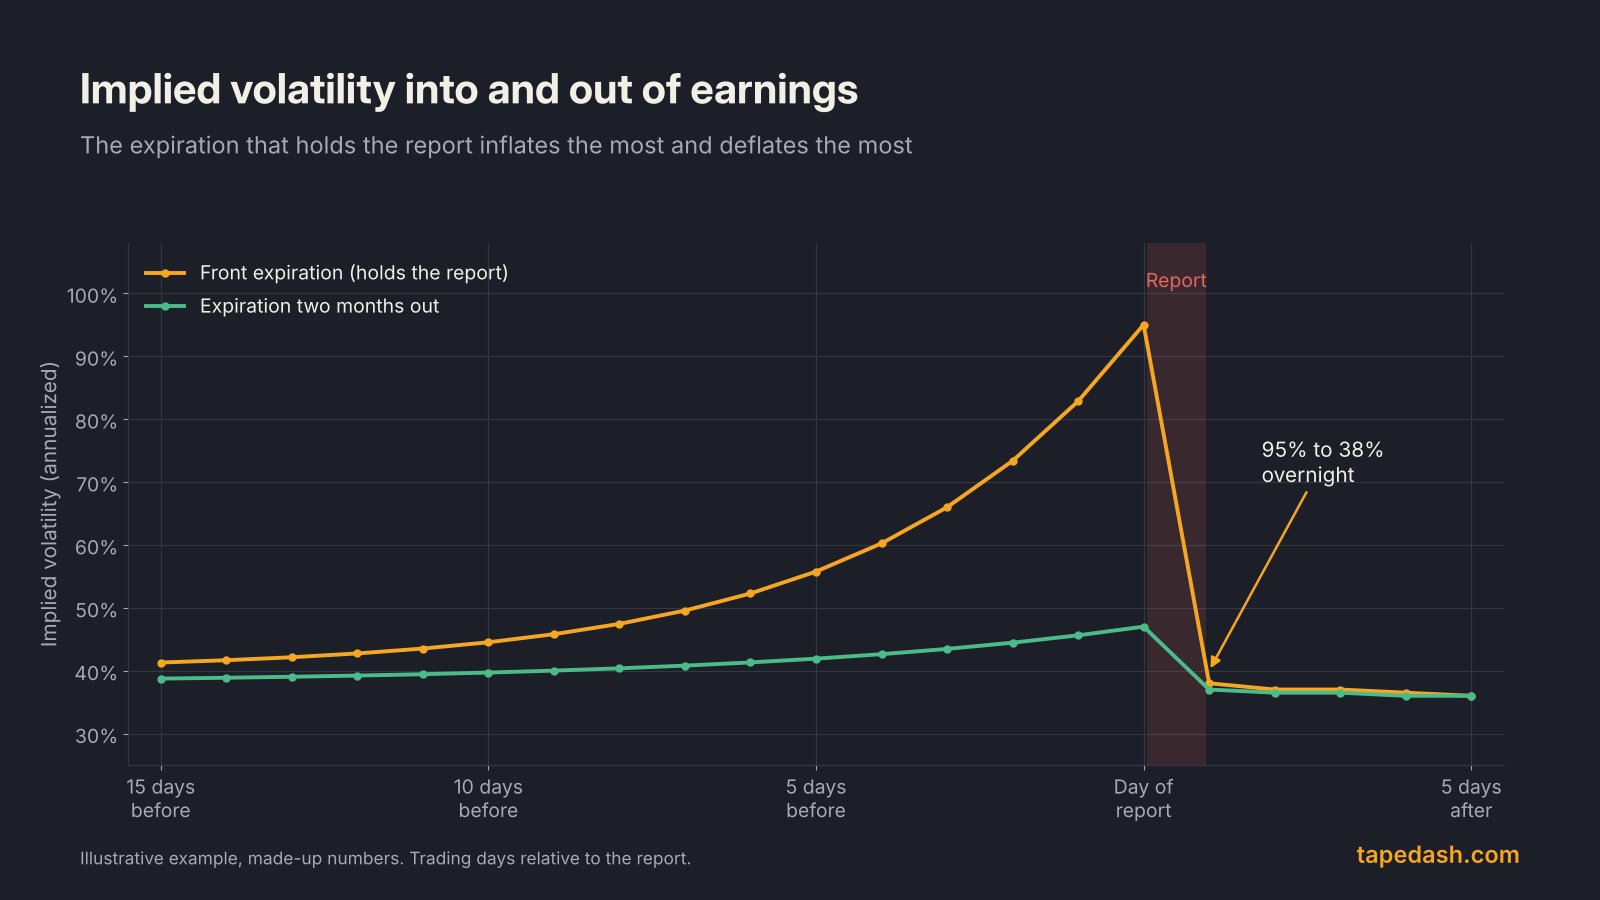
- The expiration that contains the report inflates the most beforehand and deflates the most afterward. Longer-dated options are affected much less.
- The at-the-money straddle in the first expiration after the report is the market’s price for the earnings move. Buyers of options need the stock to beat it; sellers need it to fall short.
- In our made-up example, a call gains $1.74 from a 3% rally but loses $1.80 to the IV drop and $0.52 to time decay, and ends below its cost.
- Plan around the implied move, not the headline. Check how the stock’s past reactions compared with what its options priced.
What is IV crush?
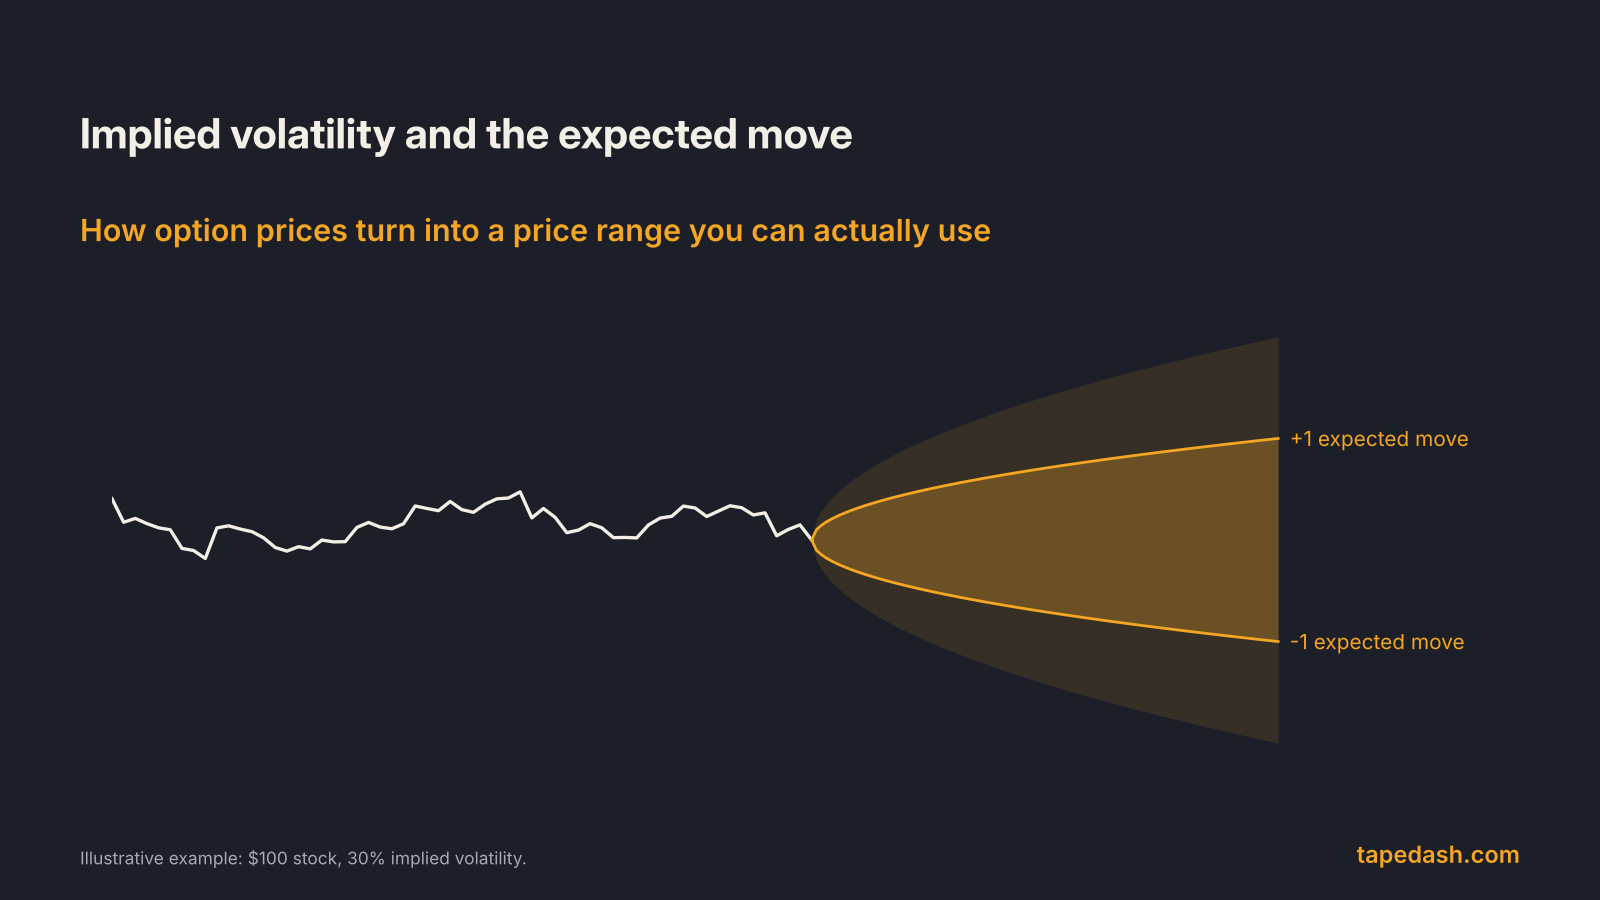
Implied volatility is the volatility figure baked into an option’s price. It rises when traders are willing to pay more for options and falls when they are not. (If you want the full mechanics, our guide to implied volatility and the expected move covers them.)
Ahead of a known event, demand for options climbs. Some traders want to bet on the outcome; others want to hedge stock they already own. Either way, option prices rise, and since the stock price, strike and time have not changed, the only pricing input that can rise to explain them is implied volatility. tastylive describes the result after the event as “a significant decrease in the implied volatility” of an option or group of options, once the uncertainty fades and demand drops off.
The Options Industry Council puts it in plain terms: implied volatility typically climbs in the weeks before an announcement, and once the news is out, options tend to reprice quickly. SoFi notes the same pattern around FDA decisions, late-stage trial results and Federal Reserve meetings. Any scheduled binary event can produce it. Earnings are simply the most frequent.
Why implied volatility collapses after earnings
The key insight is that the earnings premium is concentrated in a single day. On a normal day, a stock might move 1% or 2%. On earnings day, it might move 8%. An option that expires three days after the report has only a few trading days left, and one of them is that huge earnings day. To account for it, the option’s implied volatility, which is quoted as an annual average, has to be very high.
The morning after, that big day is in the past. The same option now has only ordinary days left until expiration, so its implied volatility drops back toward the stock’s normal level. Nothing mysterious happened. The event the market was paying for simply took place.
Why the front expiration gets crushed hardest
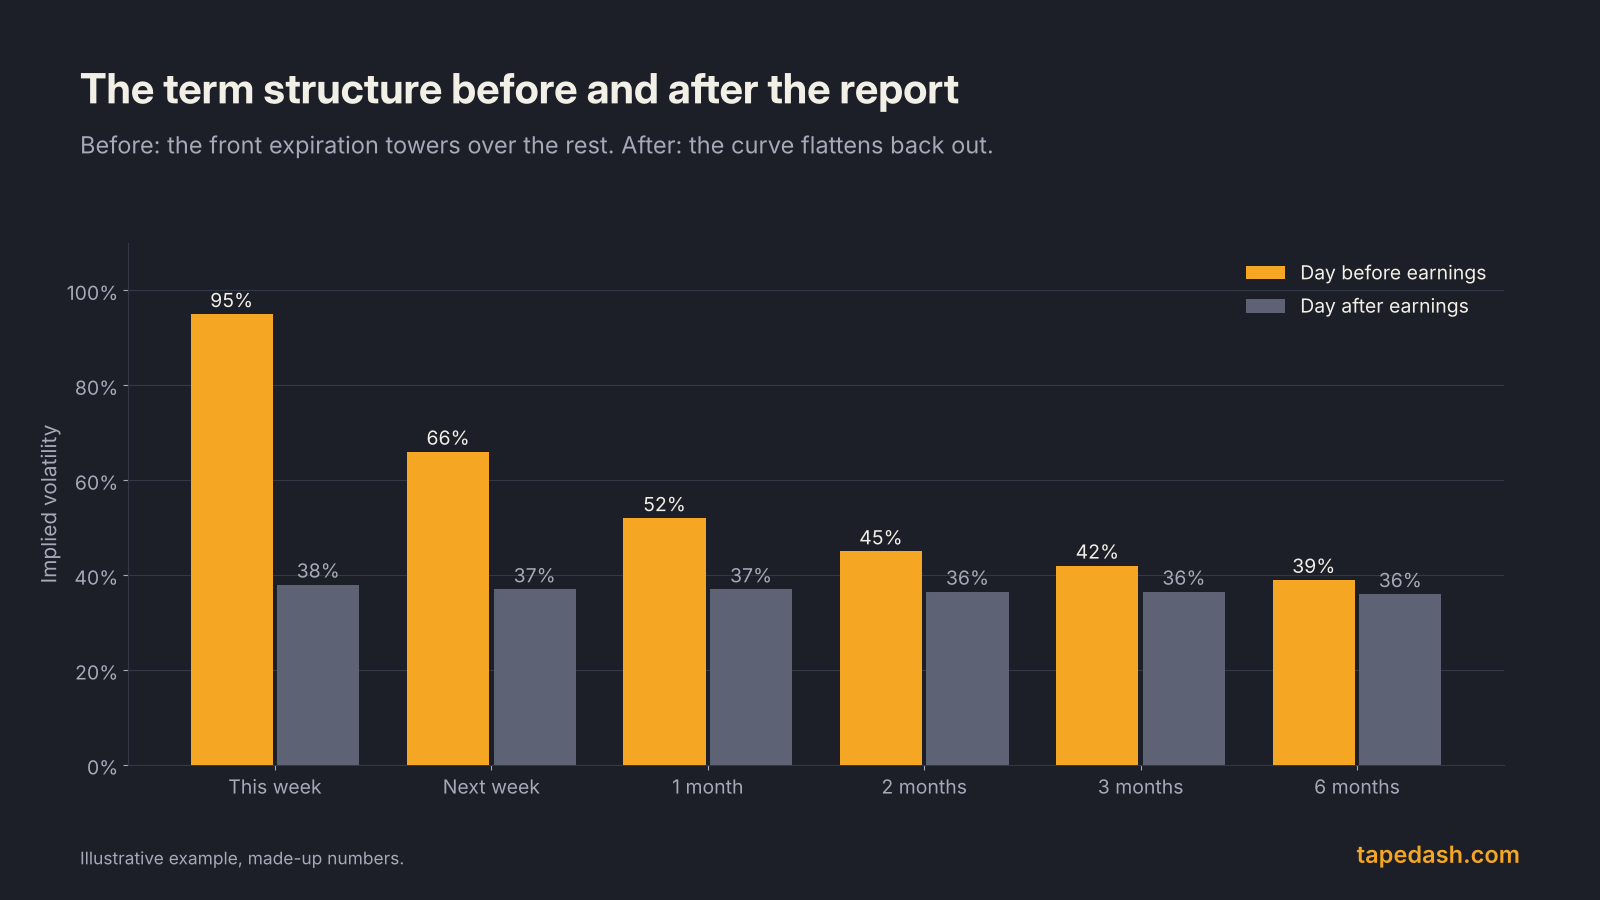
This is also why the crush is uneven across expirations. ORATS explains that the earnings-day move carries more weight in short-dated options, so front-month implied volatility runs higher than back-month IV before the announcement and falls more after it. A weekly option might see its IV cut by more than half. An option six months out spreads that one day across roughly 125 trading days, so its IV moves only a little.
Traders call this pattern in the term structure (the line of IVs across expirations) an earnings “kink” or “hump.” The front expiration towers over the rest the day before the report, and the curve flattens out the day after.
How IV crush hits an option position
Let’s put numbers on it. This is an illustrative example with made-up numbers, priced with a standard Black-Scholes model.
A stock trades at $100 and reports after the close. You buy the $100 strike call that expires in four days. Front-week implied volatility is 95%, and the call costs $3.99. The company reports a solid quarter, and the next morning the stock opens up 3% at $103. Front-week IV drops to 38%.
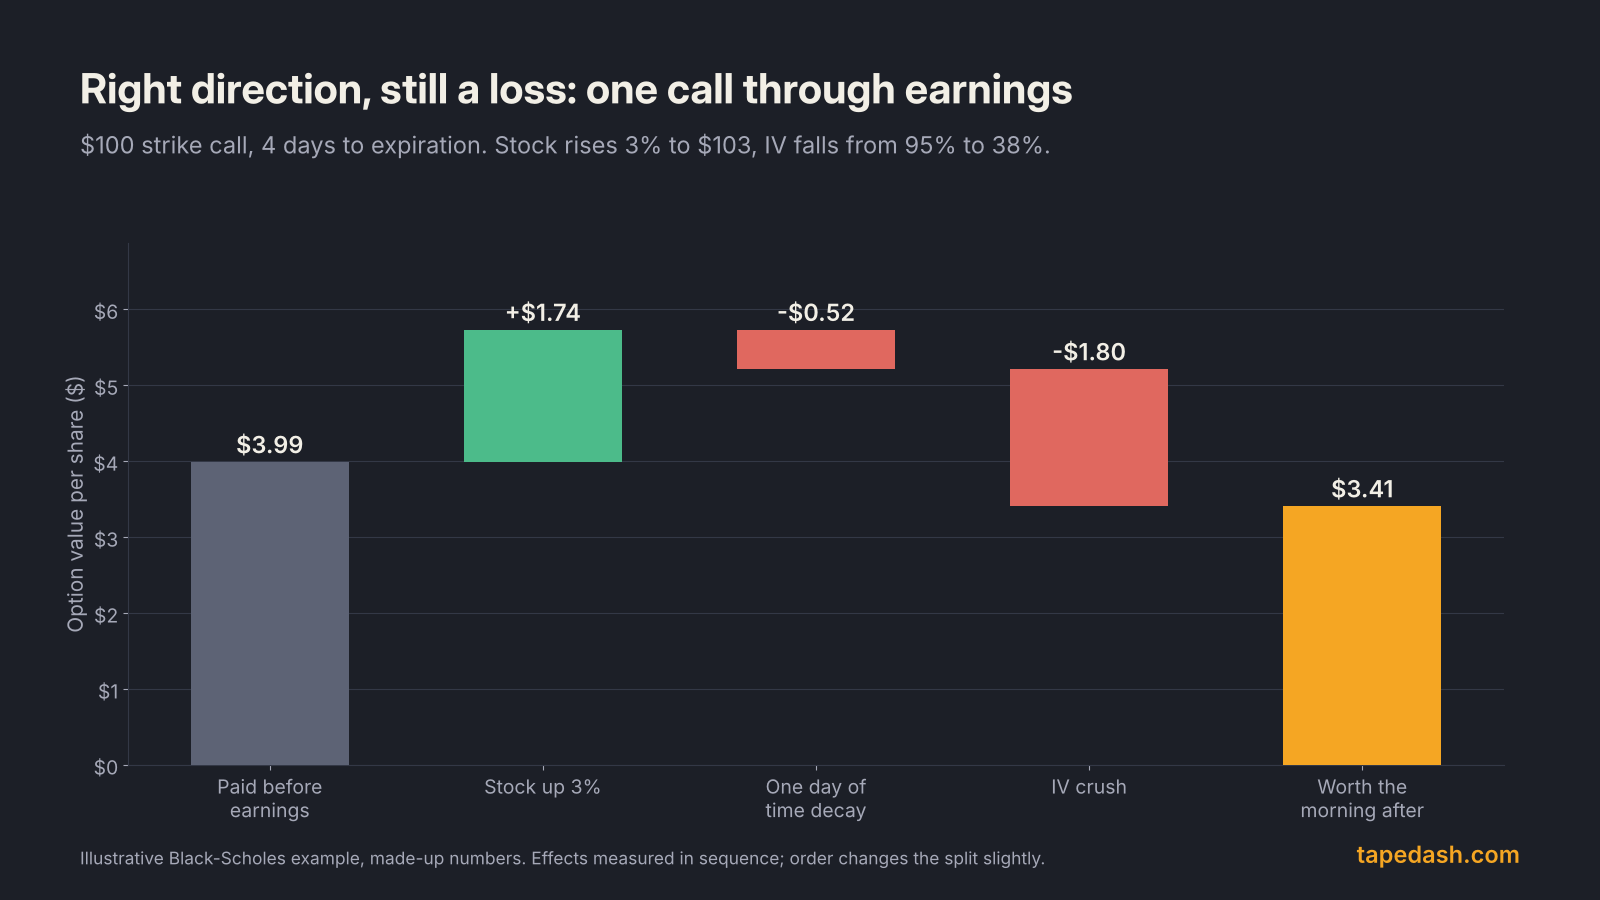
Here is what happened to the $3.99:
- The stock move added about $1.74. That is the part you got right.
- One day of time decay took about $0.52. Short-dated options lose value fast, and they lose more when IV is high.
- The IV drop took about $1.80. That is the crush, and it is larger than the gain from the move.
The call ends worth about $3.41, a loss of roughly 15% on a trade where the stock did exactly what you hoped. The OIC’s own illustrative example makes the same point with different numbers: a call bought with IV at 80% loses value when IV falls to 30%, even after the stock rallies past the strike.
The Greek that measures this exposure is vega: how much an option’s price changes for a one-point change in implied volatility. Long options have positive vega, so they lose when IV falls. Short options have negative vega, so they gain. Fidelity’s options education material walks through a vega calculation around an earnings date for exactly this reason.
The implied move is the bar you have to clear
The cleanest way to think about IV crush is through the implied move. The price of the at-the-money straddle (a call plus a put at the same strike) in the first expiration after the report is the market’s price for the earnings reaction. Option Alpha describes the implied move the same way, measured from the at-the-money straddle for the closest expiration after earnings.
In our example, the call costs $3.99 and the put about $3.94, so the straddle costs $7.93, an implied move of about 7.9% on a $100 stock. That is the hurdle.
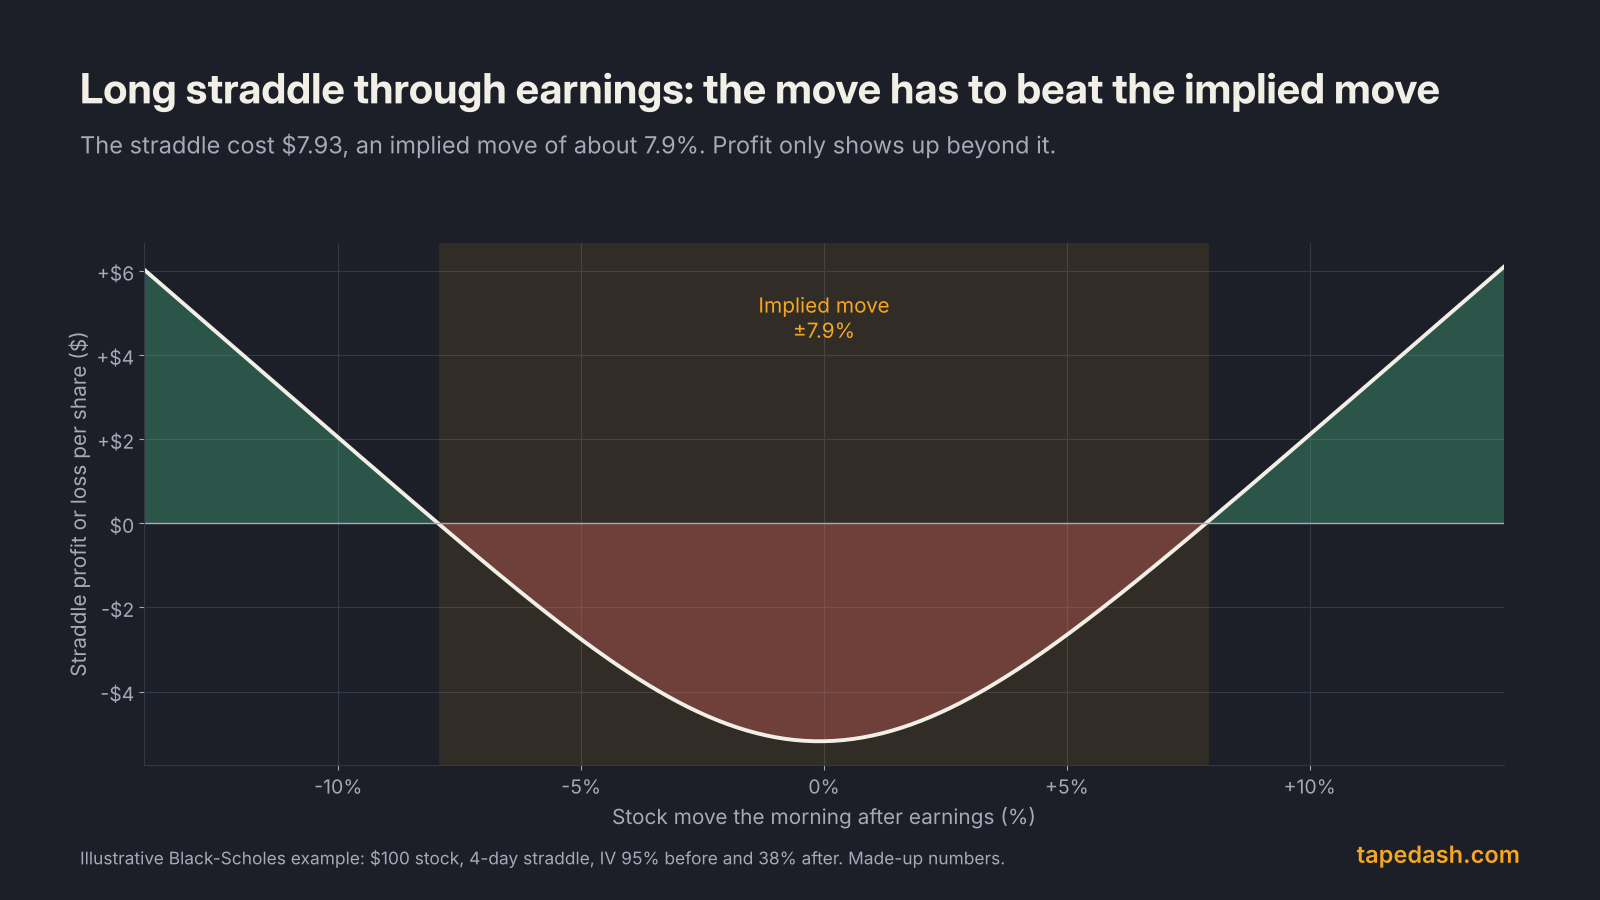
If the stock moves less than about 7.9% either way, the straddle buyer loses money and the straddle seller makes money. If it moves more, the roles reverse. This is why the question around earnings is never “will the stock go up?” It is “will the stock move more or less than the options already priced?”
Which strategies win and lose from IV crush
Every options position has a view on volatility, whether the trader intends it or not. Here is how the common approaches line up through an earnings report. This is a map of exposures, not a recommendation.
| Approach | Exposure to IV crush | What it needs | Main risk |
|---|---|---|---|
| Buy calls or puts before the report | Hurt (long vega) | A move bigger than the implied move, in your direction | Right direction, too small a move |
| Buy a straddle or strangle | Hurt (long vega) | A move bigger than the implied move, either direction | Stock moves less than priced |
| Sell a straddle or strangle | Helped (short vega) | A move smaller than the implied move | A gap far beyond the implied move; losses can be very large |
| Sell an iron condor (defined risk) | Helped (short vega) | Stock to stay inside the short strikes | Gap through a wing; the loss is capped but can exceed the credit several times |
| Calendar spread (sell front, buy back month) | Mostly helped | Front-month IV to fall more than back-month IV | A large move away from the strike |
| Wait and buy options after the report | Avoids the crush | A post-earnings trend or follow-through | Missing the gap itself |
Two notes on the table. First, “helped by IV crush” does not mean “safe.” tastylive warns that high IV may reflect real gap risk, and selling it into a big surprise can be painful. Second, the calendar spread is the structure ORATS highlights for trading the gap between inflated front-month IV and the more normal IV behind it, since it is short the expiration that gets crushed hardest and long one that barely moves.
How to plan for IV crush before an earnings trade
Here is the process we run before any options position that holds through a report.
- Find the implied move. Take the at-the-money straddle price for the first expiration after the report and divide by the stock price. That percentage is the market’s bar.
- Compare it with history. Look at how far the stock actually moved after its last eight to twelve reports. If it routinely moved more than its options priced, buying premium has had a tailwind. If it usually moved less, the crush has tended to win. Past behavior is not a promise, but it beats guessing.
- Decide which side of the implied move you are on. If you are buying options, write down why you expect a move bigger than the market does. If you cannot, you are paying for the crush.
- Price the morning after. Most platforms let you model a position at a new stock price and a new IV. Set IV to the stock’s normal level, test moves of half, one and two implied moves, and look at the result. Do this before you trade, not after.
- Pick the expiration on purpose. The further out you go, the less crush you take, but the less leverage you get. Choosing a weekly that expires two days after the report is choosing maximum crush.
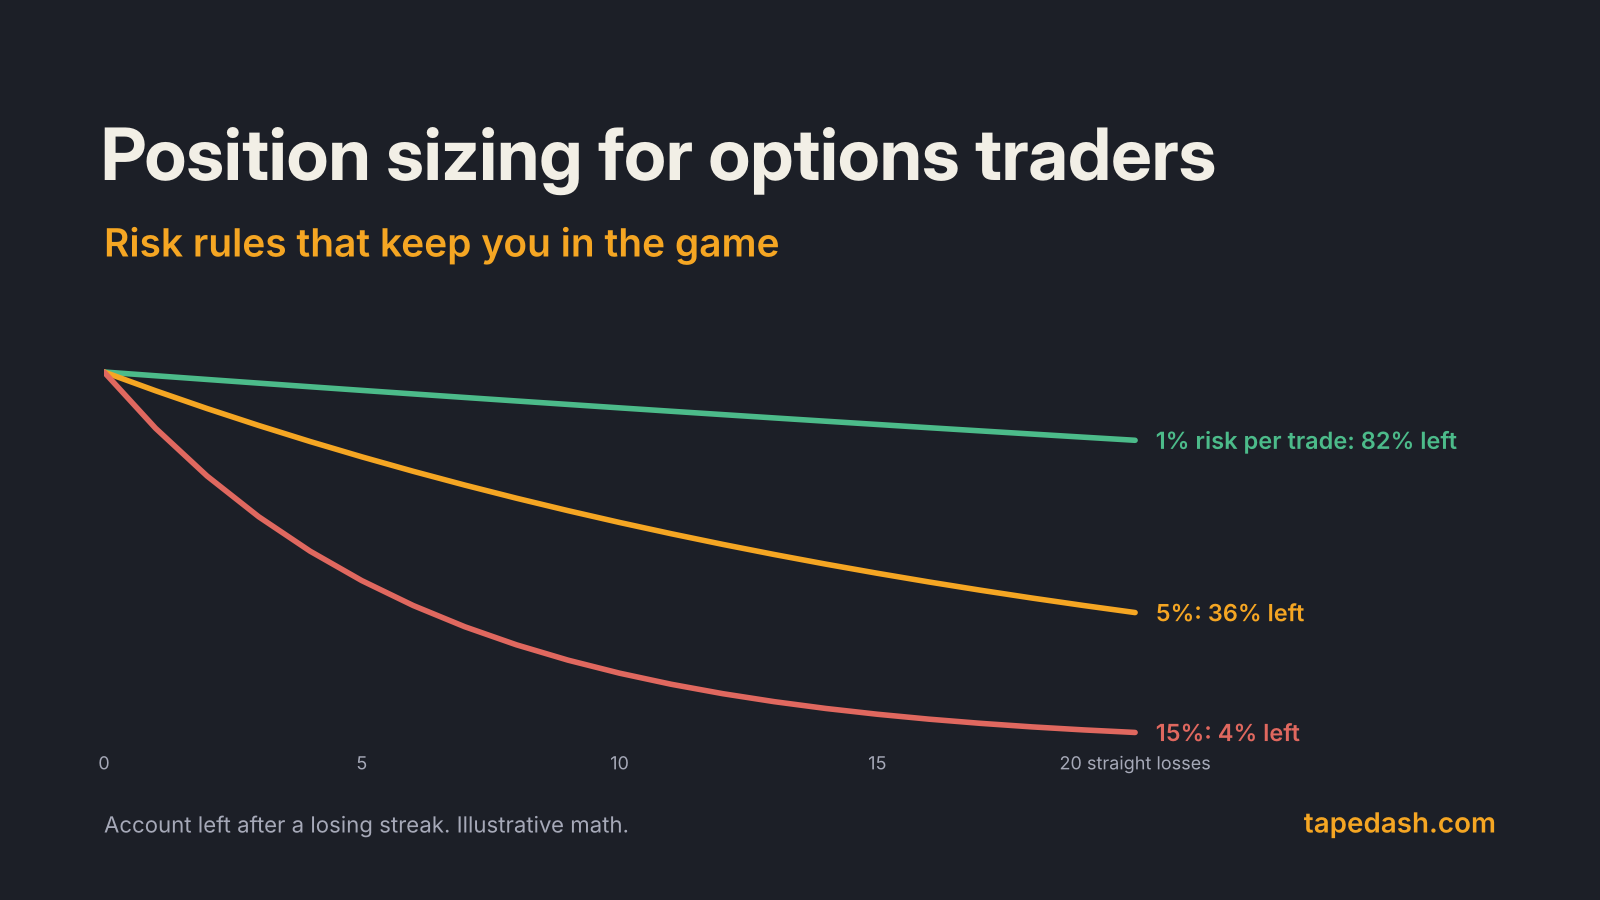
- Size it as an event trade. Earnings gaps can blow through any stop. Size the position so the worst realistic outcome is acceptable; our guide to position sizing for options traders covers the rules.
- Score the result honestly. After the report, compare the actual move with the implied move. That single comparison, more than the stock’s direction, explains what happened to the options. It is also the core habit in reading an earnings report like a trader.
How TapeDash tracks implied moves and IV into earnings
If you want to see the crush coming instead of discovering it the next morning, this is what we track. The Earnings page in TapeDash shows the implied move for upcoming reports, read from the options market, which is the hurdle every long or short option position through the report is really betting against. The Volatility Desk is where we check implied volatility before the trade, including whether the front expiration is carrying the earnings premium described above.
For working out what a position does through the report, the Options Risk Desk is where we look at a position’s risk before the event rather than after it. You can explore all three in the Terminal Preview, free and without an account. The free TapeDash Daily covers what moved after the close each evening, and the first 200 members lock Pro at $99 a month for as long as they stay.
IV crush FAQ
How much does IV drop after earnings?
It varies by stock and by expiration. The expiration closest to the report usually sees the biggest drop, often falling back toward the stock’s normal implied volatility, while options months out move only a few points. The best way to estimate it is to look at the front expiration’s IV compared with the next one out before the report, and at how that stock’s IV behaved after previous reports.
Can you avoid IV crush?
You can reduce it. Buying options after the report avoids the crush entirely, though you also miss the gap. Choosing longer-dated expirations reduces it, since their IV moves less. Spreads that are long and short options at the same time, such as vertical spreads, offset much of the vega. What you cannot do is hold a plain long option through earnings without paying for the event.
Does IV crush happen without earnings?
Yes. Any scheduled event with an uncertain outcome can produce it: drug approval decisions, trial results, central bank meetings or major court rulings. The Motley Fool notes that IV typically rises ahead of events like earnings reports or FOMC meetings. When the event passes, the premium for it goes away.
The one idea to keep
Before earnings, an option’s price includes a fee for the report itself. The morning after, that fee is gone, whatever the stock did. So the real question is never whether the company beats or misses. It is whether the stock moves more or less than the options already priced. Find the implied move, compare it with what the stock has actually done, and decide which side of that number you want to be on before you click buy.
See it on the tape, not just in the headlines
TapeDash is the research desk for traders and investors: live options flow, dealer positioning, a real-time market scanner and trade alerts graded in public. Memberships open January 1, 2027, and the first 200 members lock Pro at $99 a month for as long as they stay.
Join the waitlistClick through the terminalSee the track recordSources
- tastylive: What is an Implied Volatility (IV) Crush and How to Avoid It
- Options Industry Council: The Crush Is Real
- SoFi: Understanding IV Crush
- Option Alpha: IV Crush
- ORATS: Earnings Crush and Implied Volatility
- Montreal Exchange: Understanding Volatility Crush
- Fidelity: Trading Options and Earnings (webinar deck)
- The Motley Fool: Implied Volatility
This article is for educational and informational purposes only. It is not financial, investment, medical or legal advice, and it is not a recommendation to buy or sell any security. Figures come from the sources listed and were checked on the date of publication; markets change quickly. Options trading involves substantial risk of loss.