How to Read an Earnings Report Like a Trader
How to read an earnings report like a trader: what to check first, why guidance beats the headline EPS, how to judge non-GAAP numbers and the stock's reaction.
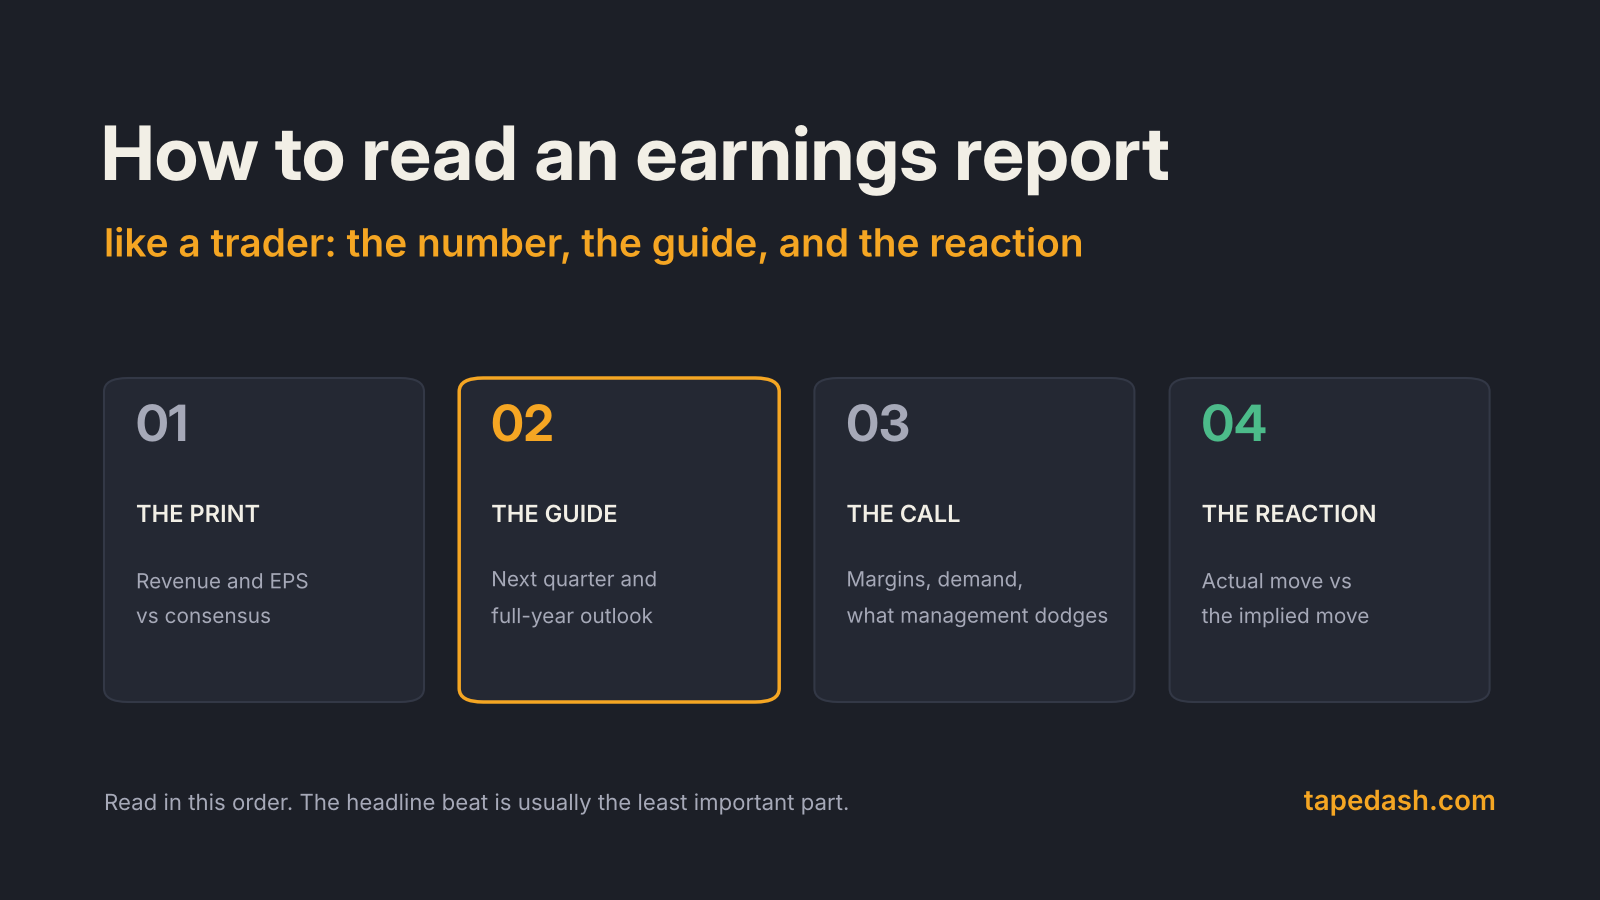
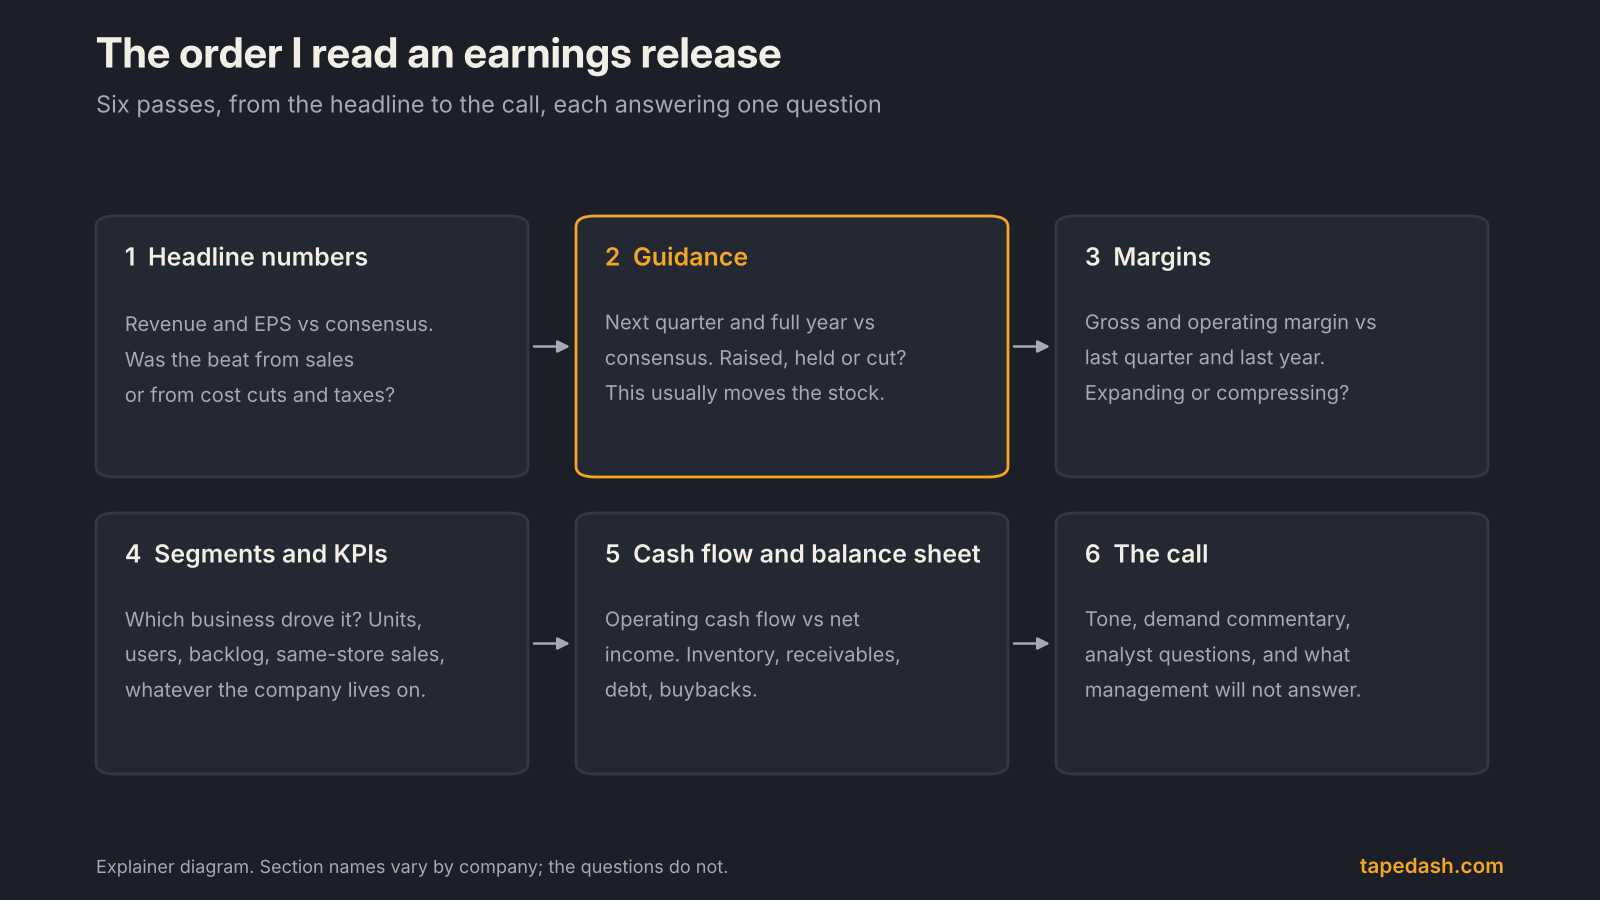
To read an earnings report like a trader, start with what the market expected, not what the company earned. Check revenue and earnings per share against the consensus estimate, then go straight to guidance, because the outlook for the next quarter and the full year usually moves the stock more than the quarter that just ended. After that, check margins, the segment that drove the result, cash flow, and the earnings call. Finally, grade the stock’s move against the move options were pricing.
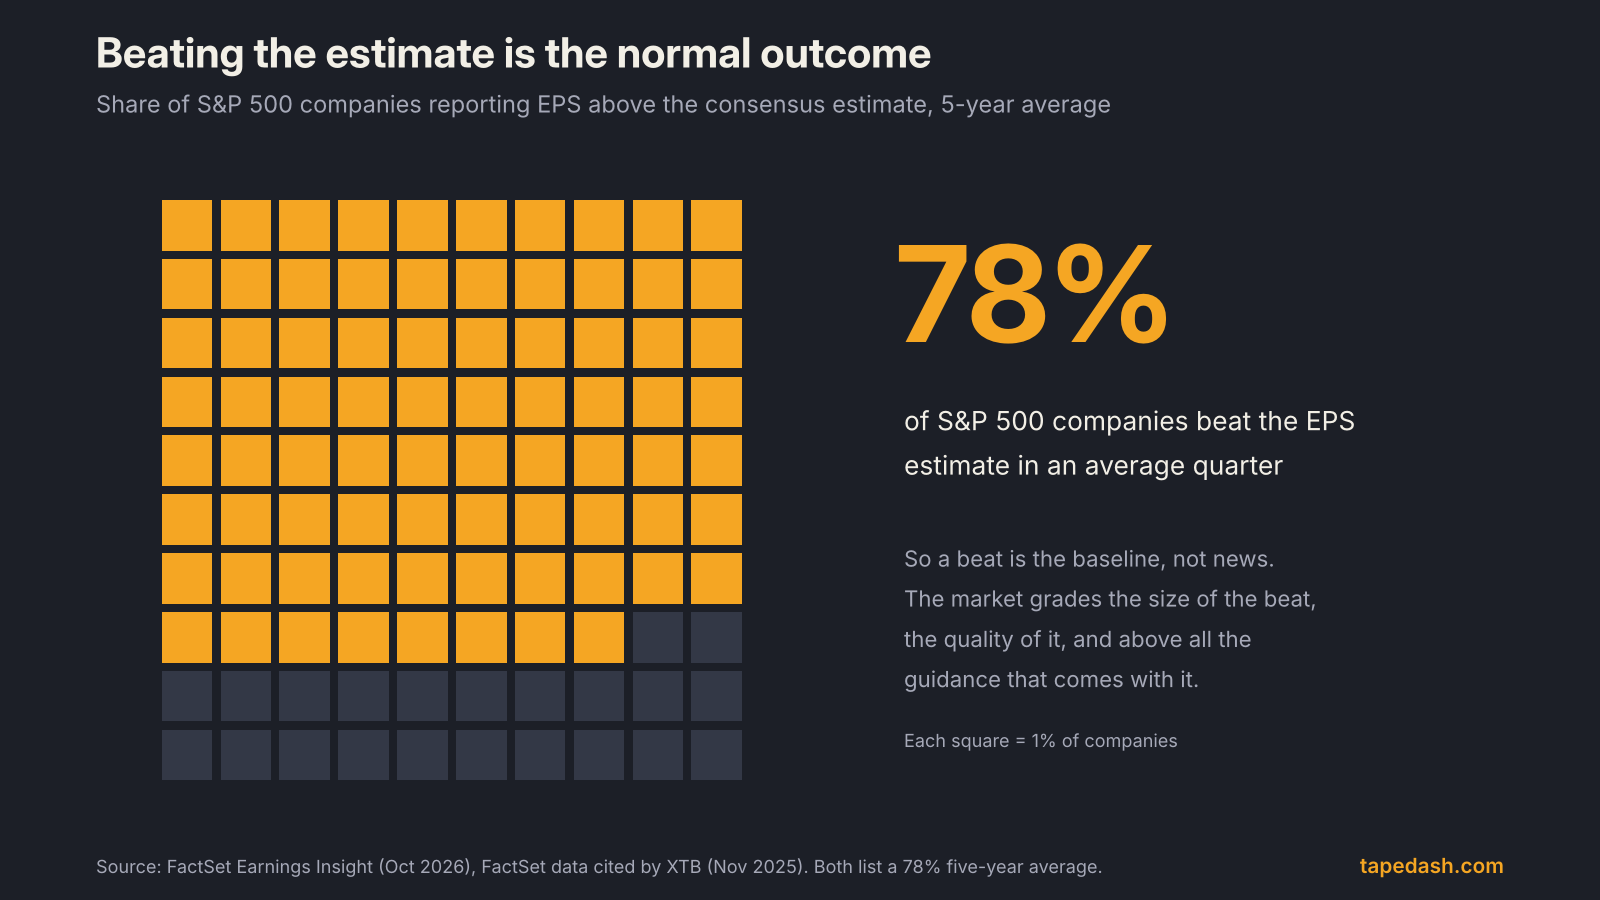
That order matters because a “beat” is not news. According to FactSet, 78% of S&P 500 companies have beaten the consensus EPS estimate in an average quarter over the past five years, a figure XTB’s summary of FactSet data also reports. When nearly four out of five companies clear the bar, clearing it tells you very little.
We are in the middle of the third-quarter 2026 reporting season right now, so this is a good week to build the habit. This guide walks through the release the way I read it, section by section, with the specific questions I ask at each step.
- About 78% of S&P 500 companies beat EPS estimates in an average quarter (FactSet five-year average), so a beat is the baseline. The size and quality of the beat matter more.
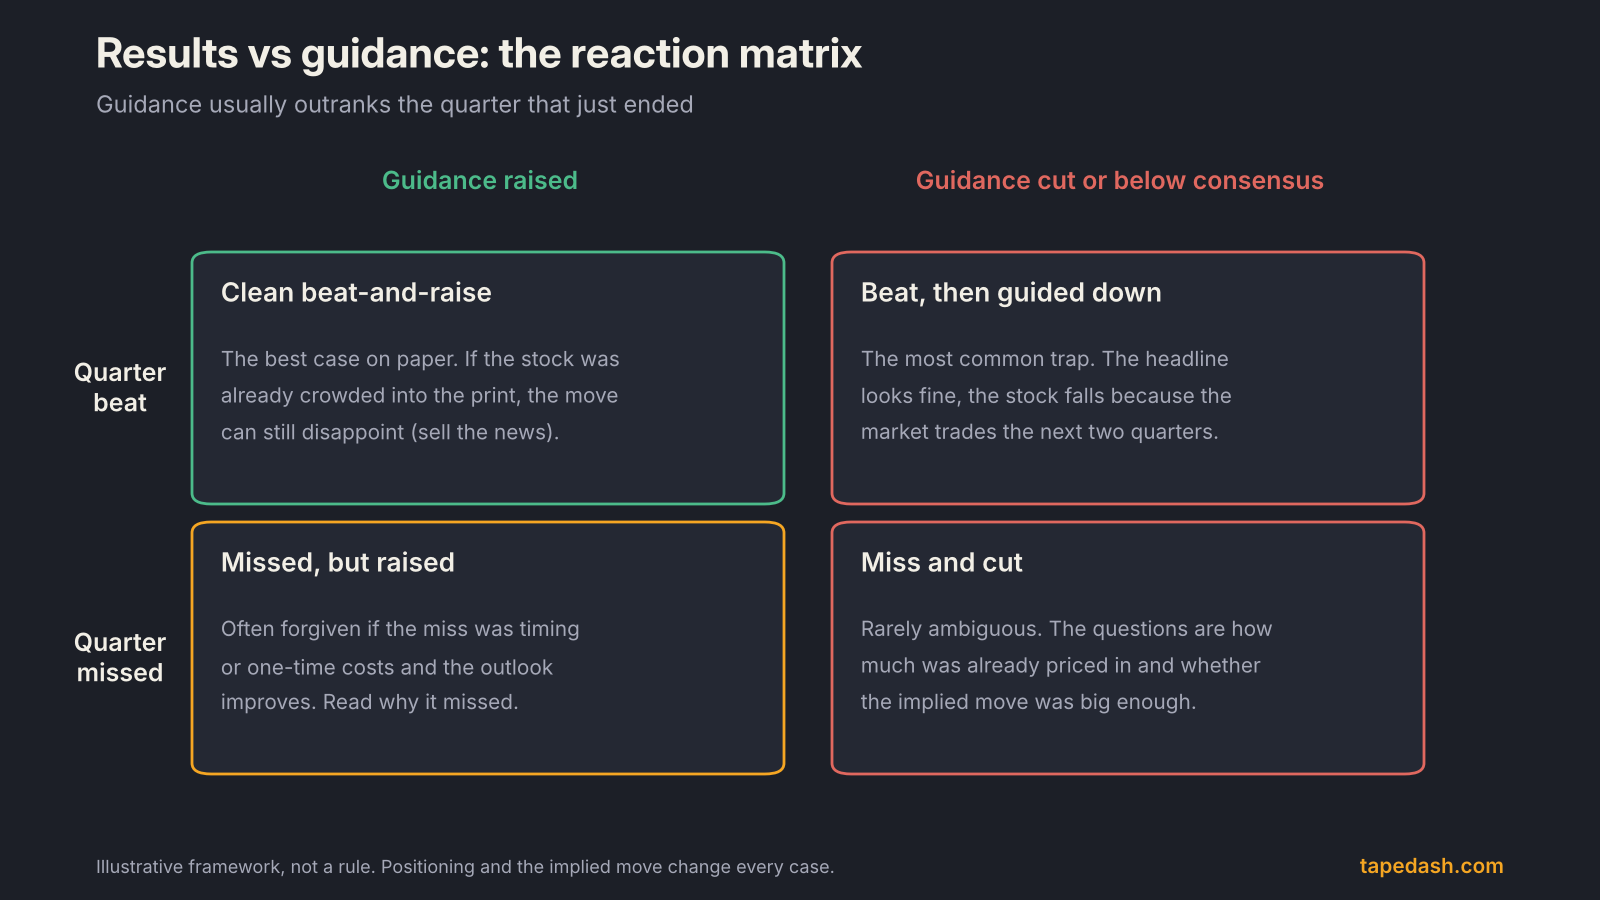
- Guidance usually outranks the quarter. A beat with a weak outlook often trades lower.
- Most headline EPS figures are adjusted (non-GAAP). SEC rules require a reconciliation to GAAP; read it.
- Check margins, the key segment and cash flow before you trust the headline.
- Judge the reaction against the options-implied move, not against zero.
What is in an earnings report
“Earnings report” usually means three different things released over a few weeks, and traders mostly care about the first two.
The earnings press release is the document that moves the stock. Public companies furnish it to the SEC on a Form 8-K under Item 2.02, “Results of Operations and Financial Condition,” usually attached as Exhibit 99.1, as sec-api’s guide to Item 2.02 and Cooley’s overview of the non-GAAP rules both describe. It contains the headline numbers, often a shareholder letter, the outlook, and the financial tables.
The earnings call follows, typically within an hour or two. Since the SEC adopted Regulation Fair Disclosure in August 2000 (FindLaw, Wikipedia), companies cannot hand material information to analysts privately, so the call is announced in advance and open to anyone who dials in or streams it.
The Form 10-Q is the full quarterly filing, with detailed notes and risk factors. Large accelerated and accelerated filers have 40 days after quarter-end to file it, and smaller companies have 45, per the SEC’s final rule in the Federal Register and Wikipedia’s summary. The 10-Q rarely moves a stock on the day it posts, but it is where you find what the release glossed over.
Step 1: Headline numbers vs expectations
Start with revenue and EPS, and compare each to the consensus estimate, the average of analysts’ published forecasts. Your broker, the financial press and most earnings calendars show it.
Three questions turn a headline into information.
How big was the beat? A penny beat on a $2.00 EPS estimate is noise. A 10% beat on revenue is not. Calibrate against the company’s own history; some management teams guide conservatively and beat by the same margin every quarter, and the market knows it.
Where did the beat come from? An EPS beat with a revenue miss means the company found the money in costs, a lower tax rate, interest income or share buybacks. Those can be fine, but they repeat less reliably than sales growth. A revenue beat with strong gross margin is the higher-quality version.
Was there a “whisper”? For heavily traded names, buy-side expectations often sit above the published consensus. If a stock ran 15% into the print, the real bar was higher than the number on the screen.
Step 2: Guidance, the number that moves the stock
If you read one section closely, make it this one. Guidance is the company’s own forecast for the next quarter, the full fiscal year, or both. Some companies give ranges for revenue and EPS; others guide only on revenue, margins or a key operating metric. Some do not guide at all, and then the call commentary carries the weight.
Compare the guidance midpoint to consensus for the same period. Then classify it: raised, reaffirmed, or lowered. A company that beats the quarter but guides the next one below where analysts were sits in the most common trap in earnings season. The headline reads well, the stock falls, and people on social media call it irrational. It is not. Stocks are priced on future cash flows, and guidance is the best fresh information about them.
A few details sharpen the read. A raised full-year number that only reflects this quarter’s beat (and leaves the back half unchanged) is weaker than it looks. Watch for currency or acquisition effects that inflate the guide. And note the width of the range; a wider range than usual is management telling you their visibility got worse.
Step 3: Non-GAAP vs GAAP earnings
Most headline EPS figures are “adjusted,” meaning management has removed items it considers non-recurring or non-cash. Common adjustments include stock-based compensation, amortization of acquired intangibles, restructuring charges and acquisition costs.
The rules here are specific. Under Regulation G and Item 10(e) of Regulation S-K, a company that publishes a non-GAAP measure must also show the most directly comparable GAAP measure and a quantitative reconciliation between the two. For earnings releases furnished under Item 2.02, the GAAP figure must be presented with equal or greater prominence, as Cooley explains and sec-api notes is the reason nearly every release carries a reconciliation table.
That table is where you learn how much of the “earnings” is real. Here is an illustrative example with made-up numbers.
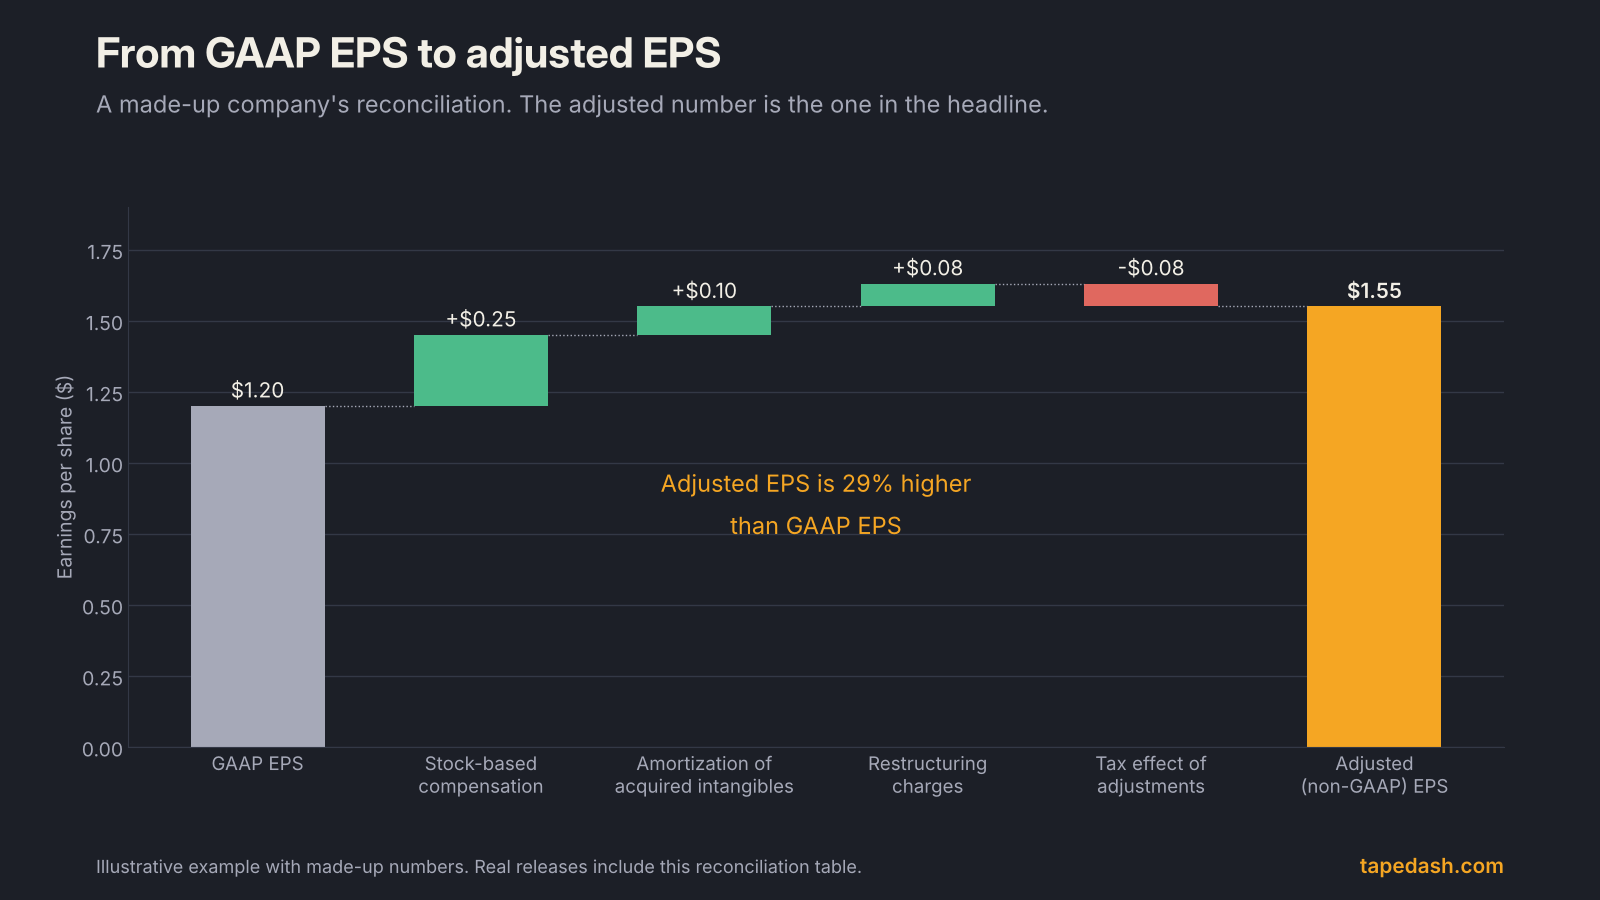
Two things to check every time. First, is the gap between GAAP and adjusted EPS stable, or growing? Second, are “one-time” items showing up every quarter? Restructuring charges four quarters in a row are an operating cost wearing a disguise. Stock-based compensation is a real expense to shareholders through dilution, whatever the adjusted figure says.
Step 4: Margins, segments and the KPI that matters
Revenue and EPS tell you what happened. Margins tell you how. Pull up the income statement and compare gross margin and operating margin to the prior quarter and the same quarter last year. Expanding margins on growing revenue is the strongest combination a release can show. Shrinking gross margin is often the first sign of pricing pressure or rising input costs, well before it shows up in the headline numbers.
Then find the segment that drives the stock. For a chipmaker it may be data center revenue. For a retailer, same-store sales and inventory. For a software company, remaining performance obligations or net revenue retention. For a bank, net interest income and credit costs. Every company has one or two numbers that the market actually trades, and they are often a few pages into the release. If you are not sure which metric matters, read the first three analyst questions on the last call; they will tell you.
Step 5: Cash flow and the balance sheet
Earnings are an accounting opinion. Cash is a fact. Compare operating cash flow to net income over the past few quarters. If profits are rising but cash flow is not, look at receivables (customers paying slower) and inventory (product piling up). Both can flatter earnings for a while.
On the balance sheet, check cash, debt and any change in share count. Big buybacks can lift EPS without any growth in the business. That is not bad by itself, but it is worth knowing which kind of EPS growth you are looking at.
| What the release says | What to check underneath | Red flag |
|---|---|---|
| “Record revenue” | Growth rate vs last quarter and vs guidance | Growth slowing while the headline says “record” |
| “EPS beat by $0.10” | Whether revenue also beat; tax rate; buybacks | EPS beat with a revenue miss |
| “Adjusted EPS of $1.55” | The GAAP reconciliation table | Gap between GAAP and adjusted keeps growing |
| “Reaffirming full-year outlook” | Implied back-half numbers after this quarter’s beat | Beat this quarter, unchanged year: back half was cut |
| “Strong demand” | Backlog, bookings, deferred revenue, inventory | Inventory rising faster than sales |
| “Margin expansion” | Gross vs operating margin, one-time items | Margins up only because spending was deferred |
Step 6: The earnings call
The call is where management explains the numbers and analysts push back. I listen for three things.
Tone versus the prepared remarks. Management’s opening script is polished. The Q&A is not. Notice when an executive gives a long, vague answer to a direct question about demand, pricing or a specific customer.
What changed in the language. Compare this call’s description of demand to last quarter’s. A shift from “accelerating” to “healthy” is a downgrade in plain sight.
The questions that get dodged. If three analysts ask about the same thing (margins next year, a competitor, an order pause) and none gets a straight answer, that topic is the risk the market will trade for the next month.
How to read the stock’s reaction
The final step is grading the market’s verdict, and the right benchmark is not zero. It is the implied move. Before every report, options prices tell you how big a move the market expects, roughly the price of the at-the-money straddle divided by the stock price. We cover the math in Implied Volatility and the Expected Move, Explained.
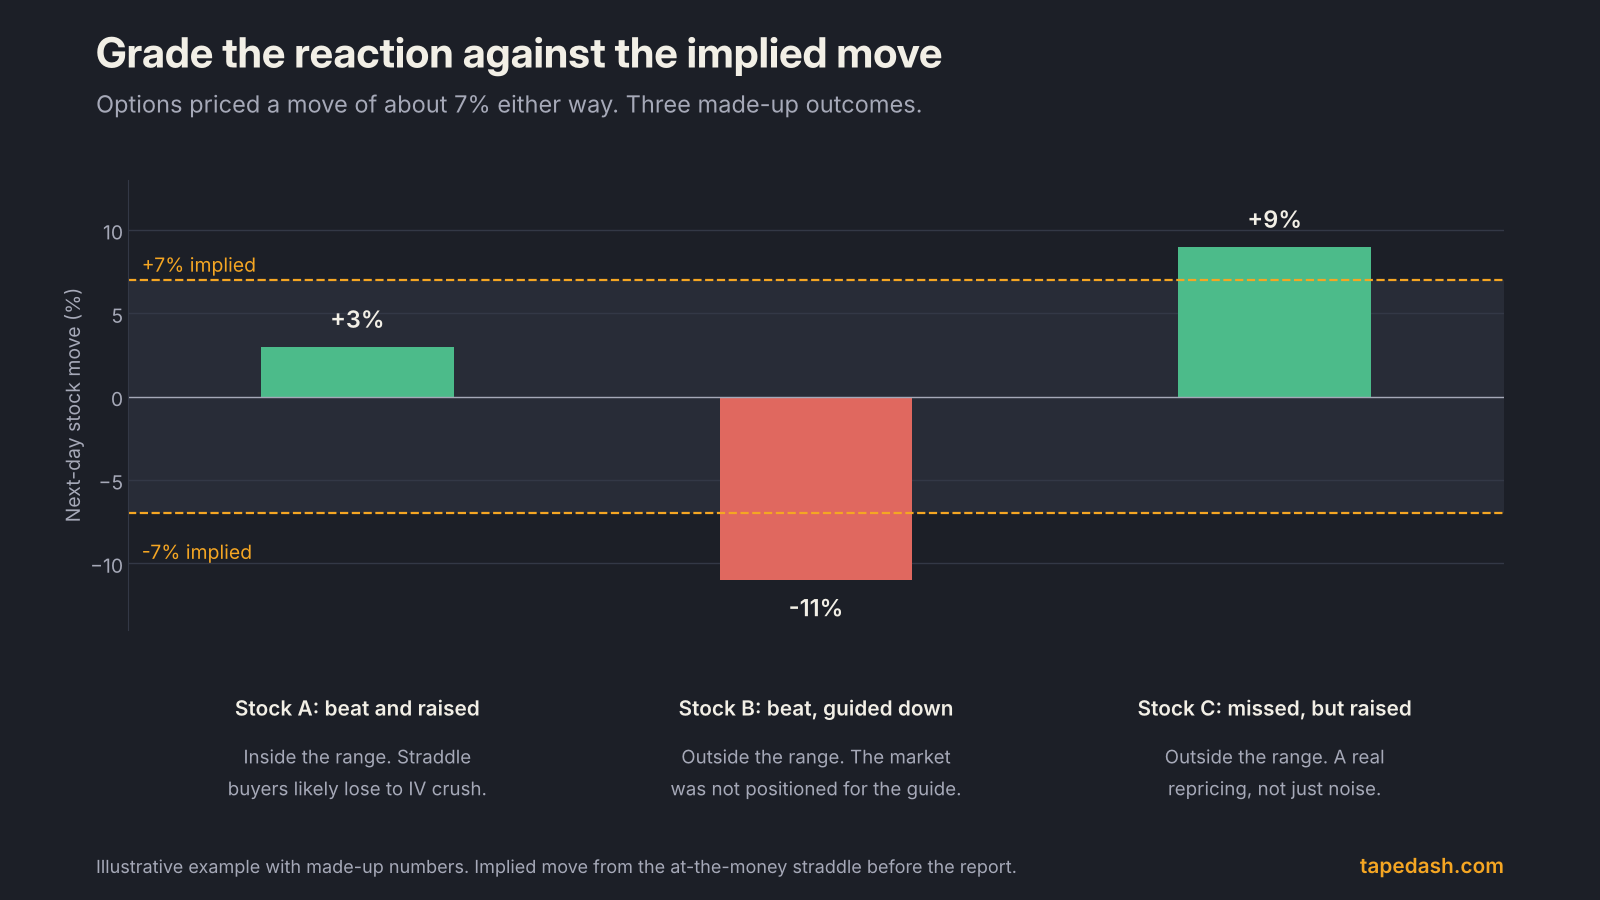
A move inside the implied range means the report was roughly what was priced. A move well outside it means the market learned something it did not expect, and those moves tend to matter more for the weeks that follow. Implied volatility also collapses after the report, which is why buying options right before earnings can lose money even when you get the direction right. Our piece on IV crush after earnings walks through that trade-off.
The reaction is also asymmetric. FactSet tracks the average price move around earnings every season, and in its Q3 2024 review companies that missed fell further on average than companies that beat rose. Misses are rarer, so they carry more information.
How to use it: a 15-minute earnings routine
Here is the routine I would hand a newer trader for any report they care about.
- Before the print: write down consensus revenue, EPS and next-quarter guidance, the implied move from options, and how far the stock ran in the prior two weeks.
- First five minutes after the release: check the headline vs consensus, then go straight to guidance vs consensus. Classify it as beat-and-raise, beat-and-cut, miss-and-raise or miss-and-cut.
- Next five minutes: check gross and operating margin, the key segment or KPI, and the GAAP reconciliation.
- Next five minutes: compare the after-hours move to the implied move. Inside the range is noise. Outside the range deserves your attention.
- During the call: note any change in demand language and any question that does not get a straight answer.
- The next morning: see whether the after-hours move held into the regular session. Moves that fade by the open often reflect thin overnight liquidity rather than conviction.
What to watch next this earnings season
Third-quarter 2026 reports are rolling in now. For companies with a September 30 quarter-end, the 40-day 10-Q deadline for larger filers falls on November 9, 2026, so the full filings, with the details the press releases leave out, will land over the next two weeks. Earnings will also share the tape with this week’s Fed decision on October 28, which we cover in our Fed decision preview. A hawkish surprise can swamp a good report in rate-sensitive sectors, so check the macro calendar before you size an earnings trade.
How TapeDash tracks earnings
If you want to run this routine without six browser tabs, our Earnings page lists upcoming reports with the options-implied move for each, so you know the bar before the print. The Volatility Desk shows how implied volatility is building into the report and how it collapses after, and the Contract Picker helps match a structure to the move you expect rather than defaulting to a straddle.
You can explore all of it in the Terminal Preview, free with no account, or get the free TapeDash Daily for the morning earnings calendar and the implied moves that matter.
Earnings report FAQ
Why did a stock fall after beating earnings?
Usually because of guidance, expectations or positioning. If the outlook came in below consensus, if buy-side expectations were higher than the published estimate, or if the stock rallied hard into the report, a beat can still trigger selling.
What is the difference between GAAP and non-GAAP earnings?
GAAP earnings follow standard accounting rules. Non-GAAP (adjusted) earnings remove items management considers unusual or non-cash, such as stock compensation or restructuring. SEC rules require companies to show the GAAP figure and reconcile the two.
What is a beat-and-raise quarter?
A quarter where the company beats revenue and EPS estimates and also raises its guidance above consensus. It is the strongest headline outcome, but the stock can still fall if the market expected even more.
The one idea to keep: an earnings report is a grade against expectations, and the expectations that matter most are about the future. Read the guidance before you react to the headline, and judge the stock’s move against what options were pricing.
See it on the tape, not just in the headlines
TapeDash is the research desk for traders and investors: live options flow, dealer positioning, a real-time market scanner and trade alerts graded in public. Memberships open January 1, 2027, and the first 200 members lock Pro at $99 a month for as long as they stay.
Join the waitlistClick through the terminalSee the track recordSources
- FactSet Insight: S&P 500 Earnings Season Update, October 23, 2026
- FactSet Insight: S&P 500 Earnings Season Update, October 16, 2026
- XTB: US earnings season summary, what the latest FactSet data shows (Nov 2025)
- FactSet Insight: Market is punishing negative EPS surprises more than average for Q3 (Nov 2024)
- sec-api.io: Form 8-K Item 2.02 and Exhibit 99, earnings announcements explained
- Cooley: Non-GAAP financial metrics, Regulation G and Item 10(e) of Regulation S-K
- Federal Register: Revisions to accelerated filer definition and accelerated deadlines for periodic reports
- Wikipedia: Form 10-Q
- FindLaw: New Regulation FD prohibits selective disclosure
- Wikipedia: Regulation Fair Disclosure
This article is for educational and informational purposes only. It is not financial, investment, medical or legal advice, and it is not a recommendation to buy or sell any security. Figures come from the sources listed and were checked on the date of publication; markets change quickly. Options trading involves substantial risk of loss.