Nasdaq Correction: Why the Chip Index Fell 12% in One Day
The Nasdaq fell 5.5% into a correction as chip stocks crashed 12%. What drove the AI selloff, how forced selling works, and what traders watch next.
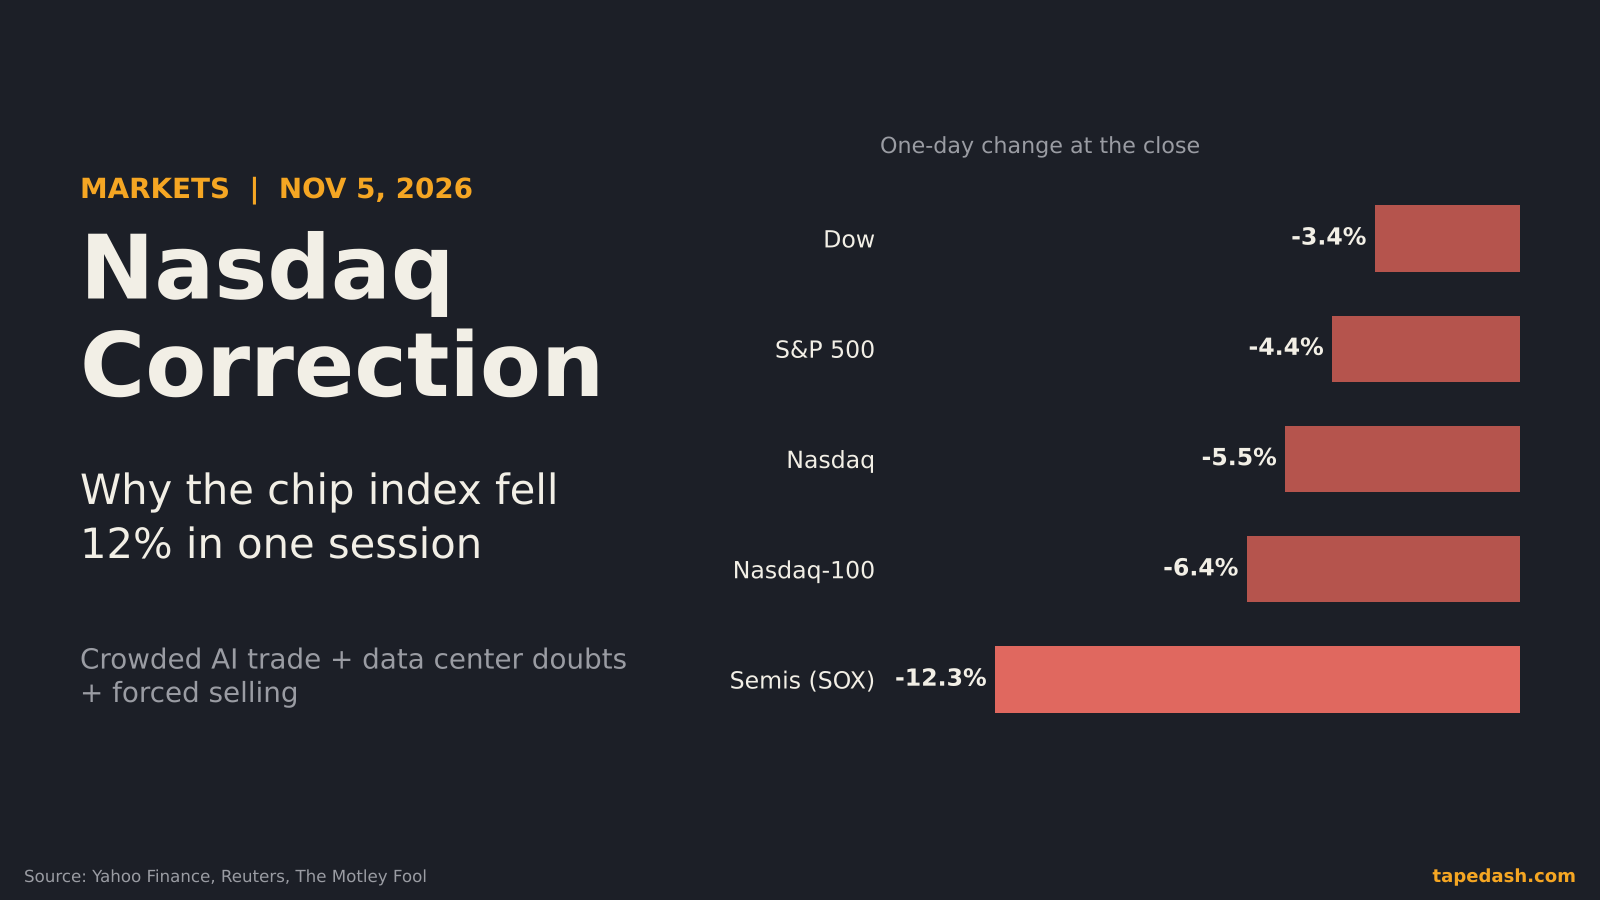
The Nasdaq Composite fell 5.52% on Thursday, Nov. 5, to close at 24,315, and that drop pushed it into a correction, more than 10% below its Oct. 6 record. The S&P 500 lost 4.36% and the Dow gave up 1,833 points, according to Yahoo Finance and The Motley Fool. For the S&P 500, it was the worst session since April 2025.
The center of the damage was semiconductors. The Philadelphia Semiconductor Index (SOX) fell 12.25% to 9,011, per Yahoo Finance and Le Private Banker, and CNN reported it was on track for its worst day since March 2020. AMD fell 17%, Broadcom 10% and NVIDIA 9%.
So why did chip stocks crash? Short answer: three things hit at once. A new worry that U.S. data center construction will slow, a weak outlook from Qualcomm, and a crowded AI trade that hedge funds were already looking to lighten into year-end. The first two gave people a reason to sell. The third explains why the selling was so violent. That last part is the piece most coverage skips, and it is the part that matters most for what happens next.
- The Nasdaq fell 5.5% and entered a correction, more than 10% below its Oct. 6 record. The S&P 500 had its worst day since April 2025.
- The semiconductor index dropped 12.25%. AMD lost about 17%, Broadcom about 10% and NVIDIA about 9%.
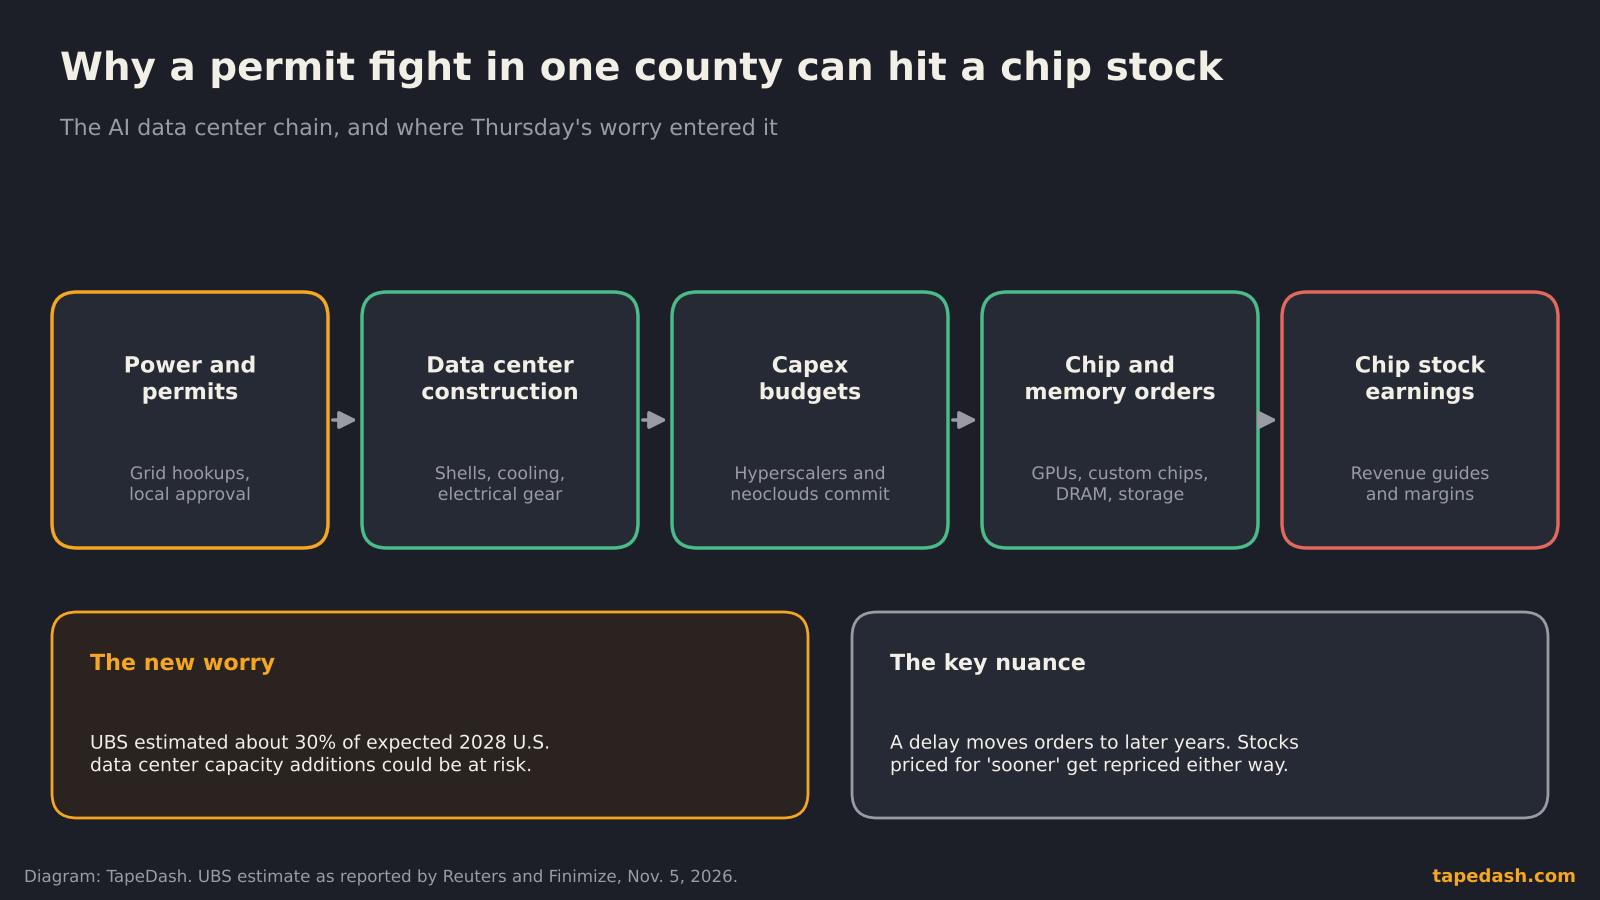
- The trigger was a fear of slower data center construction. UBS estimated about 30% of expected 2028 U.S. capacity additions could be at risk.
- The size of the move came from positioning: crowded longs, profit-taking before year-end, and mechanical selling as volatility jumped about 70%.
- Next tests: the October jobs report on Nov. 6, CPI on Nov. 10, NVIDIA results on Nov. 17 and the Fed on Dec. 8-9.
What happened in the Nasdaq correction on Nov. 5
The headline numbers undersell how lopsided the day was. The further you moved toward AI hardware, the worse it got. The Dow, which holds fewer chip names, fell about 3.4%. The Nasdaq-100 fell 6.4%, per Reuters, and CNN put the drop at more than 6%. The chip index fell twice as hard as that.
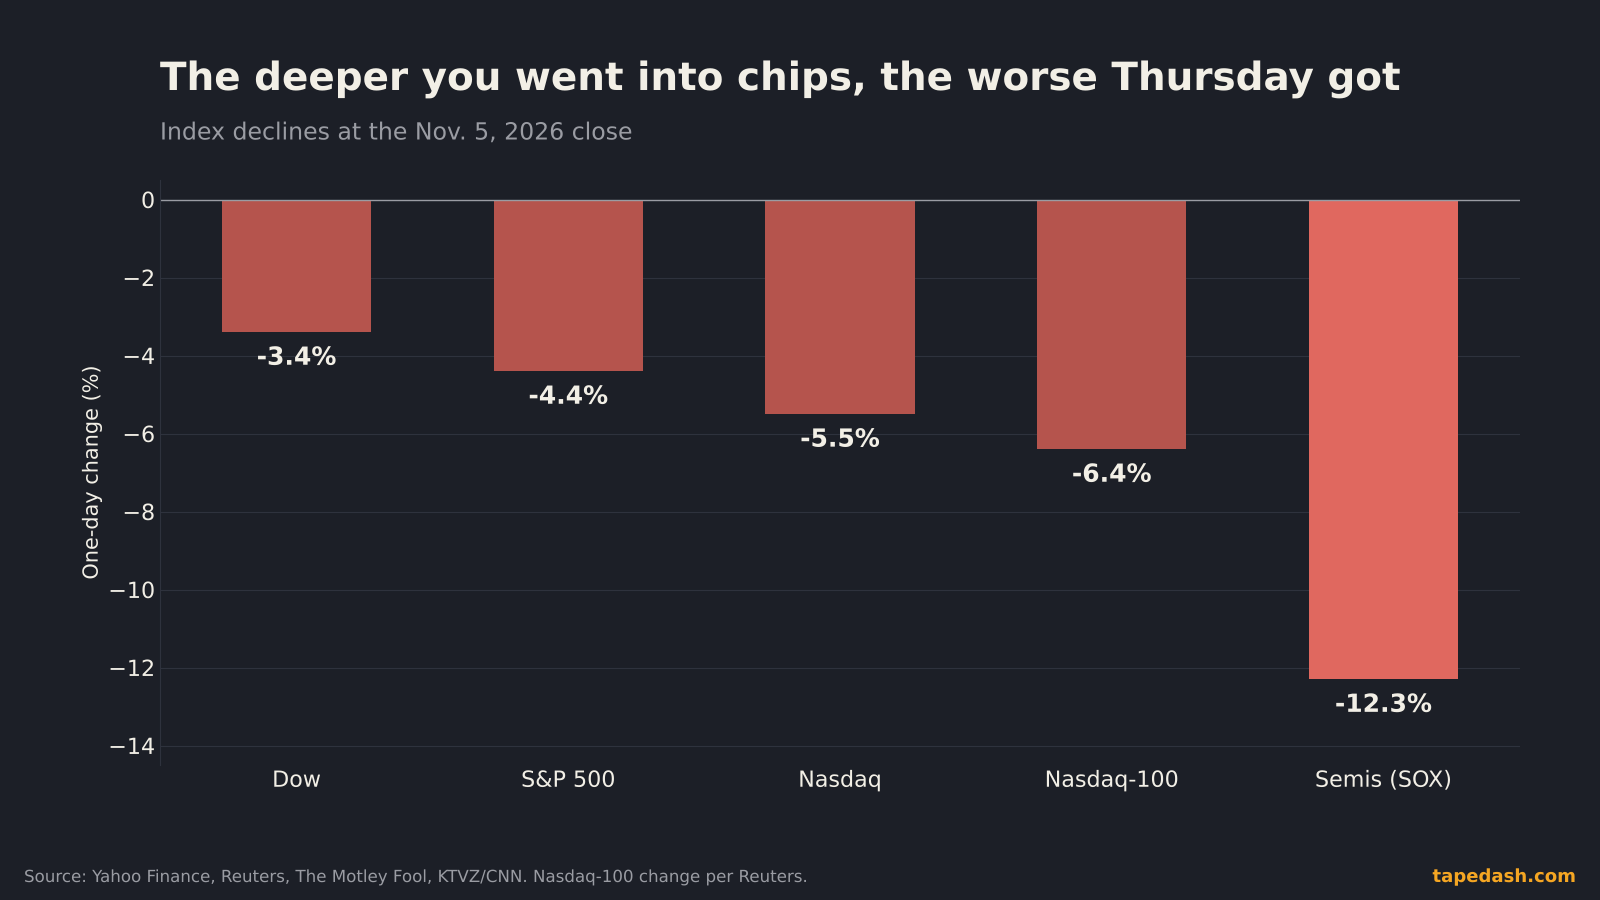
That shape is the first clue. A true macro scare (a bad inflation print, a credit event) tends to hit everything with a similar beta. Thursday did not look like that. Treasury yields slipped, which is what you expect when money hides in bonds, and oil actually rose about 3% with Brent near $98 on Middle East headlines, according to Yahoo Finance and Le Private Banker. Big platform companies held up far better than chipmakers. Amazon and Alphabet fell about 2%, per Reuters and StockTitan. Data center landlords and builders did not. CoreWeave fell about 10%.
When I see a day like that on the desk, I stop asking “what is the market afraid of” and start asking “who owned too much of the thing that fell.” Those are different questions with different answers.
The chip stocks that fell hardest
The losses tracked how directly a company depends on new data center spending. AMD, which has been selling the idea of a second big AI accelerator supplier, closed down 17.26%. Broadcom, the custom-chip and networking name, fell 10.43%. NVIDIA closed at $181.60, down 9.26%, per The Motley Fool and StockTitan. Memory and storage names took double-digit hits too, per CNN, so the selling was not confined to the AI accelerator makers.
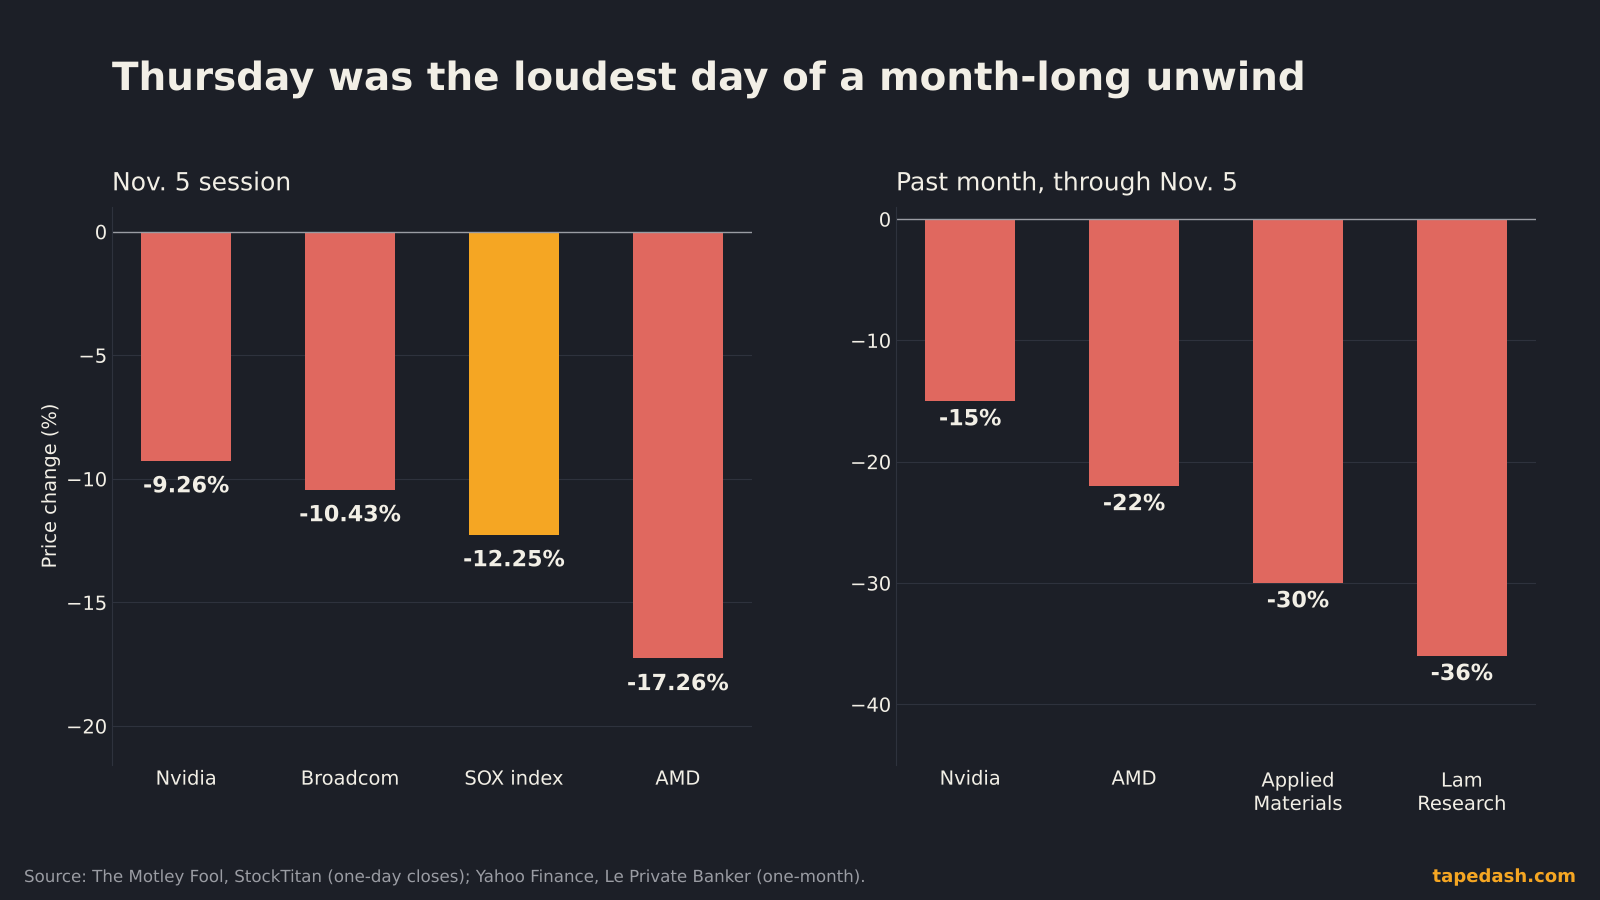
And this did not start on Thursday. Over the past month, Lam Research is down 36%, Applied Materials 30%, AMD 22% and NVIDIA 15%, per Yahoo Finance and Le Private Banker. The equipment makers, the companies that sell tools to build chips, cracked first. That pattern (picks and shovels rolling over before the headline names) is common near the end of a capex boom’s first leg. It is not proof of anything, but it is the kind of tell traders pay attention to in hindsight.
Why chip stocks crashed: the data center worry
The story most people searched for today was about policy, so here it is plainly. After Tuesday’s midterm results shifted control of Congress, investors began to price in more scrutiny of AI data center construction. Some candidates had campaigned on local pushback against big server farms, mostly over electricity costs and land use, and Reuters reported growing local opposition and the fact that many approved projects still need permits.
UBS put a number on the risk. Its analysts estimated that about 30% of expected 2028 U.S. data center capacity additions could be at risk from construction pauses, according to Reuters and Finimize. Finimize’s write-up of the note makes a point worth underlining: the main bottleneck is often the grid connection, and if utilities or regulators push more of the cost of grid upgrades onto developers, marginal projects get delayed, resized or phased in more slowly.
I want to be careful here. A delay is not a cancellation. If a gigawatt campus slips from 2027 to 2028, the chips still get bought, just later. But stock prices are not paid for “eventually.” When a stock trades at a high multiple, a big piece of its value sits in the next two or three years of earnings. Push those orders back a year and the math changes even if the long-run story does not.
Qualcomm added fuel. It reported Wednesday night and its outlook disappointed, with weakness in its phone chip business, according to StockTitan, Le Private Banker and CNN. Qualcomm is not a data center story, but in a nervous tape any chip outlook that misses gets read as a sector signal.
For background on how the spending chain works, our earlier piece on AI capex and chip stocks walks through who gets paid when a hyperscaler raises its budget. Thursday was that chain running in reverse.
How a crowded trade unwinds
Here is the part I think matters most. The news on Thursday was real, but it was not 12%-in-a-day news on its own. A 30% risk to one year’s capacity additions, two years out, is a reason to trim. It does not, by itself, explain a chip index day on track to be the worst since March 2020. Positioning does.
Nomura’s Charlie McElligott described funds taking profits in the year’s best trades, saying they were “shooting the generals,” per Yahoo Finance. When a theme has been the top performer all year, a lot of portfolios own the same names at the same time. Managers who are up big in November have a strong incentive to protect that gain before year-end. They do not need a new thesis to sell. They just need a reason not to keep holding through December.
Retail did not catch the knife either. Retail investors net sold about $358 million of individual U.S. stocks, on pace for their biggest selling day since March 2020, according to Yahoo Finance and Le Private Banker. That matters because retail dip buying has been a steady source of demand on down days for years. When that bid disappears, the floor is lower than people think.
The mechanical sellers
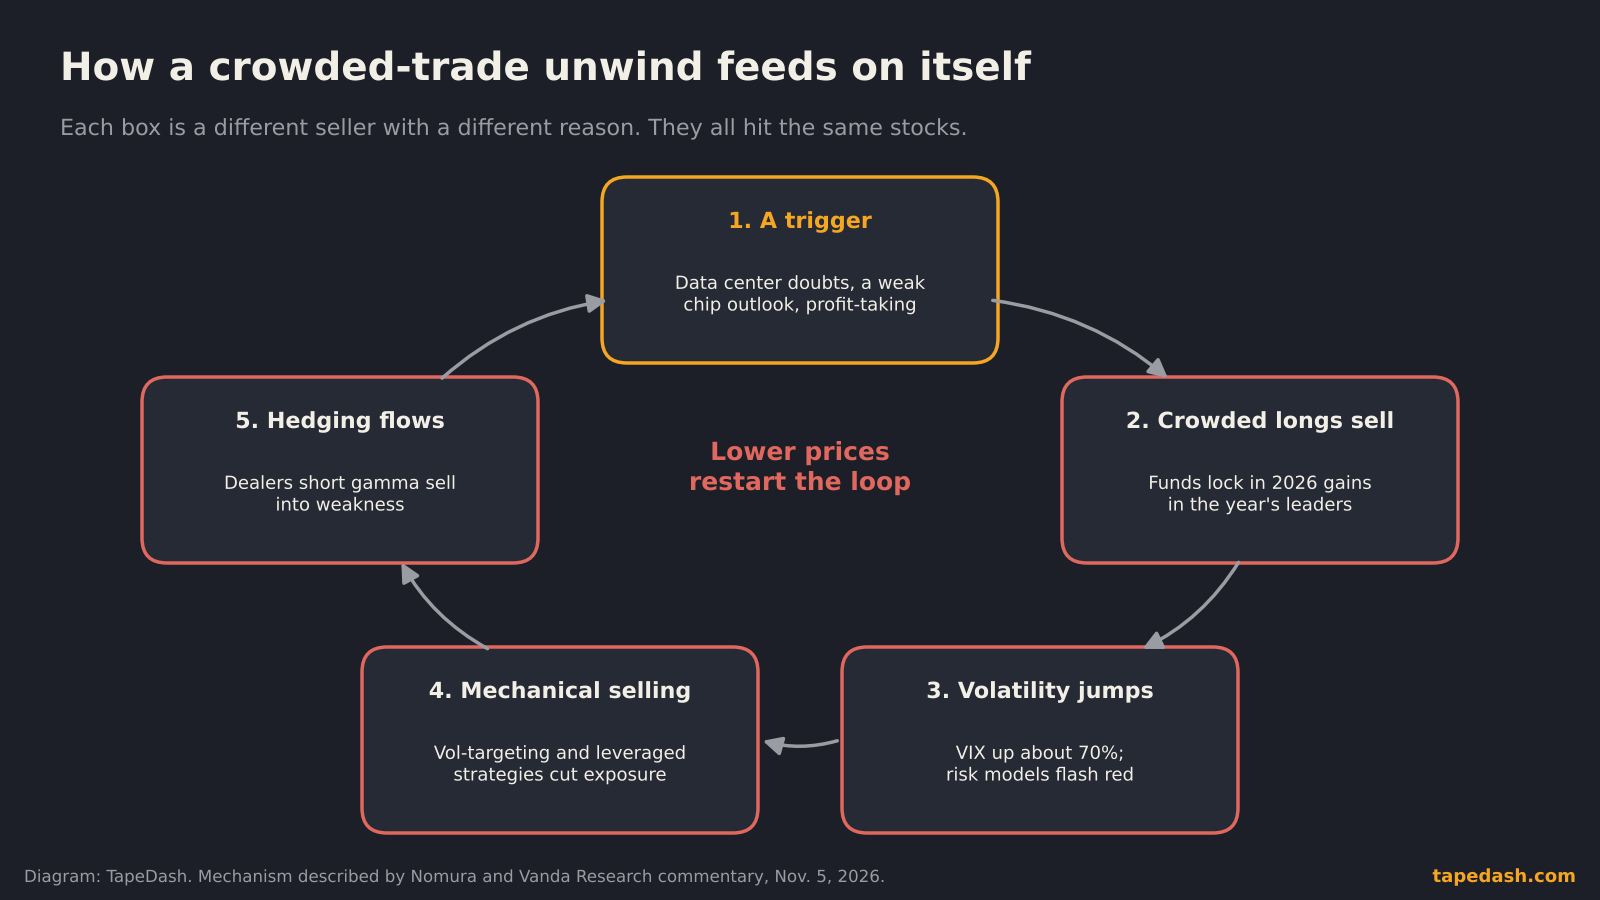
Then volatility does its own damage. The VIX jumped about 70% on Thursday, more than 11 points, to about 28, according to Yahoo Finance, GuruFocus and a CNBC report cited by UA.News. A lot of money is run with rules tied to volatility. Volatility-targeting funds hold more stock when markets are calm and less when they are not. Risk-parity portfolios scale their equity exposure the same way. Leveraged and systematic trend strategies cut exposure as prices break key levels. None of those sellers care about permits in Texas. They care that realized and implied volatility just went up, so the rulebook says sell.
Options dealers can add to the flow. When dealers are net short gamma, the hedge on their books requires them to sell stock as prices fall and buy as prices rise, which makes moves bigger in both directions. I covered how that works in What Is Dealer Gamma?. On a day like Thursday, single-stock put buying in chip names can push dealers into exactly that position, so their hedging lands in the same names everyone else is selling.
Put those together and you get a loop: a trigger, crowded holders selling, volatility rising, rule-based sellers cutting, hedgers selling into weakness, and lower prices restarting the cycle. The loop usually ends not because the news gets better but because the forced sellers run out of things to sell.
How to read a Nasdaq correction as a trader
A correction is just a label for a 10% decline from a high. It is not a forecast. Some corrections turn into bear markets and many do not. What I watch is whether the selling looks forced or looks like a change of mind, because those two resolve very differently.
Forced selling tends to be fast, concentrated in the most crowded names, and indifferent to price. It often fades within days once the mechanical sellers are done. A change of mind, where long-term holders decide the earnings path really is lower, shows up as slower, grinding declines that keep going after volatility calms down. The first can produce sharp rebounds. The second punishes people who buy the first bounce.
Here is the checklist I use to tell them apart in the days after a day like this:
| Signal | Looks like forced selling | Looks like a real repricing |
|---|---|---|
| VIX and term structure | Spikes then fades within days; front month drops back below later months | Stays high; front month stays above later months |
| Breadth | Damage concentrated in one theme; the rest of the market stabilizes quickly | Weakness spreads to sectors outside the theme |
| Leaders vs. laggards | Best names bounce first and hardest | Rallies in leaders get sold, laggards keep falling |
| Volume | Huge on the flush day, then drops off | Stays heavy on down days for weeks |
| Credit | Spreads widen briefly, then settle | Spreads keep widening, especially for leveraged borrowers |
| Company guidance | Next earnings reports reaffirm orders | Orders or guidance get cut |
None of these is decisive alone. Taken together over a week or two, they usually tell you which story the market is telling. For more on reading participation, see our guide to market breadth indicators.
Two mistakes to avoid after a day like this
The first is anchoring on the old high. “NVIDIA was much higher a month ago, so it’s cheap” is not analysis. A stock is worth what its future cash flows justify, and Thursday’s whole point was that the timing of those cash flows got less certain.
The second is treating the bounce as the answer. After violent days, the next session often rallies hard as short sellers cover and forced selling pauses. That bounce tells you almost nothing. The second and third weeks tell you much more.
Who wins and who loses if data center building slows
If the UBS scenario plays out, the pain is not evenly spread. The most exposed companies are the ones whose revenue depends on new capacity coming online soon: AI accelerator and custom-chip makers, memory suppliers, equipment makers, and the “neocloud” operators that borrowed to build GPU capacity. That last group is where I would watch credit as closely as stock prices, because borrowed money turns a delay into a financing problem.
The relative winners are harder to name, because a slowdown is bad for almost everyone in the chain. But some groups get hurt less. The largest cloud platforms already own a lot of capacity, and scarcer new supply can support the pricing of what they already run. Their stocks fell far less than chipmakers on Thursday. Utilities and grid suppliers sit in an odd spot: slower data center approval hurts their growth story, but the reason for the slowdown, strained grids, also says the grid needs more investment regardless.
There is also a second-order effect on the Fed. Markets trimmed the odds of a December rate hike on Thursday, according to StockTitan and CNN. That is the market betting that a sharp drop in stocks cools the economy a little and makes the Fed more cautious. It is a reasonable bet, but inflation still sets the agenda, which is why the next CPI report matters for chip stocks too.
What to watch next after the chip stock selloff
The calendar is busy, and every one of these dates can either calm the unwind or extend it.
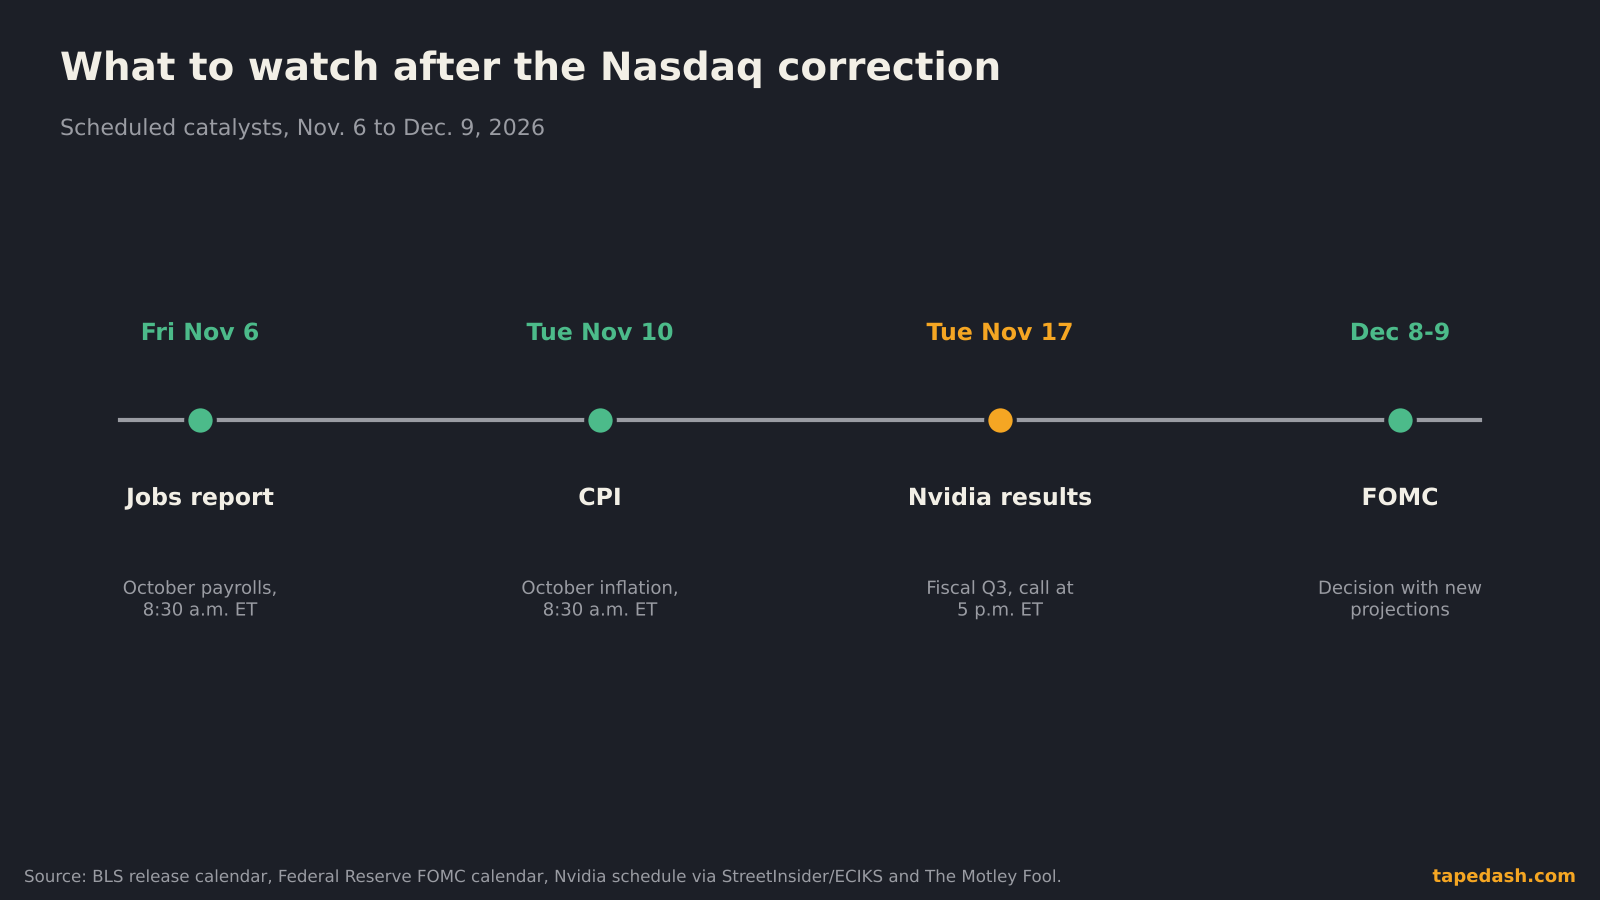
Friday, Nov. 6: the October jobs report. It comes out at 8:30 a.m. ET, per the BLS schedule and Thrive in Markets. A soft number would add to the “Fed eases off” case. A hot number does the opposite. Our jobs report explainer covers which lines move markets.
Tuesday, Nov. 10: October CPI. Also 8:30 a.m. ET, per the same two calendars. If inflation stays sticky, the market’s hope for a gentler Fed fades, and expensive growth stocks are usually the first to feel it.
Tuesday, Nov. 17: NVIDIA’s fiscal third-quarter results. The conference call is set for 5 p.m. ET, per The Motley Fool and ECIKS, which cited StreetInsider. This is the single most important event for the chip complex. What matters is less the quarter and more what management says about order visibility for next year and whether customers are pushing out deliveries. If NVIDIA says its demand pipeline extends well past any construction delays, traders will likely treat Thursday as a positioning flush. If it hints at timing slippage, the repricing camp gets its evidence.
Dec. 8-9: the FOMC meeting. This one comes with a new Summary of Economic Projections, per the Federal Reserve calendar and CNN. Our guide to reading CME FedWatch shows how to track the odds between now and then.
Between those dates, watch the VIX term structure and chip breadth daily. If the VIX settles back toward the low 20s and the equipment makers stop making new lows, the forced-selling story is winning. If credit spreads for data center borrowers keep widening, take that seriously, because credit tends to see trouble before equity does.
FAQ: the Nasdaq correction and chip stocks
Is the Nasdaq in a correction?
Yes. After Thursday’s 5.52% drop, the Nasdaq Composite closed more than 10% below its Oct. 6 record, which meets the standard definition of a correction. A bear market is a 20% decline.
Why did semiconductor stocks fall so much more than the market?
Because the news hit their business directly and because they were the most crowded trade of the year. Concern about slower data center construction lands first on companies that sell chips and tools into new capacity. When many funds own the same names, the selling comes all at once.
Does a slower data center buildout mean AI demand is falling?
Not necessarily. The UBS estimate is about construction timing, mostly tied to power and permits, not about falling demand for AI. A delay can push orders into later years. The problem for stocks is that high valuations depend on near-term earnings, so timing matters a lot.
How we track this at TapeDash
If you want to watch whether this unwind is forced selling that burns out or the start of a longer repricing, these are the things we track every session. The Live Scanner flags unusual options activity in names like NVDA, AMD and AVGO, so you can see whether put buying keeps building or whether traders start reaching for calls again. Heavy put demand that fades while stocks stabilize is often the first sign the panic phase is ending.
The Terminal Preview shows dark pool prints and gamma levels next to price, which is how we tell whether large holders are quietly buying the drop or still distributing. And if you would rather get the read in your inbox, the free TapeDash Daily covers the chip unwind, the VIX term structure and the data calendar each morning before the open. For readers who want the full toolkit, the first 200 members lock Pro at $69.99 a month on their account, even if they cancel and come back later.
The one thing to remember
Thursday combined a real fundamental worry with a positioning problem, and the positioning problem set the size of the move. The data center question will take quarters to answer. The forced-selling question usually gets answered in days or weeks. Watch the VIX, breadth and NVIDIA on Nov. 17, and let the market show you which story it is pricing before you decide what the 12% day meant.
See it on the tape, not just in the headlines
TapeDash is the research desk for traders and investors: live options flow, dealer positioning, a real-time market scanner and trade alerts graded in public. Memberships open Black Friday, November 27, and the first 200 members lock Pro at $69.99 a month on their account, even if they cancel and come back later.
Join the waitlistClick through the terminalSee the track recordSources
- Yahoo Finance: Stock market today, Dow plunges 1,800 points, Nasdaq enters correction in AI trade meltdown (Nov 5, 2026)
- The Motley Fool: Stock Market Today, Nov. 5, Nvidia slides on AI chip selloff (Nov 5, 2026)
- Reuters via Investing.com: Nasdaq 100 eyes $1.8 trillion loss as data center expansion fears hit AI stocks (Nov 5, 2026)
- KTVZ/CNN: Stocks plunge as AI worries crush tech shares (Nov 5, 2026)
- Le Private Banker: S&P 500 plunges 4.3% as semiconductor index sinks 12% (Nov 5, 2026)
- StockTitan: The Stock Market Today Live, November 5, 2026 (Nov 5, 2026)
- Finimize: UBS flags a post-midterms speed bump for data centers (Nov 5, 2026)
- TokenPost: Philadelphia Semiconductor Index nearing worst day since 2020 (Nov 5, 2026)
- GuruFocus: VIX surges 70% amid market volatility on November 5, 2026
- UA.News: US VIX rises by more than 11 points in a day, citing CNBC (Nov 5, 2026)
- BLS: November 2026 release schedule
- Thrive in Markets: Next CPI and NFP release dates 2026
- Federal Reserve: FOMC meeting calendars
- ECIKS: Nvidia to report fiscal 2027 Q3 results, call set for Nov. 17
This article is for educational and informational purposes only. It is not financial, investment, medical or legal advice, and it is not a recommendation to buy or sell any security. Figures come from the sources listed and were checked on the date of publication; markets change quickly. Options trading involves substantial risk of loss.