The Jobs Report Explained: Payrolls, Unemployment and Wages
The jobs report explained in plain English: nonfarm payrolls, the unemployment rate, U-6, wages, revisions and how markets react on release day.
The jobs report is the Bureau of Labor Statistics’ monthly Employment Situation release, and it is two surveys in one. A survey of employers produces nonfarm payrolls, the number of jobs added or lost, plus average hourly earnings. A survey of households produces the unemployment rate. It comes out at 8:30 AM ET, usually on the first Friday of the month, and on most of those Fridays it is the single biggest scheduled event for bonds, the dollar and stock index futures.
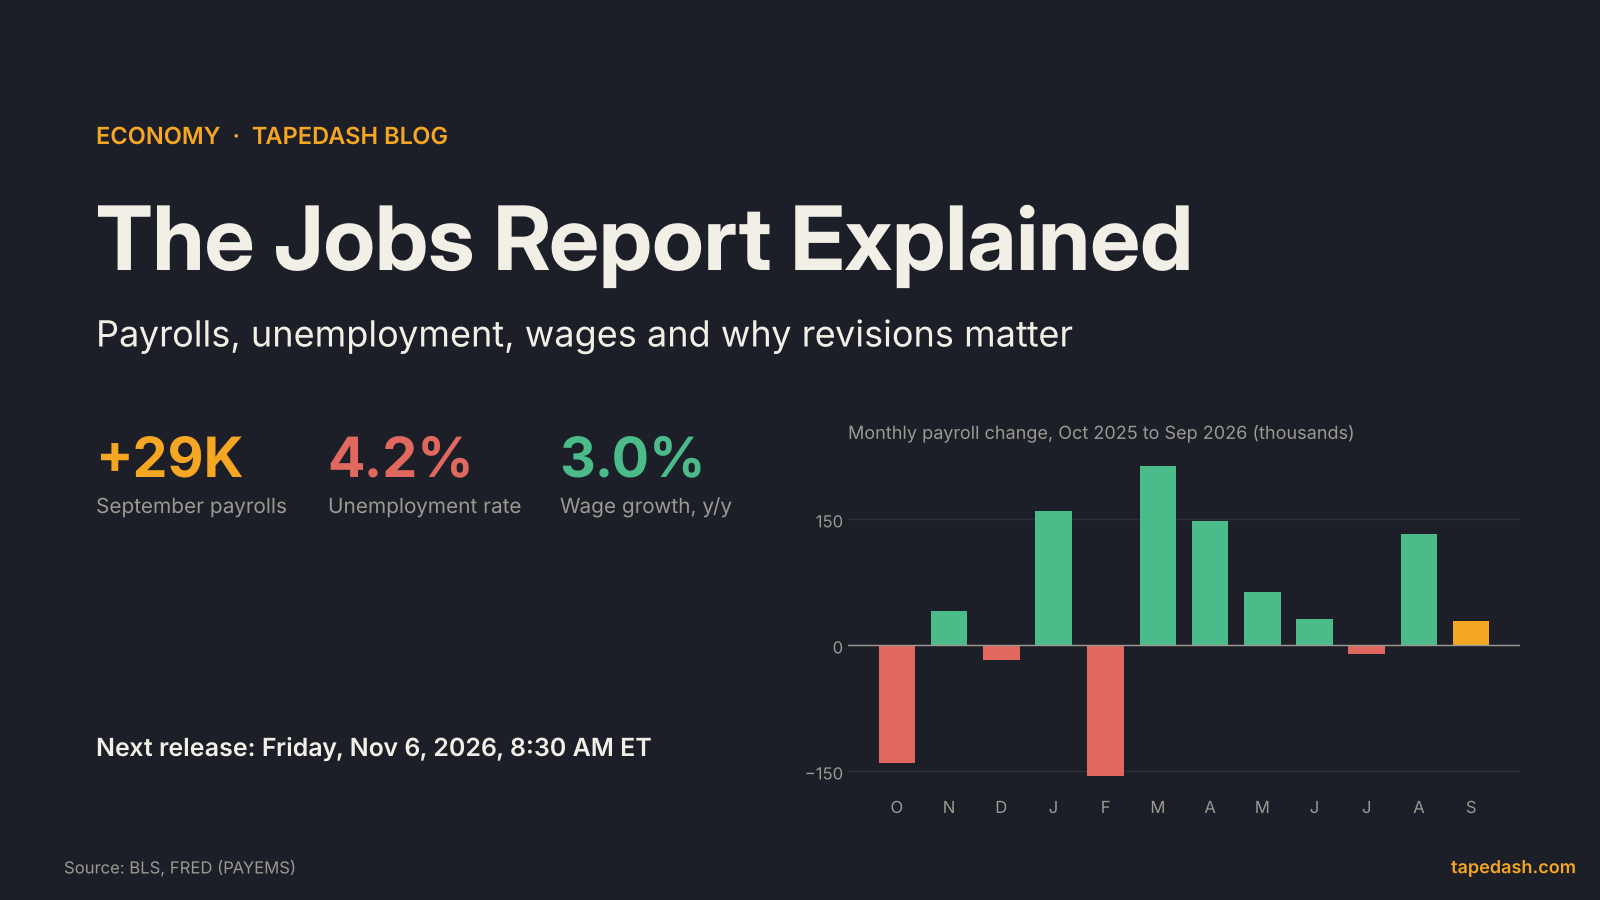
The latest one shows why it deserves the attention. On October 2, the BLS reported that payrolls rose just 29,000 in September, the unemployment rate ticked up to 4.2%, and revisions took 60,000 jobs out of July and August. Economists had expected about 90,000, according to Fox Business and investingLive. Stocks rallied that day because a weak labor market made another Fed hike less likely.
The next report, covering October, is scheduled for Friday, November 6. This guide walks through every number in it, how the two surveys can disagree, why the first print is only a draft, and how to read the release the way a trading desk does.
- The jobs report combines an establishment survey (payrolls, wages, hours) and a household survey (unemployment rate, U-6, participation). They measure different things and can disagree.
- September 2026: payrolls +29,000 against about 90,000 expected, unemployment 4.2%, wages up 3.0% from a year earlier, and 60,000 jobs revised out of July and August.
- Revisions matter. Payrolls are revised twice, then benchmarked once a year. The preliminary benchmark for the year to March 2025 cut 911,000 jobs; the one for the year to March 2026 cut just 79,000.
- Markets trade the jobs report through rate expectations: weak data can lift stocks when inflation is the bigger worry, as it did on October 2.
- Read it alongside JOLTS, ADP and weekly jobless claims. The October report is due Friday, November 6, at 8:30 AM ET.
What is the jobs report?
The official name is The Employment Situation, and it is published by the Bureau of Labor Statistics, part of the Labor Department. Every month it answers three questions: how many jobs the economy added, how many people are looking for work and cannot find it, and how fast pay is rising.
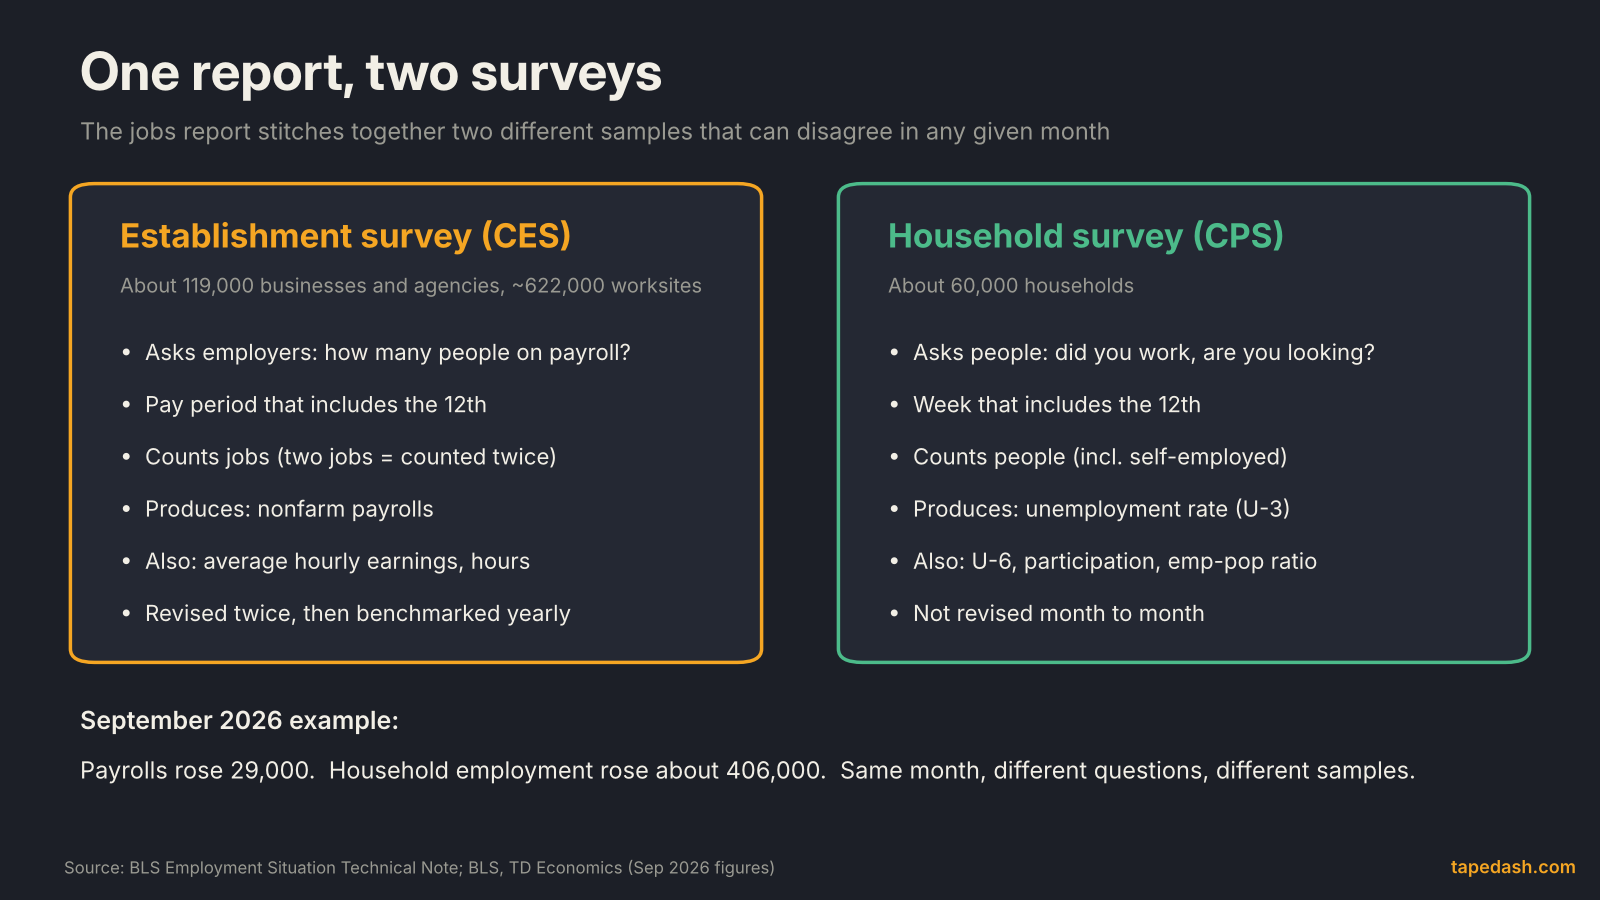
The report draws on two separate surveys, and almost every confusing jobs Friday comes from forgetting that. According to the BLS technical note, the establishment survey (the Current Employment Statistics program, or CES) samples about 119,000 businesses and government agencies covering roughly 622,000 worksites. The household survey (the Current Population Survey, or CPS) samples about 60,000 households. LegalClarity’s summary of the two surveys gives the same figures.
Establishment survey vs household survey
The establishment survey asks employers how many people were on the payroll during the pay period that includes the 12th of the month. It counts jobs, so someone with two jobs is counted twice. It produces the headline nonfarm payroll number plus average hourly earnings and the average workweek.
The household survey asks people about their own situation during the week that includes the 12th. It counts people, once each, and it includes groups the payroll survey misses, such as the self-employed and farm workers. It produces the unemployment rate, the participation rate and the broader U-6 measure.
September 2026 is a good example of how far apart they can drift. Payrolls rose 29,000, but household survey employment rose about 406,000, according to TD Economics and investingLive. The household survey has a much smaller sample, so it swings more month to month. On the desk we treat payrolls as the better read on hiring and the household survey as the better read on slack, and we only get worried when both point the same way for a few months.
Nonfarm payrolls: the headline number
Nonfarm payrolls is the net change in the number of jobs on employer payrolls, excluding farm work. It is a net figure: a month with 1 million hires and 980,000 separations shows up as roughly +20,000.
In September, private employers added 46,000 jobs and government shed 17,000, figures reported by both Fox Business and TD Economics. Health care added about 17,000, construction 11,000 and manufacturing 9,000, while financial activities lost 7,000, per the BLS release.
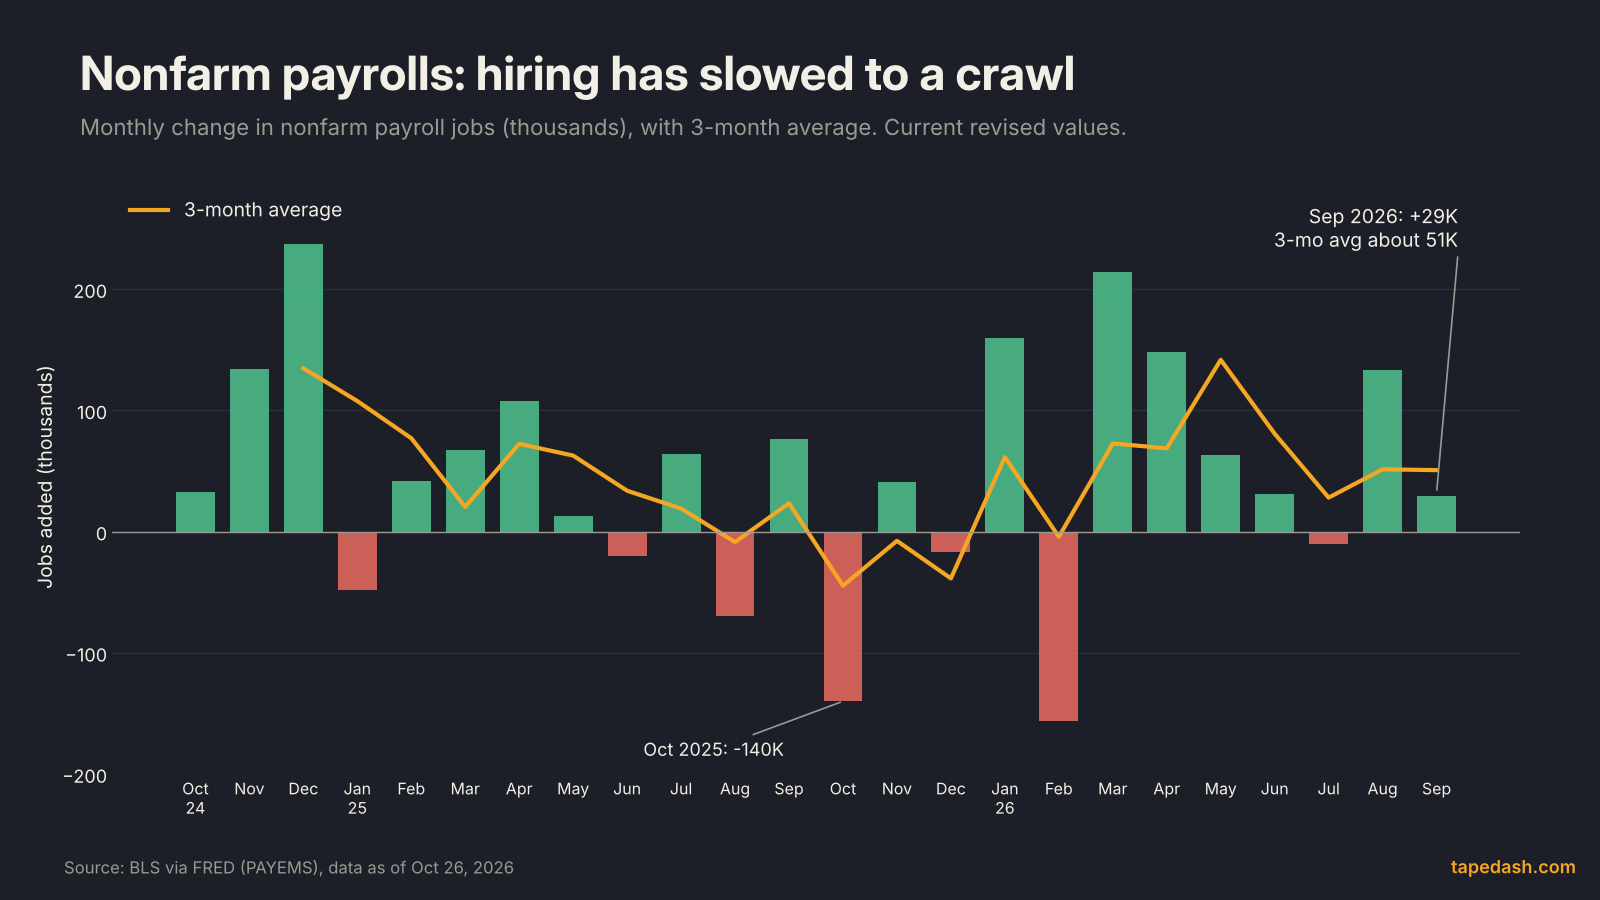
Two habits make the headline more useful. First, look at the 3-month average. July, August and September now stand at -10,000, +133,000 and +29,000, which averages about 51,000 a month, the same figure TD Economics cites. Single months are noisy; the average is the trend.
Second, respect the error band. The BLS says a monthly payroll change needs to be about 122,000 in either direction to be statistically significant at the 90% confidence level, a point LegalClarity also makes. A 29,000 print and a 90,000 forecast sit inside that band. The market still reacts to the gap, because the market trades surprises, but a single miss is weaker evidence than it feels like at 8:31 AM.
Unemployment rate: U-3 vs U-6
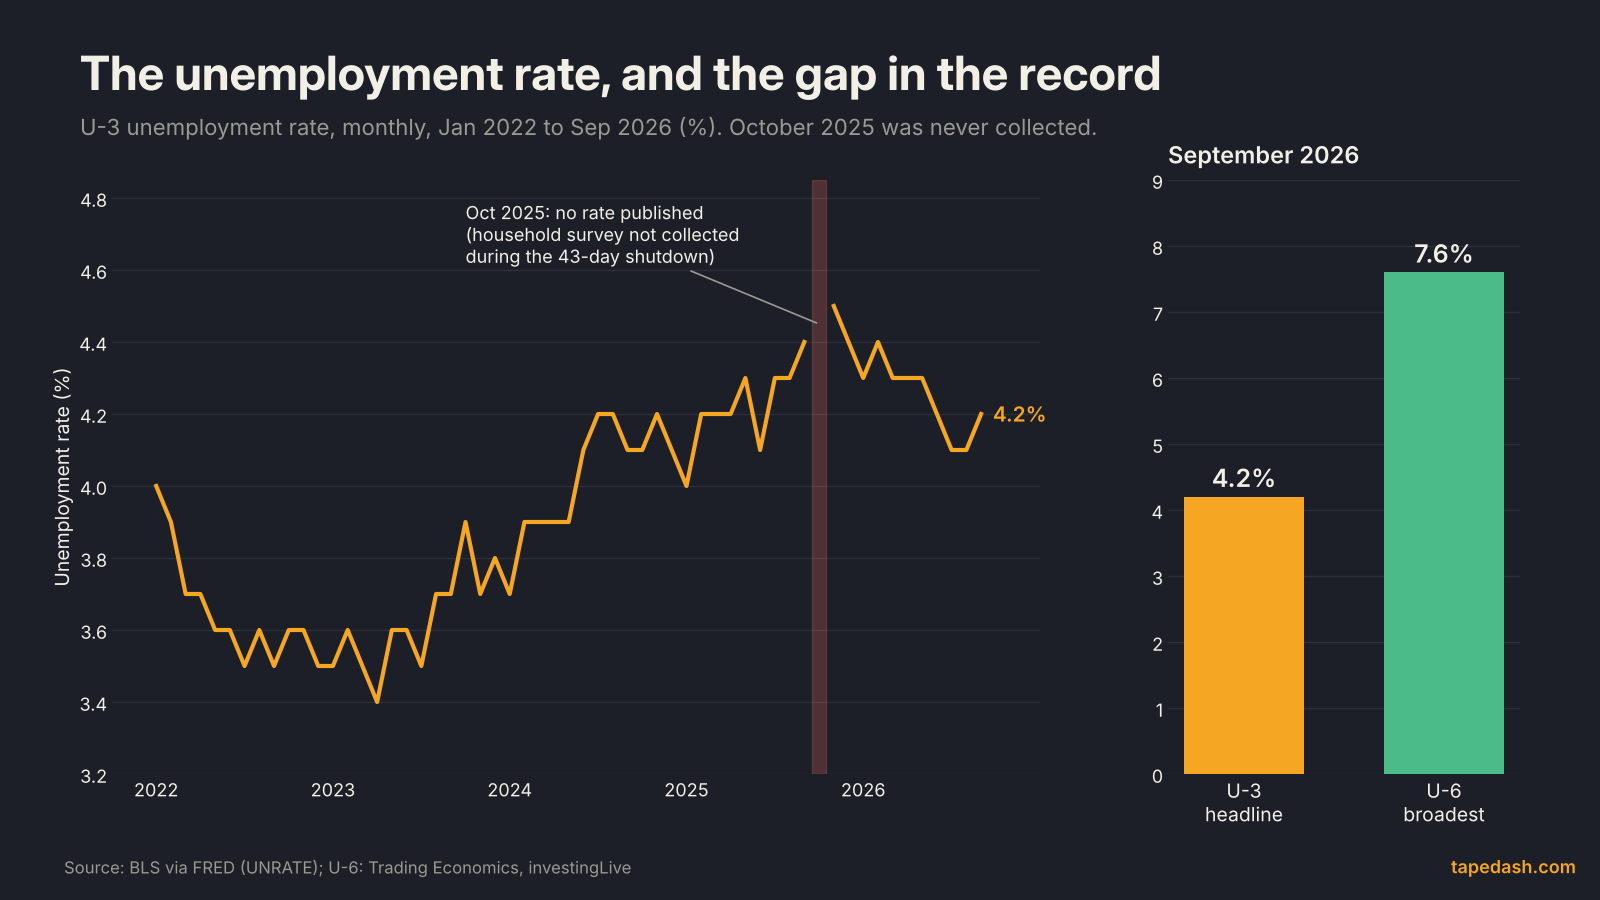
The headline unemployment rate, officially U-3, is the share of the labor force that has no job, is available to work and has actively looked in the past four weeks. In September it rose to 4.2% from 4.1%, with 7.1 million people unemployed, per the BLS and Trading Economics.
U-6 is the broadest measure. It adds people who want a job but have stopped looking, plus part-time workers who want full-time hours and cannot get them. U-6 was 7.6% in September, down from 7.7%, according to Trading Economics and investingLive. U-3 up and U-6 down in the same month is a reminder that the labor market rarely moves in a straight line.
Read the unrounded rate and participation
The unemployment rate is published to one decimal, which hides a lot. September’s rate was 4.175% before rounding, per TD Economics and investingLive, barely over the line that turns 4.1% into 4.2%. Headlines said “unemployment rises.” The unrounded number said “unemployment barely moved.”
Participation is the other check. The labor force participation rate was 61.8% and the employment-population ratio was 59.2%, per the BLS and Fox Business. The unemployment rate can rise for a good reason (more people entering the labor force to look for work) or a bad one (people losing jobs). September’s household survey showed the labor force growing, which is the less worrying version.
Average hourly earnings and the wage question
Average hourly earnings come from the payroll survey and are the market’s quickest read on wage pressure. In September they rose 0.1% for the month and 3.0% from a year earlier, per the BLS and TD Economics. Economists had expected 3.2% for the yearly rate, according to Fox Business and investingLive.
When inflation is the Fed’s main worry, wages can matter more than the headline. A strong payroll number with soft wages tells you hiring is healthy without feeding inflation. A weak payroll number with hot wages is the awkward mix for bonds. I watch the monthly change more than the yearly one, because the yearly figure carries eleven months of old news.
One quirk: average hourly earnings is an average, so the mix of who is working moves it. If lower-paid jobs are cut, the average rises even though no one got a raise. That effect was enormous in 2020 and is small in normal months, but it is why economists also track other wage gauges such as the Employment Cost Index. If you trade around inflation data too, our guide on how to read the CPI report covers the other half of the Fed’s problem.
Why jobs report revisions matter
The first payroll number is an estimate built from the employers who responded in time. The BLS revises each month twice as more surveys come in, according to its technical note, and then benchmarks the whole series once a year to near-complete counts from state unemployment insurance records.
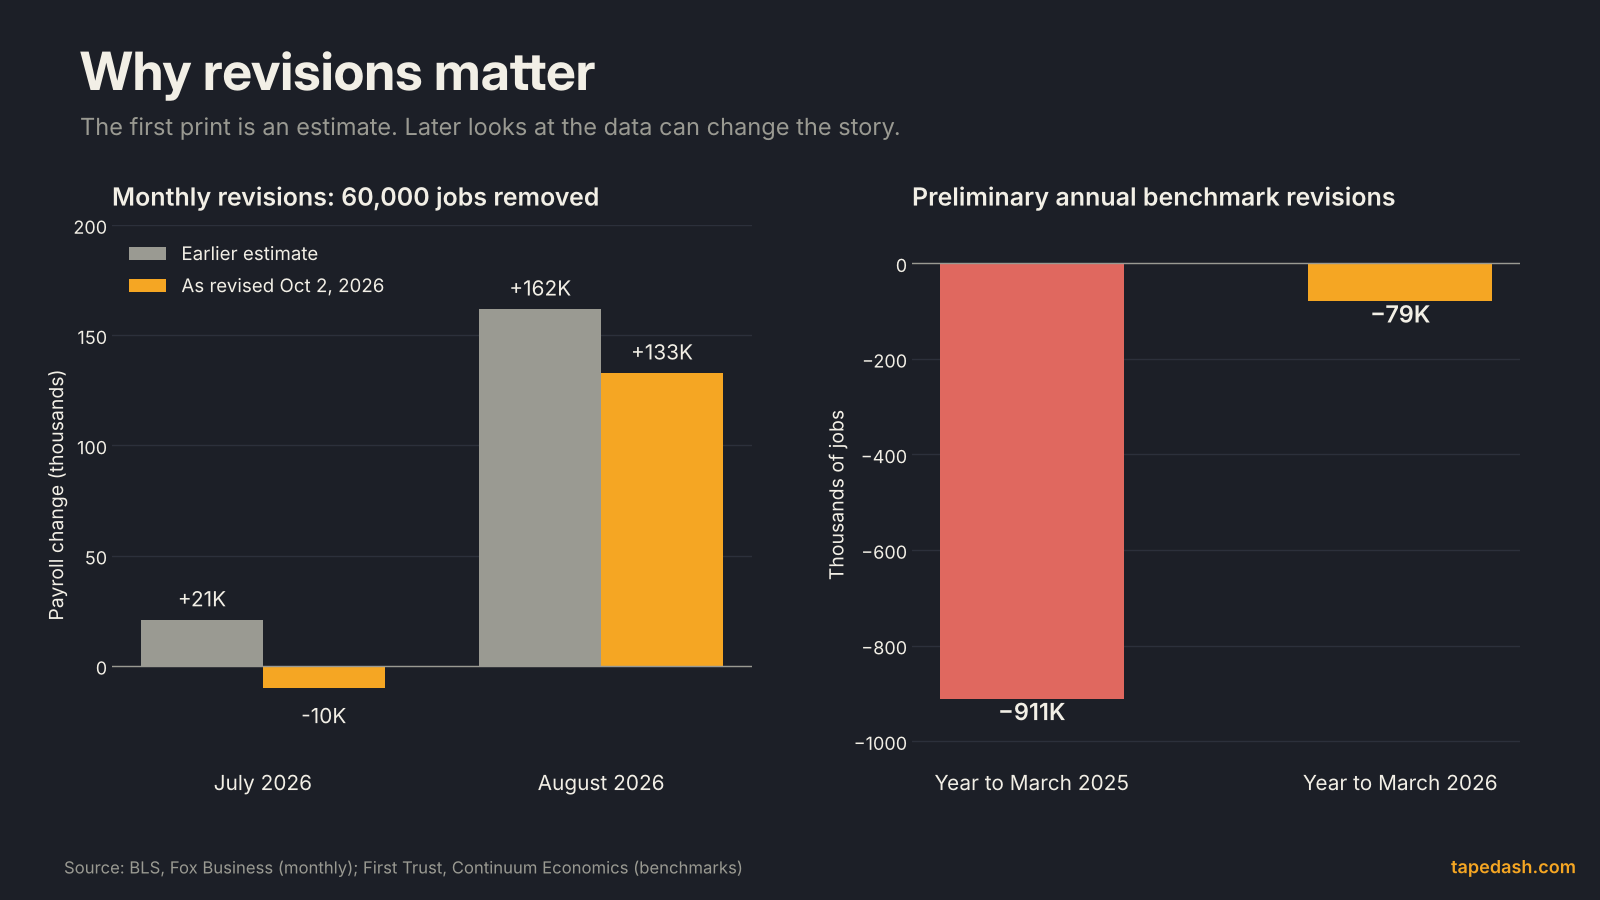
The monthly revisions in the latest report were not small. July was revised from +21,000 to -10,000, and August from +162,000 to +133,000, a combined 60,000 fewer jobs, per the BLS and Fox Business. August first came out at +162,000 against an expected gain of about 55,000, per First Trust. Traders who read that print as a strong rebound were trading a number that later shrank by almost a fifth.
The annual benchmark revision
The benchmark is where the big numbers live. The preliminary estimate for the year to March 2025 cut 911,000 jobs, according to First Trust and Continuum Economics. The preliminary estimate for the year to March 2026, released in late August, cut just 79,000, or about 0.1%, per First Trust and Continuum. Both note it will be folded into the official data with the January 2027 report in February.
The practical lesson: when you judge the labor market, use the revised history, not the headlines you remember. The payroll chart above uses current, revised values from FRED, and it looks different from the string of first prints that moved markets at the time.
The birth-death model
Part of the revision story is the birth-death model. A survey of existing employers cannot see brand-new businesses until they show up in the sample, and it cannot always tell a closed business from one that simply did not respond. The BLS explains that it handles this in two steps. First, businesses that close are not counted as job losses; they are assigned the same trend as other firms in the sample. Second, a statistical forecast estimates the remaining net effect of business openings and closings, based on five years of unemployment insurance data.
That works well in steady times and can miss at turning points, which is one reason the 2025 benchmark was so large. Starting with the January 2026 data, the BLS changed the model to use current sample information in its forecasts, a change noted by both the BLS and First Trust. The much smaller 2026 preliminary benchmark suggests the gap has narrowed, though the final number is still to come.
When the jobs report doesn’t come out on time
Government funding lapses have interrupted the report twice since October 2025, and both episodes are still visible in the data.
During the 43-day shutdown in October and November 2025, the September 2025 report, originally due October 3, was pushed to November 20, according to PYMNTS and the San Joaquin Valley Sun. The household survey for October 2025 could not be collected, so the BLS did not publish an October employment report and instead released October payrolls together with November’s data, as Reuters reported. That is why the FRED unemployment series has a hole at October 2025.
Then a partial shutdown that began at the end of January 2026 delayed the January jobs report from February 6 to February 11, per CBS News and ROIC.ai. For traders, the lesson is practical: when the official report goes dark, private data and weekly claims carry more weight, and volatility can bunch up around whichever release arrives first.
How markets react to the jobs report
The jobs report moves markets mainly through one channel: what it implies for Federal Reserve policy. The reaction usually runs in order. Fed funds futures reprice first, the 2-year Treasury yield moves the most, the dollar and the 10-year follow, and stocks react to the net of better growth and higher rates. If you want to see how those odds are read, our guide to reading FedWatch and fed funds futures covers it, and the yield curve explainer shows why the 2-year reacts more than the 10-year.
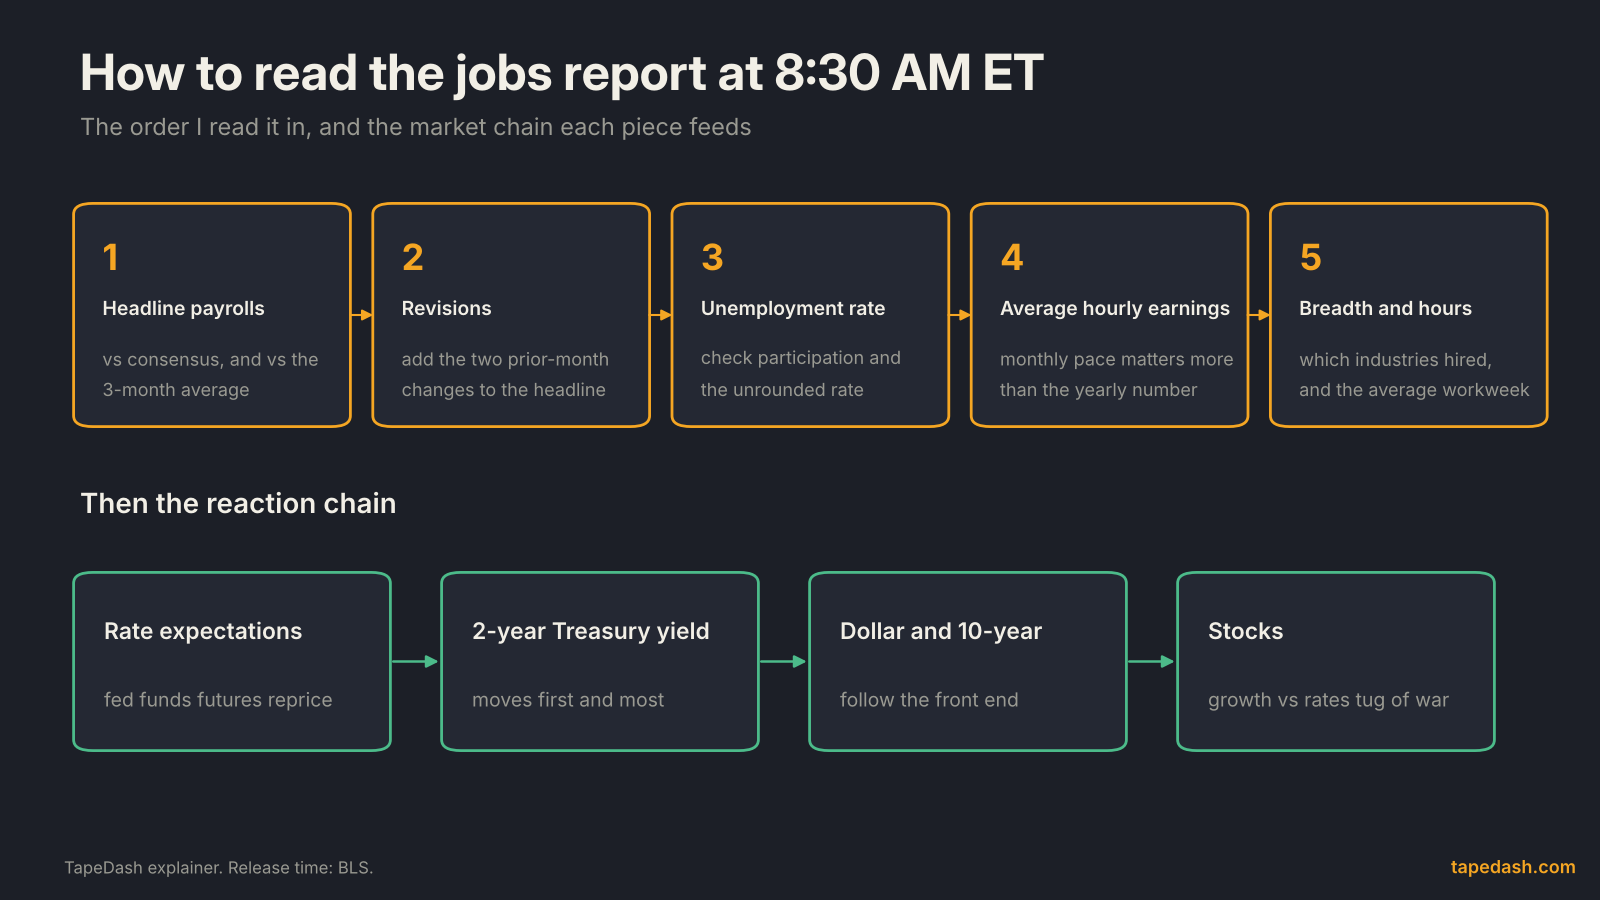
“Good news is bad news” is the shorthand for when inflation is the bigger problem. October 2 showed it clearly. With markets debating another Fed hike, the weak report cut those odds, and the S&P 500 closed up 0.7% while the Nasdaq rose 1.2%, according to La Nacion and STL.News. Treasury yields fell right after the release and then gave back part of the drop later in the day, per Penn Mutual Asset Management and STL.News. The first move is often not the last one.
The relationship flips when growth is the worry. If the market already expects rate cuts, a very weak report can read as recession risk, and stocks fall with yields. Before each release I ask which problem the market is pricing, inflation or growth, because that decides whether a miss is bullish or bearish for stocks.
How to read the jobs report: a release-day checklist
This is the order I read it in, and it takes about five minutes.
- Headline payrolls vs consensus, then against the 3-month average. A miss inside the 122,000 error band is a nudge, not a verdict.
- Revisions. Add the two prior-month changes to the headline. A +150,000 print with -100,000 of revisions is a weak report.
- Unemployment rate, then the unrounded rate and participation. Ask whether it rose because people lost jobs or because more people started looking.
- Average hourly earnings, month over month. In an inflation scare, this can matter more than payrolls.
- Breadth and hours. Check whether hiring is spread across industries or concentrated in one or two, and whether the average workweek is shrinking. Shorter hours often show up before layoffs.
- The market’s read. Watch the 2-year yield and fed funds futures for the first 15 minutes before drawing conclusions from stock index futures.
The companion reports: JOLTS, ADP and jobless claims
Three other releases fill in the picture, and in a jobs week they arrive in a set order.
JOLTS (Job Openings and Labor Turnover Survey) is also from the BLS and runs a month behind the jobs report. It shows demand for workers and how freely people move. In August, openings were about 7.1 million, with 5.2 million hires, 3.1 million quits and 1.6 million layoffs, per the BLS and Trading Economics. Low hires and low layoffs together describe a labor market where few people are being fired but few are being hired either.
ADP’s National Employment Report is a private estimate built from ADP’s own payroll processing data, released two days before the official report. It covers private employers only and often diverges from the BLS. In September, ADP reported private payrolls up 90,000, with August revised to 36,000, figures also reported by Allwork.Space. The official private payroll number two days later was 46,000. Treat ADP as a separate data point, not a forecast of Friday.
Weekly jobless claims from the Labor Department are the most timely labor data there is, published every Thursday. Initial claims were 194,000 in the week ending October 17, per ForexCracked and JM Financial. Claims that low say layoffs are rare, which fits the low-hire, low-fire picture from JOLTS. A sustained rise in claims would be the early warning that the slowdown in hiring is turning into job losses.
| Report | Publisher | What it measures | Timing | Latest reading |
|---|---|---|---|---|
| Employment Situation | BLS | Payrolls, unemployment rate, wages, hours | Monthly, 8:30 AM ET, usually first Friday | Sep: +29,000 jobs, 4.2% unemployment |
| JOLTS | BLS | Job openings, hires, quits, layoffs | Monthly, 10:00 AM ET, about a month later | Aug: 7.1 million openings |
| ADP National Employment Report | ADP | Private payrolls from ADP’s client data | Monthly, 8:15 AM ET, two days before the jobs report | Sep: +90,000 private jobs |
| Weekly jobless claims | U.S. Labor Department | New filings for unemployment benefits | Every Thursday, 8:30 AM ET | Week ending Oct 17: 194,000 |
What to watch next
The next jobs week runs November 3 to 6, and it lands right after today’s Fed decision, so the data will be read as a test of whatever the Fed signals.
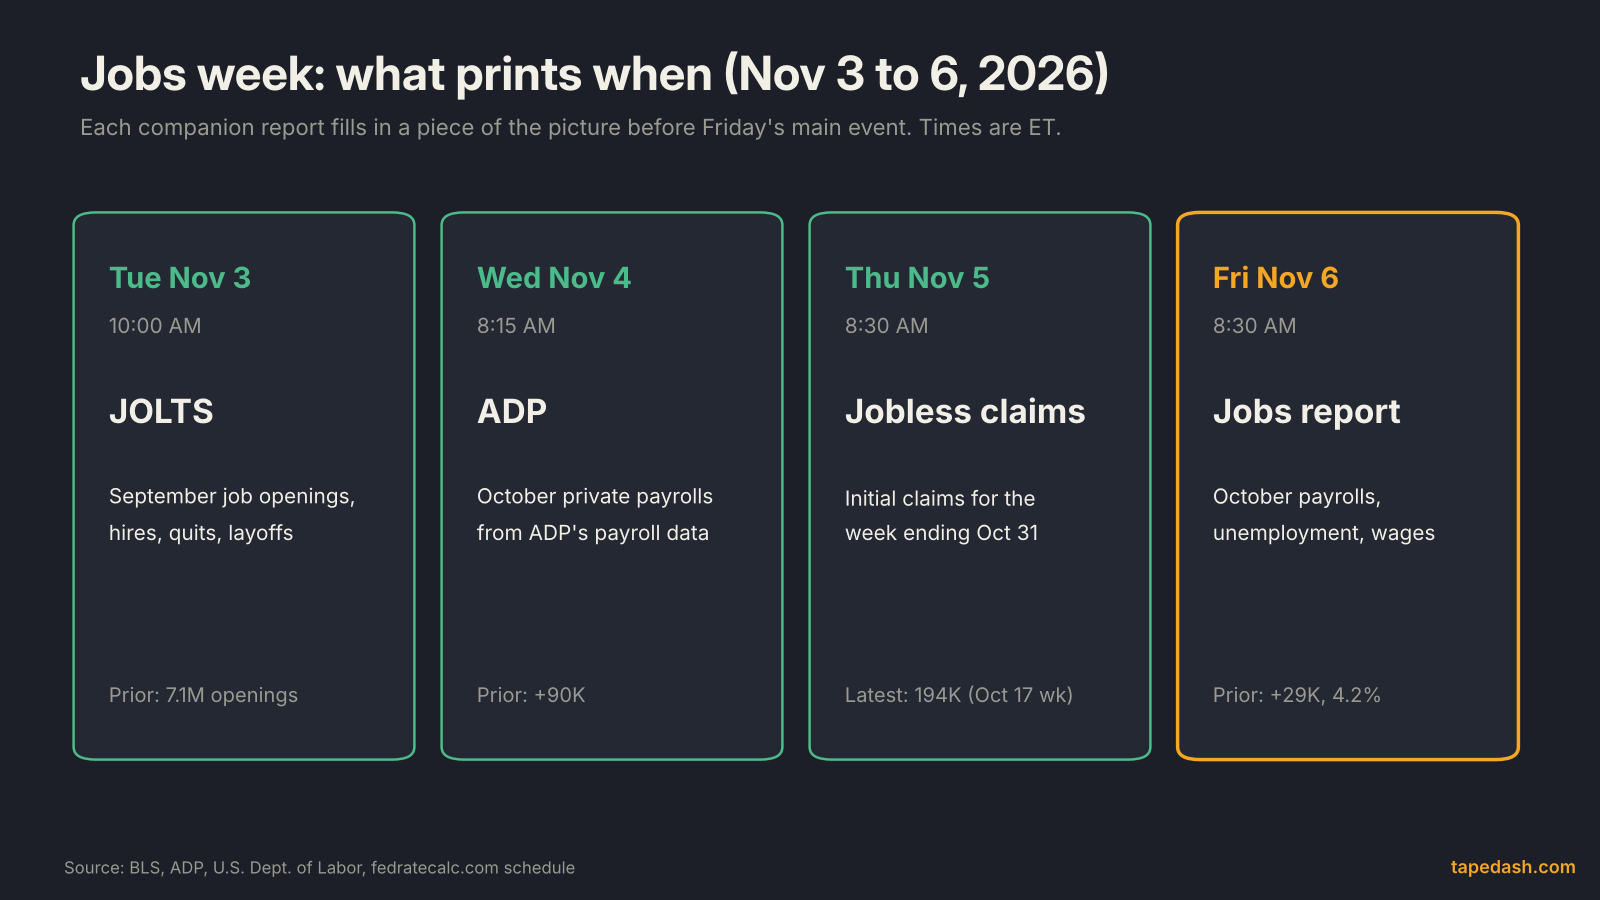
- Thursday, October 29, 8:30 AM ET: weekly jobless claims, a quick check on whether layoffs are still as low as the October 17 reading.
- Tuesday, November 3, 10:00 AM ET: JOLTS for September, per the BLS and fedratecalc.
- Wednesday, November 4, 8:15 AM ET: ADP’s October report, per ADP’s release schedule.
- Friday, November 6, 8:30 AM ET: the October jobs report, per the BLS, fedratecalc and Thrive in Markets. Watch whether the 3-month average stays near 50,000 or slips further, and whether unemployment holds at 4.2%.
- Tuesday, November 10, 8:30 AM ET: October CPI, per fedratecalc and Thrive in Markets. Weak jobs plus cooling inflation would be read very differently from weak jobs plus hot inflation.
If payrolls rebound and wages firm up, traders will watch for hike odds to climb back and for the 2-year yield to lead. If payrolls stay near zero and claims start rising, the conversation shifts from inflation to growth, and the stock reaction to weak data could turn negative.
How to track the jobs report on TapeDash
If you want to see each of these numbers in one place without rebuilding a spreadsheet, this is what we built. The Economy page in TapeDash has a card for nonfarm payrolls, the unemployment rate, initial jobless claims and JOLTS job openings, each with up to ten years of history, the latest value, the change from the prior reading, the next release date and a plain-English “how to read it” write-up. Its release calendar shows actual, consensus and prior for every report and fills in actuals within a couple of minutes of the release. Like the payroll chart in this post, the history uses revised values, so the trend you see is the trend after revisions.
On the Chart Desk, the economic calendar layer draws a dashed line on any chart at each market-moving release, including the jobs report, with a countdown to the next release in the chart header. That makes it easy to see how a stock or index ETF behaved into and out of past jobs Fridays. For the rate side, Macro & Regime tracks the Treasury curve and policy backdrop that the jobs report feeds into. You can click through all three pages in the Terminal Preview, free and without an account; the preview shows each page’s layout with sample numbers, and members see the live data.
If you would rather get the read after the close, the free TapeDash Daily covers each data release and what it did to rates and stocks, and the first 200 members lock Pro at $99 a month for as long as they stay.
Jobs report FAQ
What time does the jobs report come out?
The Employment Situation report is released at 8:30 AM Eastern time, usually on the first Friday of the month. The October 2026 report is scheduled for Friday, November 6. A government shutdown can delay it, as happened in late 2025 and again in early 2026.
Why do payroll numbers get revised?
The first estimate uses the employer surveys that arrived in time. Each month is revised twice as late responses come in, and the whole series is benchmarked once a year to unemployment insurance records that cover nearly every employer. In the latest report, revisions removed 60,000 jobs from July and August combined.
What is the difference between U-3 and U-6 unemployment?
U-3 is the headline rate: people without a job who are available and actively looked in the past four weeks. U-6 adds discouraged and other marginally attached workers plus people working part time who want full-time work. In September 2026, U-3 was 4.2% and U-6 was 7.6%.
The one idea to keep
The jobs report is a first draft from two surveys that answer different questions, released in a single number that markets trade within seconds. Read it in layers: the 3-month trend over the headline, revisions alongside the new month, the unrounded unemployment rate and participation, then wages. And before the release, decide whether the market is worried about inflation or growth, because that decides which way a surprise cuts.
See it on the tape, not just in the headlines
TapeDash is the research desk for traders and investors: live options flow, dealer positioning, a real-time market scanner and trade alerts graded in public. Memberships open January 1, 2027, and the first 200 members lock Pro at $99 a month for as long as they stay.
Join the waitlistClick through the terminalSee the track recordSources
- U.S. Bureau of Labor Statistics: The Employment Situation, September 2026
- U.S. Bureau of Labor Statistics: Employment Situation Technical Note
- U.S. Bureau of Labor Statistics: CES Birth-Death Model
- U.S. Bureau of Labor Statistics: Job Openings and Labor Turnover, August 2026
- Federal Reserve Bank of St. Louis, FRED: All Employees, Total Nonfarm (PAYEMS)
- Federal Reserve Bank of St. Louis, FRED: Unemployment Rate (UNRATE)
- Fox Business: US economy added 29,000 jobs in September, a slower pace than expected
- TD Economics: U.S. Employment, September 2026
- investingLive: US September non-farm payrolls +29K vs +90K expected
- Trading Economics: US Unemployment Rate Rises to 4.2% in September
- Trading Economics: US Job Openings Miss Forecasts
- First Trust: Nonfarm payrolls increased 162,000 in August
- First Trust: BLS payroll revisions fall back in line, down just 79,000
- First Trust: Another massive payroll revision
- Continuum Economics: U.S. March 2026 non-farm payroll benchmark revised down by a marginal 79k
- ADP National Employment Report, September 2026 (via Finviz)
- Allwork.Space: U.S. private hiring picks up in September as ADP reports 90,000 new jobs
- ForexCracked: US initial jobless claims unexpectedly decline to 194,000
- JM Financial: US weekly jobless claims, Oct 23, 2026
- Reuters via TradingView: US canceling October's employment report after shutdown prevented data collection
- San Joaquin Valley Sun: Bureau of Labor Statistics cancels October employment report due to shutdown
- PYMNTS: BLS to release September employment data on Nov. 20
- CBS News: Jobs report delayed by government shutdown, January 2026
- ROIC.ai: BLS reschedules January employment report for February 11
- La Nacion: How major US stock indexes fared Friday 10/2/2026
- STL.News: Stock market rallies on Friday, Oct. 2, 2026
- Penn Mutual Asset Management: Soft jobs report cools hike bets as yields hold near multi-decade highs
- LegalClarity: Household survey vs establishment survey, key differences
- fedratecalc: US economic calendar, November 2026
- Thrive in Markets: NFP release dates 2026
- Thrive in Markets: CPI release dates 2026
This article is for educational and informational purposes only. It is not financial, investment, medical or legal advice, and it is not a recommendation to buy or sell any security. Figures come from the sources listed and were checked on the date of publication; markets change quickly. Options trading involves substantial risk of loss.