How to Read CME FedWatch and Fed Funds Futures
CME FedWatch turns fed funds futures prices into Fed rate odds. Here is how the math works, how to read the screen, and where the numbers can mislead you.
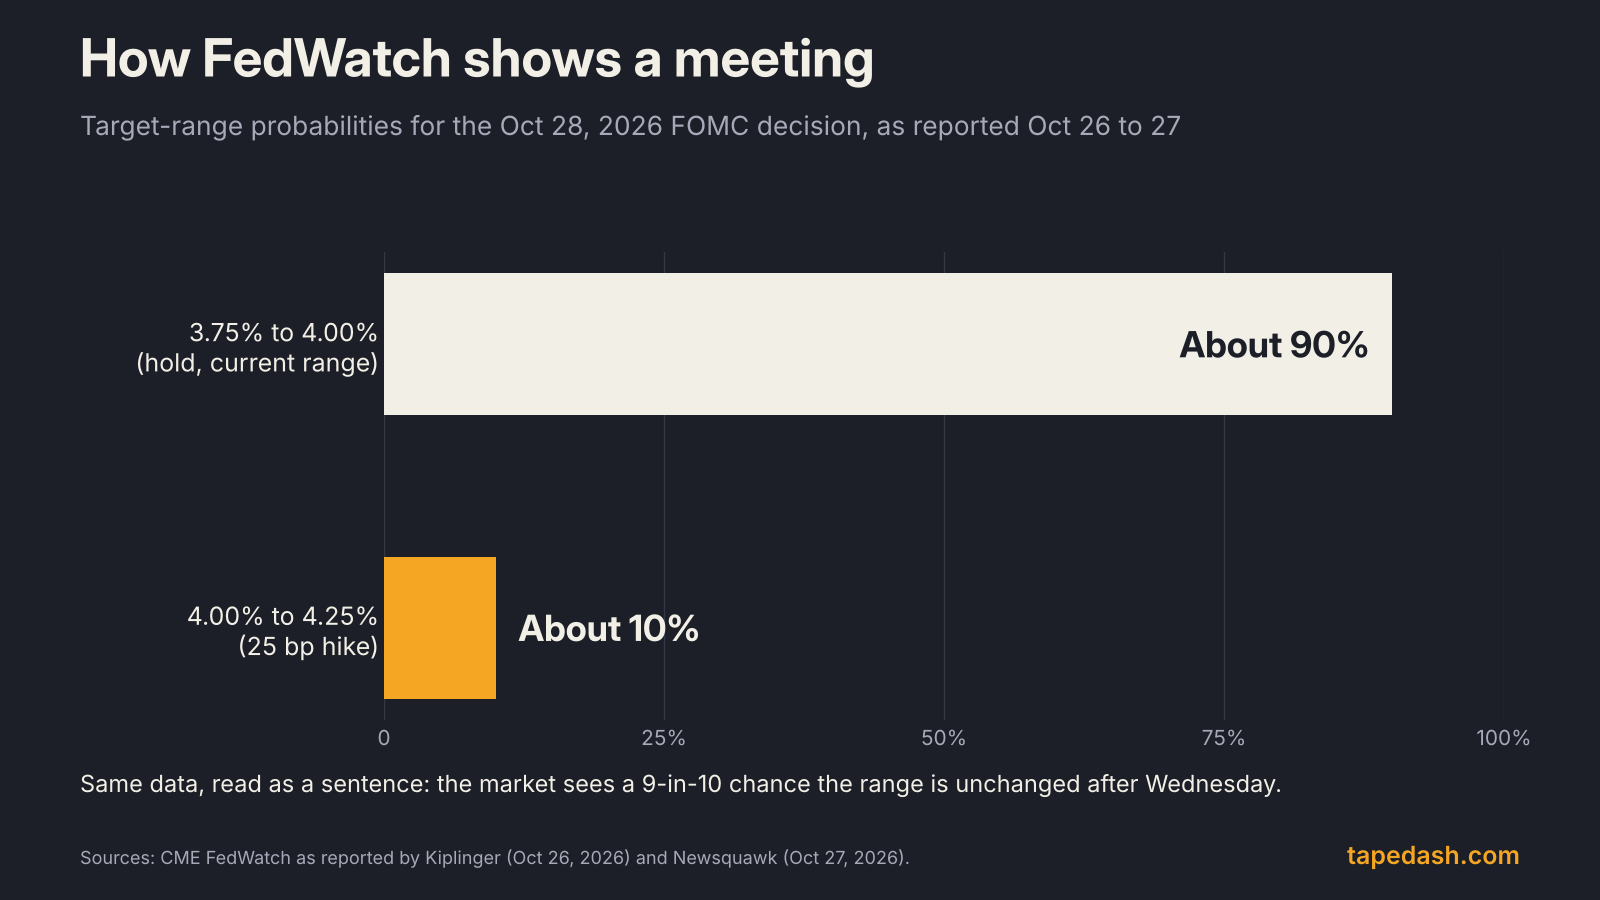
CME FedWatch is a free tool from CME Group that converts the prices of 30-Day Fed Funds futures into probabilities for what the Federal Reserve will do at each upcoming meeting. When you read that “markets see a 90% chance the Fed holds,” that number almost always comes from FedWatch. Heading into Wednesday’s decision, FedWatch showed roughly a 90% chance the Fed keeps its target range at 3.75% to 4.00%, with about a 10% chance of a quarter-point hike, according to Kiplinger and Newsquawk.
Those numbers are not a forecast from the Fed, and they are not a poll of economists. They are what traders are willing to pay, translated into odds with a specific set of assumptions. Once you know how that translation works, you can read FedWatch with far more precision, and you can spot the moments when the headline probability says less than it seems to.
This guide walks through how fed funds futures work, the exact math FedWatch uses, how to read the screen, where the method breaks down, and the routine I use around every Fed meeting.
- FedWatch turns fed funds futures prices into the market’s implied odds for each FOMC meeting. It reflects pricing, not a Fed forecast.
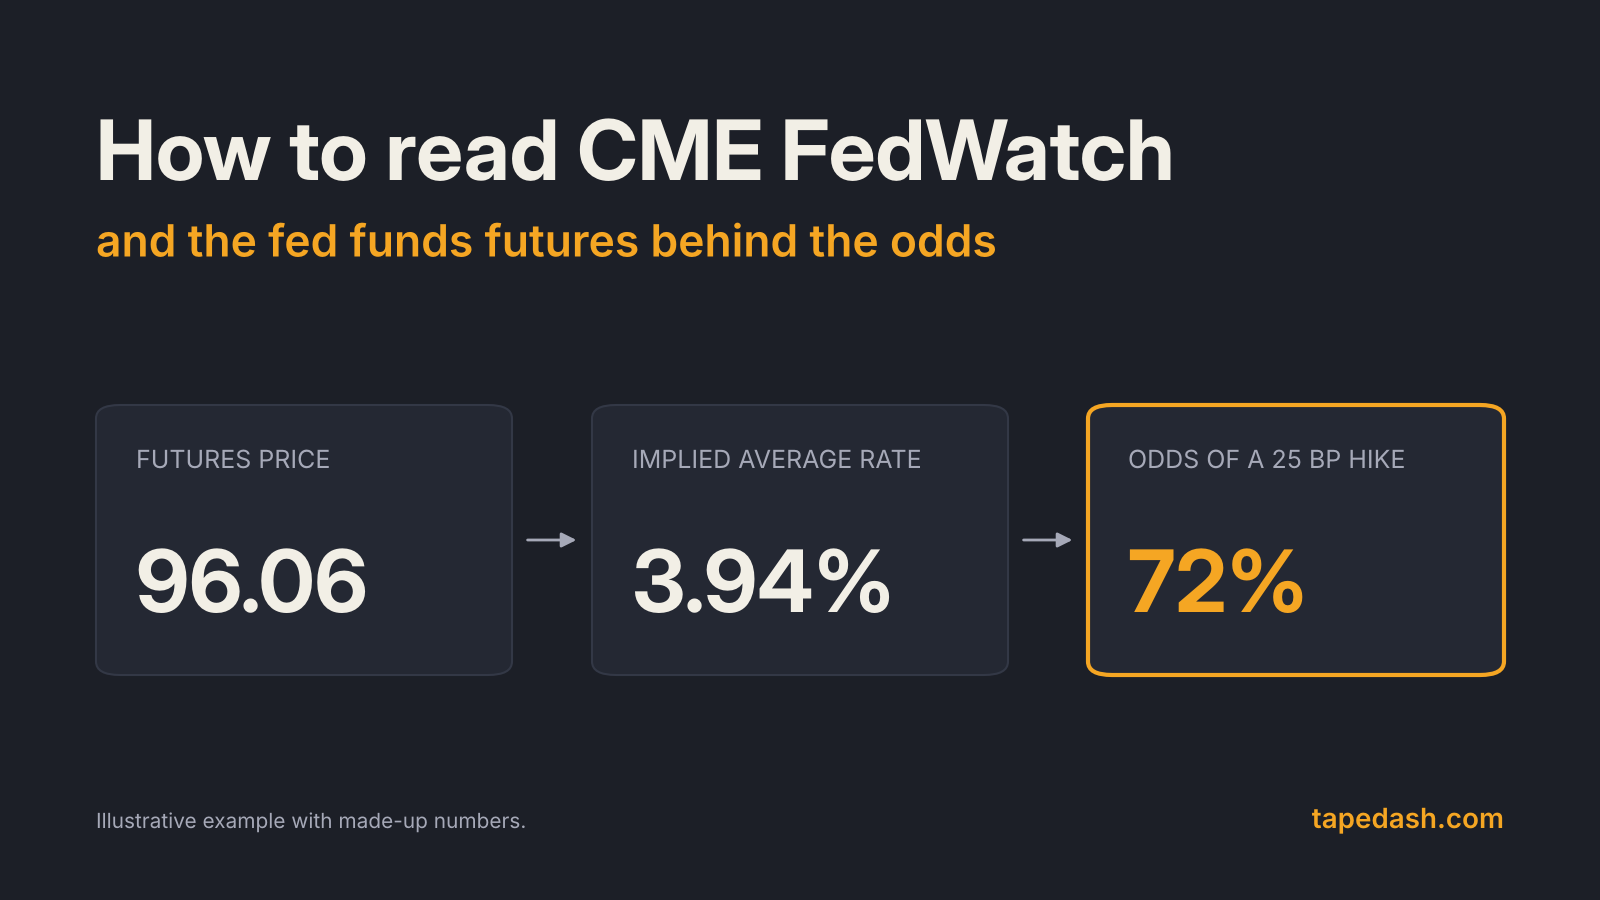
- A fed funds future settles at 100 minus the average effective fed funds rate for its month. A price of 96.06 implies a 3.94% average.
- FedWatch compares the implied rate before and after each meeting and divides the difference by 25 basis points to get the odds of a move.
- Later meetings are built as a probability tree, so their odds depend on what is priced for the meetings before them.
- Watch how the odds change after data and Fed speeches. The shift tells you more than the level.
What is CME FedWatch?
FedWatch is a page on CME Group’s website that shows, for every scheduled meeting of the Federal Open Market Committee, the probability the market assigns to each possible target range for the federal funds rate. It updates through the trading day as futures prices move. As a BabyPips explainer puts it, the numbers are derived from market pricing. They are not a survey and they are not the Fed’s own view.
That distinction matters. When a Fed official gives a speech and FedWatch odds jump, nothing about the Fed’s decision has changed yet. What changed is how traders are positioned. Sometimes the market reads officials correctly. Sometimes it gets ahead of them and has to unwind.
How fed funds futures work
FedWatch is only as good as the contract underneath it, so start there.
The federal funds rate is the rate banks charge each other for overnight unsecured loans. The Fed doesn’t set one number. It sets a target range, such as 3.75% to 4.00%, and the actual market rate settles somewhere inside it. The New York Fed publishes that actual rate every business morning as the effective federal funds rate, or EFFR, which it calculates as the volume-weighted median of overnight fed funds trades (New York Fed).
A 30-Day Fed Funds future is a bet on the average EFFR over one calendar month. It is quoted as 100 minus that average rate. So if traders expect the EFFR to average 3.94% in a given month, the contract trades near 96.06. Higher prices mean lower expected rates, and lower prices mean higher expected rates (CME Group).
A few contract details are worth knowing:
- Cash settlement. At expiry the contract settles at 100 minus the actual average daily EFFR for the month. Weekends and holidays carry the last published rate (CME Rulebook).
- Dollar value. Each basis point of rate change is worth $41.67 per contract, per the CME rulebook and the Duke University contract summary.
- Monthly listings. There is a separate contract for each month, so the strip of contracts maps out the market’s expected path of rates meeting by meeting.
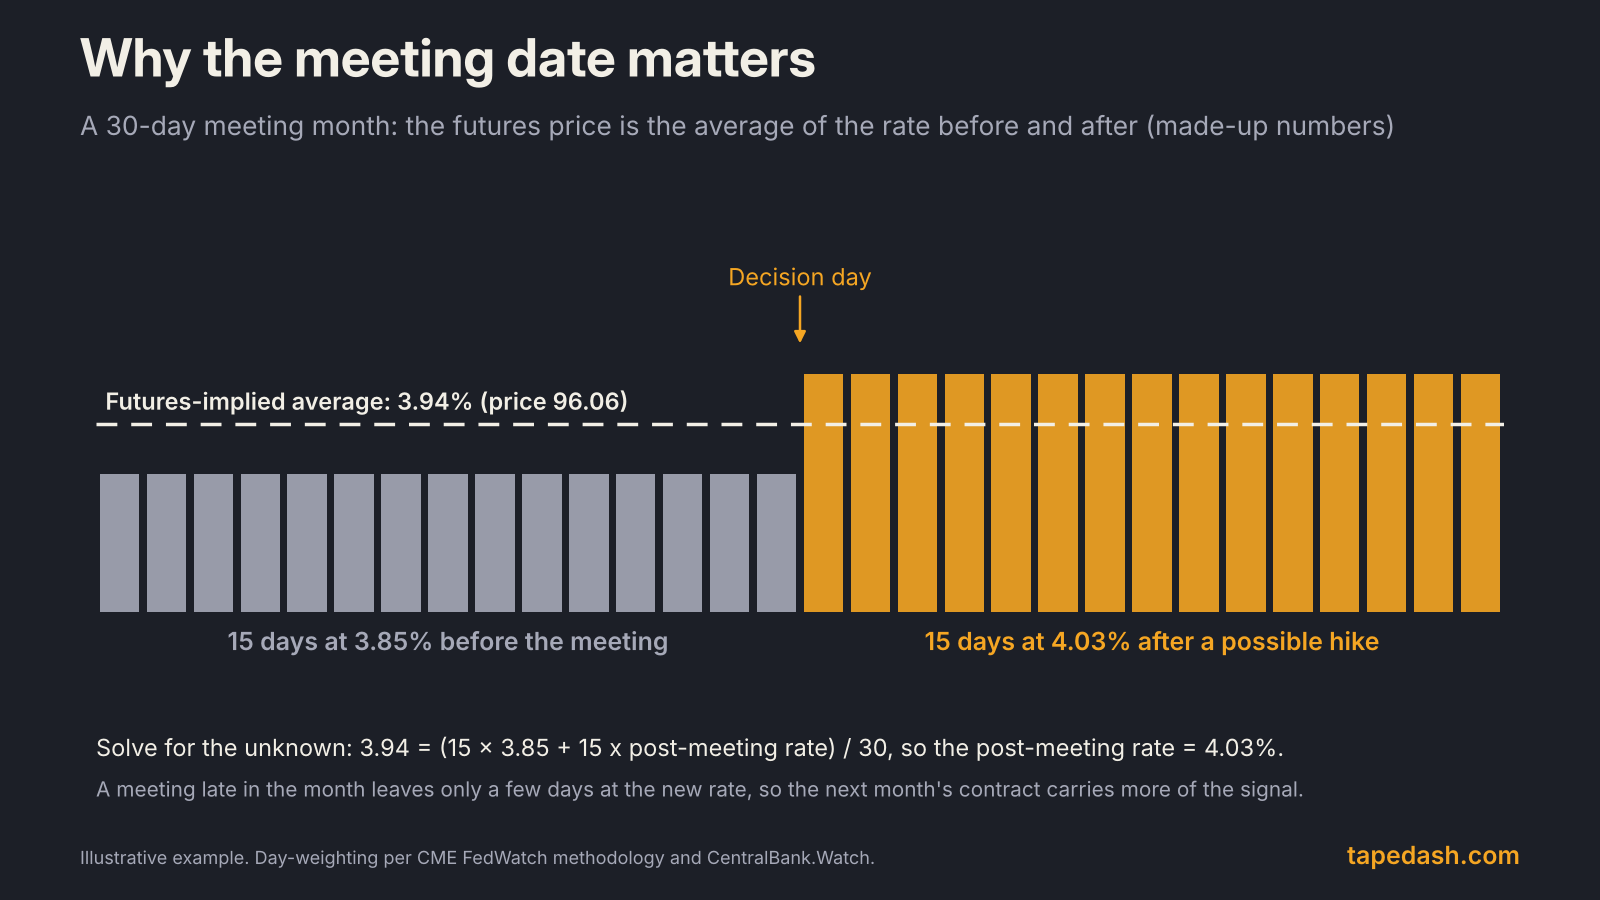
The monthly-average design is the key to everything that follows. Because most FOMC meetings fall mid-month, the meeting-month contract blends the old rate and the new rate. Pulling those two apart is what FedWatch does.
How FedWatch calculates rate hike and cut probabilities
FedWatch’s method is published by CME, and it comes down to four steps (CME Group).
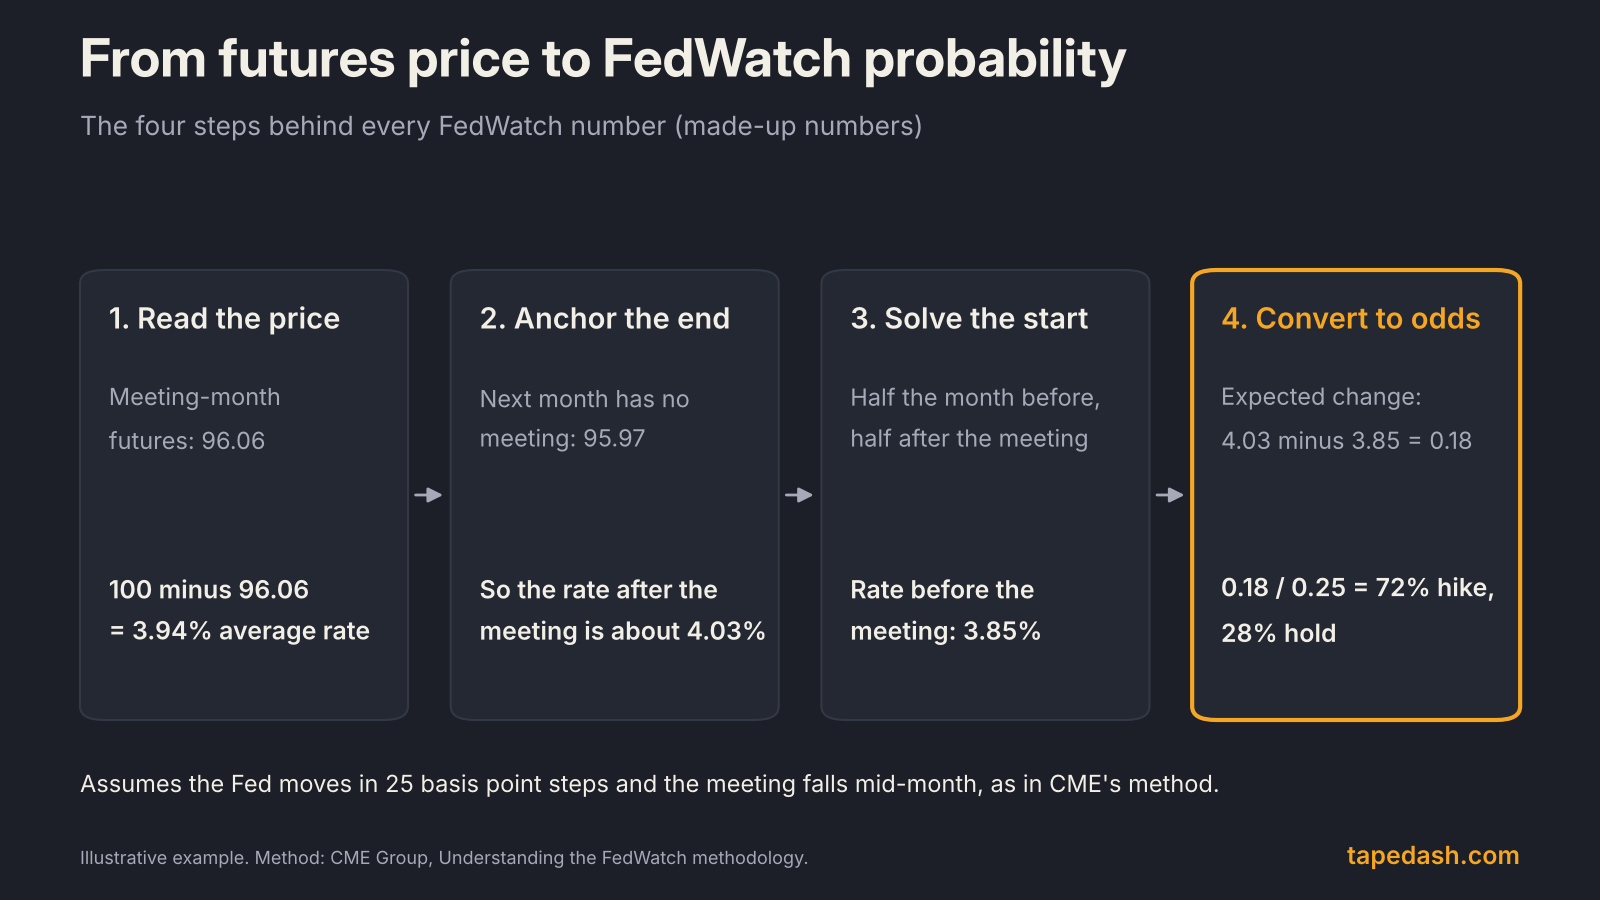
Step 1: read the implied average. Take the meeting-month contract and subtract its price from 100. In our made-up example, 100 minus 96.06 gives a 3.94% average for the month.
Step 2: anchor the end of the month. Find the nearest month with no FOMC meeting. Its contract tells you the rate the market expects once the meeting is over, because nothing should change during a month with no meeting. Here the next month trades at 95.97, so the post-meeting rate is about 4.03%.
Step 3: solve for the start. The meeting-month average is a day-weighted blend of the rate before the meeting and the rate after it. With the decision falling mid-month, half the days sit at each rate. If the average is 3.94% and the after-rate is 4.03%, the before-rate must be 3.85%.
Step 4: convert to odds. The expected change is 4.03% minus 3.85%, or 0.18 percentage points. FedWatch assumes the Fed moves in 25 basis point steps, so it divides: 0.18 divided by 0.25 gives 0.72. That reads as a 72% chance of a quarter-point hike and a 28% chance of no change. If the expected change were 0.33, FedWatch would show a 68% chance of 25 basis points and a 32% chance of 50.
CME’s own worked example uses real prices from September 21, 2022, when the futures implied an expected change of about 72.5 basis points. FedWatch read that as a 90% chance of a 75 basis point hike and a 10% chance of 50. The Fed raised rates by 75 basis points that day, as CentralBank.Watch notes in its walkthrough of the same example and Central Banking reported at the time.
How FedWatch handles several meetings
For meetings further out, FedWatch builds a tree. The end rate from one meeting becomes the start rate for the next, each meeting splits into two branches, and the probability of any path is the product of its branches. Paths that end at the same rate are added together.
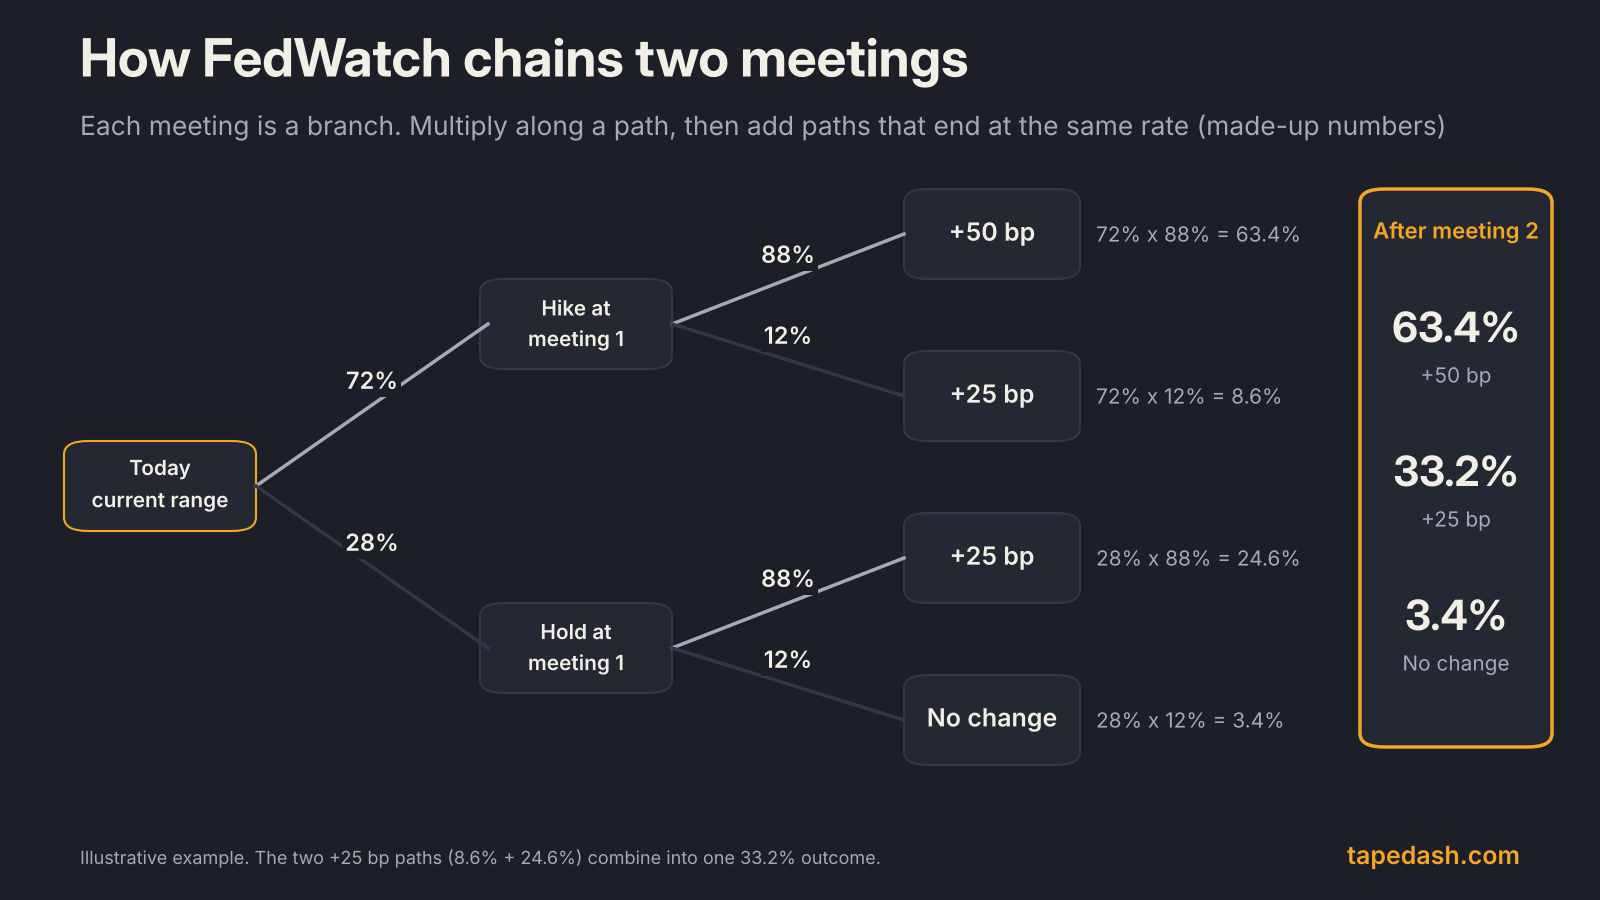
The practical consequence: odds for a December meeting are conditional on what is priced for the meetings before it. If October odds shift, December odds shift too, even when nothing about December itself has changed.
How to read the FedWatch screen
The main FedWatch view shows one bar per possible target range for the selected meeting. For the October 28 decision, the screen showed the current 3.75% to 4.00% range with roughly 90% probability and 4.00% to 4.25% with roughly 10%.
Three habits help when you read it.
Know which question the number answers. “The chance of a hike at the December meeting” and “the chance of at least one more hike by December” are different questions. Ahead of Wednesday, Kiplinger cited about 73% for another hike in December, while Newsquawk cited about 80% for at least one further hike by December. Part of that gap is timing and part is the wording. If you compare numbers across articles, check the definition first.
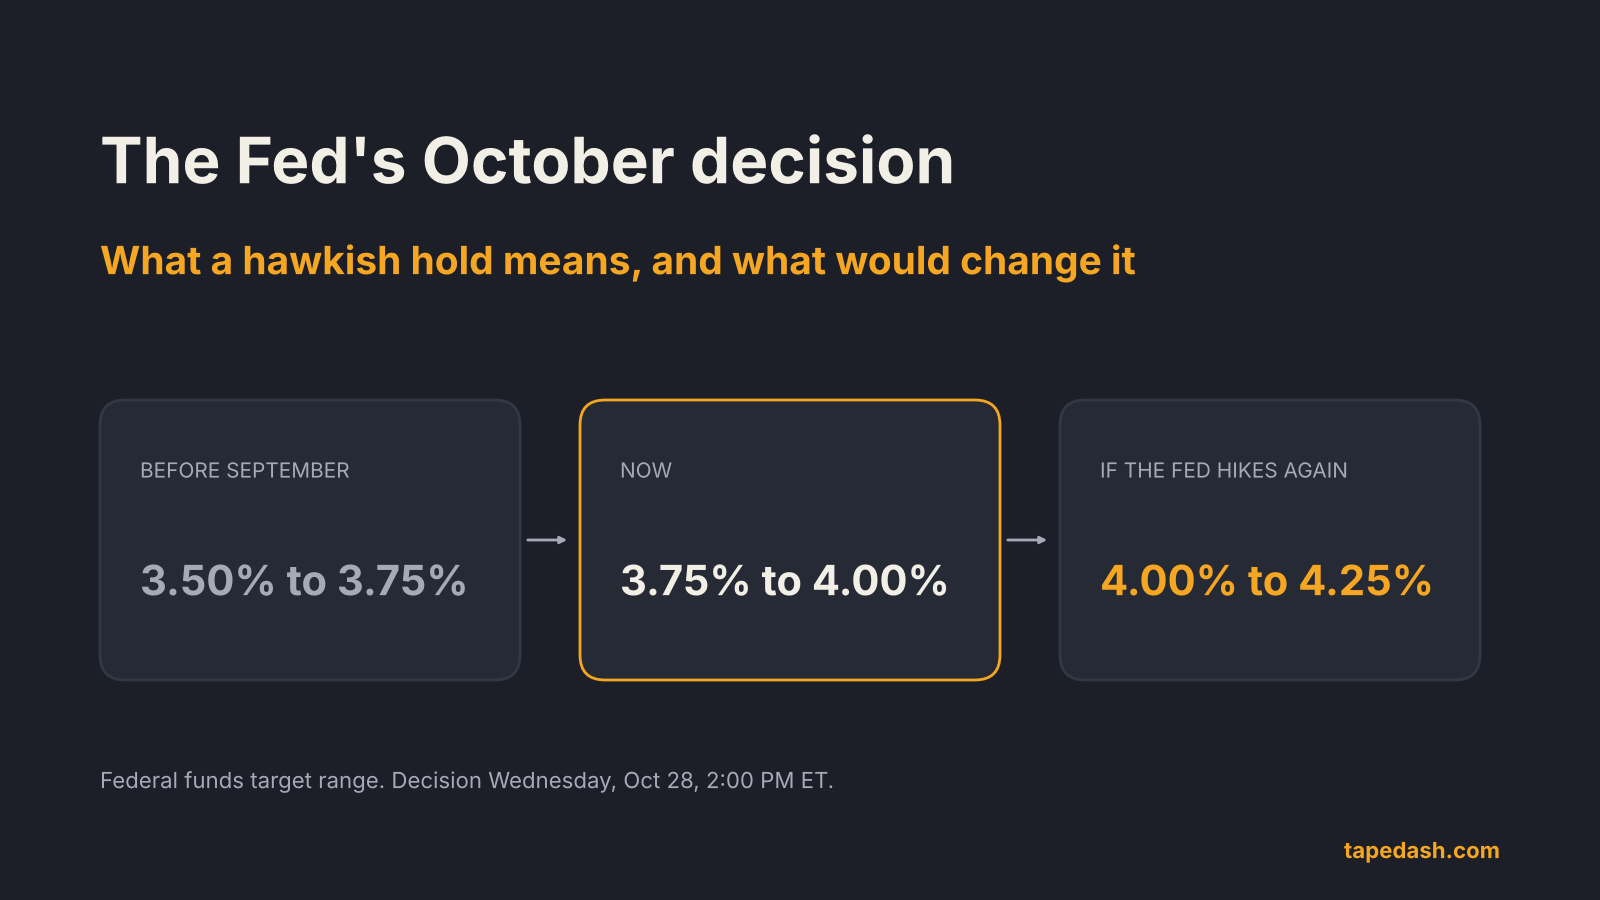
Check the current range. The Fed raised its target range by a quarter point at its September 15 to 16 meeting, to 3.75% to 4.00%, its first increase since 2023 (Trading Economics, Yahoo Finance). Every FedWatch bar is relative to that starting point.
Look at the history tab. FedWatch shows how the probabilities looked a day, a week and a month ago. The trend is often more informative than today’s level. Kiplinger’s October 26 update noted that December hike odds had climbed sharply over the previous month, and that move is the story of the past month in one line.
FedWatch vs. other ways to read the Fed
FedWatch is the most quoted gauge, but it is not the only one. Here is how it compares with the other common inputs.
| Source | What it is | How often it updates | Strength | Weakness |
|---|---|---|---|---|
| CME FedWatch | Odds implied by fed funds futures prices | Continuously during trading | Real money behind it, reacts in seconds | Assumes 25 bp steps; includes risk premium |
| Fed dot plot (SEP) | Each official’s projection for rates | At selected meetings, including December | Straight from policymakers | Projections, not commitments; can go stale fast |
| Economist polls | Surveys of forecasters, such as Reuters polls | Before each meeting | Good read on consensus thinking | No money at risk; slow to update |
| Fed speeches | Remarks from the chair and governors | Several times a week | Direct hints about thinking | One official is not the committee |
| SOFR futures and OIS | Other rate markets pricing the path | Continuously | Better for longer horizons | Harder to read without tools |
On a Fed day, I put the most weight on FedWatch and the 2-year Treasury yield, because both reprice in real time. The dot plot matters most at meetings that include it, which in December means the December 8 to 9 meeting.
Where FedWatch can mislead you
The tool is useful. It also rests on assumptions that break in specific situations.
The 25 basis point assumption. FedWatch splits every expected change into 25 basis point steps. If the real debate is between holding and a 50 basis point move, the tool cannot express that directly. It will show some mix of 0, 25 and 50 that may not match how anyone is actually thinking.
Risk premium. Futures prices include compensation for uncertainty, so the implied odds are what CentralBank.Watch calls risk-neutral rather than pure forecasts. In nervous markets, traders pay up for protection against hikes or cuts, which can tilt the odds.
Timing quirks. When a meeting falls late in a month, the meeting-month contract carries little information about the new rate, and FedWatch leans on the next month’s contract. Small pricing differences between contracts can create odd jumps in the implied path, which CME itself acknowledges.
Distance. Reliability fades with time. A reading for the next meeting is anchored by liquid contracts and lots of data. A reading for a meeting a year out is a rough sketch of sentiment that will change many times before it matters.
Pricing is not a decision. A 50% reading does not mean the Fed is flipping a coin. It means the market is split, often because a single data release, such as the next CPI or jobs report, will decide it.
How to use FedWatch around a Fed meeting
This is the routine we use before and after each FOMC decision.
1. Write down the starting odds. The morning of the decision, note the probability for the current meeting and the next one. In the current setup that means the October 28 odds and the December odds.
2. Note what is priced versus what is possible. A 90% hold means the market is set up for no change. The tone of the statement and press conference becomes the variable that moves prices, which is the setup we covered in our Fed decision preview.
3. Watch the next meeting after the statement. At 2:00 PM ET the decision lands, and the odds for the following meeting are where the reaction shows up. If December hike odds rise after a hold, the market heard hawkish language.
4. Cross-check with the 2-year yield. If FedWatch and the 2-year Treasury yield move in the same direction, the repricing is real. If they disagree, wait. Our guide to the yield curve explains why the front end of the curve tracks Fed expectations so closely.
5. Revisit after the next data release. The biggest FedWatch swings usually come from inflation and jobs data, not from Fed meetings themselves. Check the odds the morning after each major release.
What to watch next
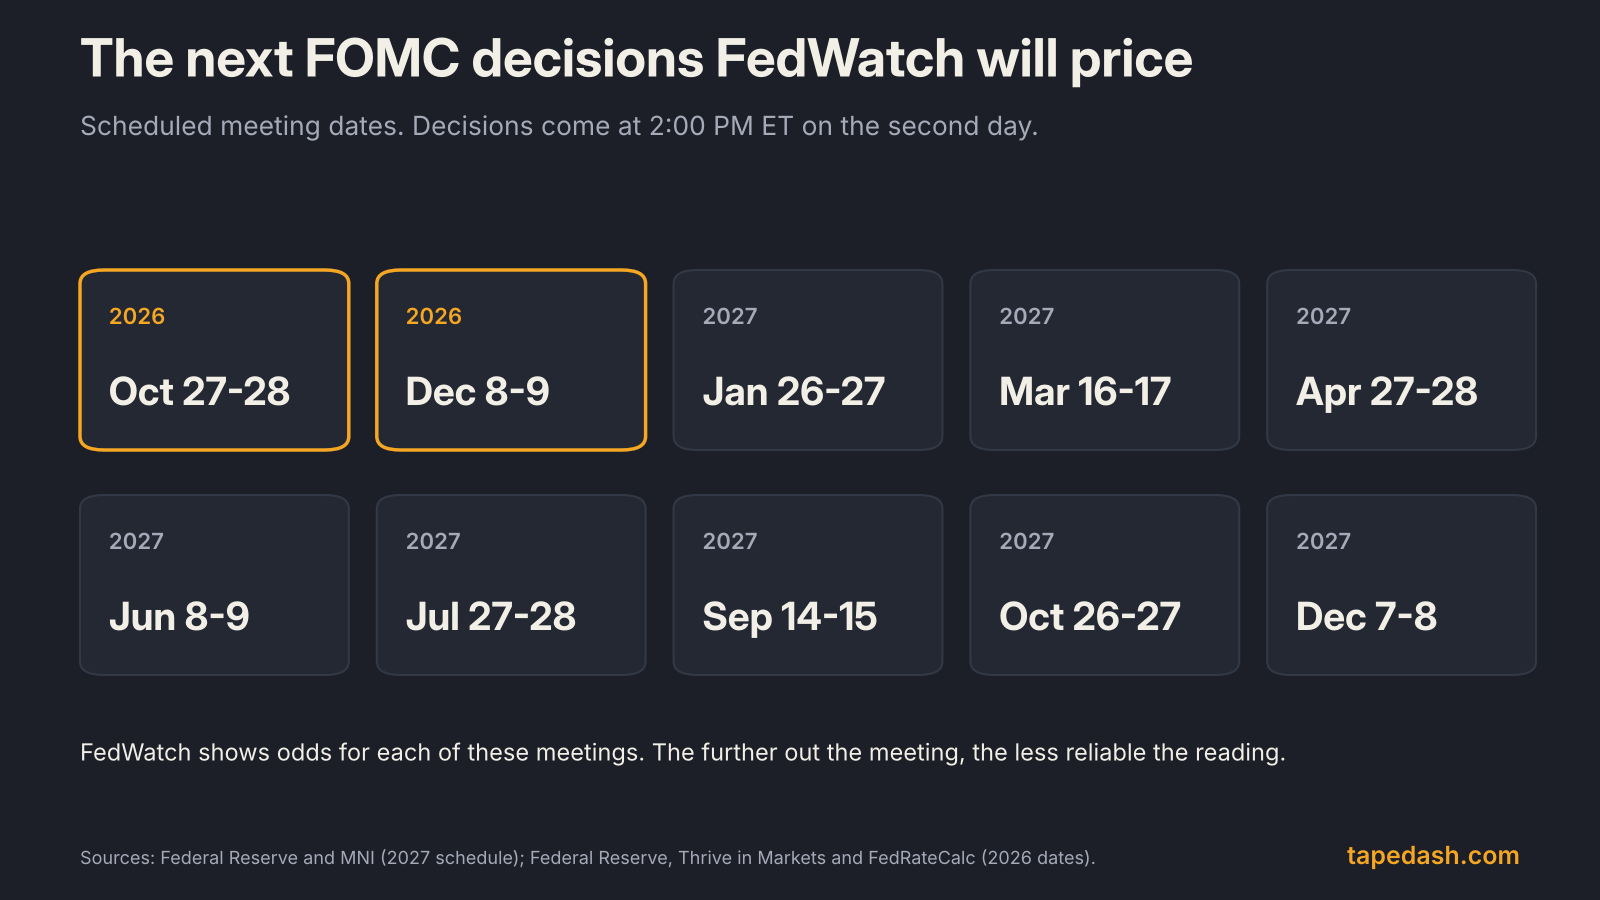
The next test is Wednesday, October 28, at 2:00 PM ET, followed by the chair’s press conference. After that, the final meeting of 2026 runs December 8 to 9, with the decision on December 9 and updated economic projections, according to Thrive in Markets and FedRateCalc. The Fed has already published its tentative 2027 schedule, starting with a January 26 to 27 meeting (Federal Reserve, MNI).
How to track Fed expectations with TapeDash
If you want to follow how Fed expectations move with the data, these are the TapeDash pages we use for it. The Economy page lines up each release, including CPI, jobs and PCE, against the forecast and its own history, so you can see right away whether a print should push rate odds up or down. The Macro and Regime page tracks the market’s risk regime alongside rates, the dollar and credit, which shows whether a shift in Fed pricing is spilling into the rest of the market.
On decision days, the Live Scanner flags the sudden moves, gaps and unusual options flow that tend to follow a surprise. You can try it in the free Terminal Preview with no account. The free TapeDash Daily recaps what moved and why each evening, and when memberships open, the first 200 members lock Pro at $99 a month for as long as they stay.
CME FedWatch FAQ
Is CME FedWatch accurate?
It accurately reflects what futures traders are pricing, but that is different from predicting what the Fed will do. For the next meeting, especially in the final days before a decision, FedWatch tends to line up with the outcome because the Fed rarely wants to surprise markets. For meetings months away, treat it as a sentiment gauge that will change.
Where does FedWatch get its data?
From the prices of CME’s 30-Day Fed Funds futures, which settle against the effective federal funds rate published daily by the New York Fed. CME applies its published methodology to those prices to produce the probabilities.
What does “priced in” mean for a Fed decision?
It means the market’s prices already reflect the expected outcome. If FedWatch shows a 90% chance of a hold and the Fed holds, rates and stocks usually don’t react much to the decision itself. The reaction comes from anything that wasn’t expected, such as a change in the statement or the chair’s tone.
The one idea to keep
FedWatch is a translation, not a prophecy. It takes a futures price, assumes the Fed moves in quarter-point steps, and turns the gap between two implied rates into odds. Read the level to know what is expected, read the change to know what just shifted, and remember that the market’s 90% is a price someone is willing to pay, not a promise from the Fed.
See it on the tape, not just in the headlines
TapeDash is the research desk for traders and investors: live options flow, dealer positioning, a real-time market scanner and trade alerts graded in public. Memberships open January 1, 2027, and the first 200 members lock Pro at $99 a month for as long as they stay.
Join the waitlistClick through the terminalSee the track recordSources
- CME Group: Understanding the CME Group FedWatch Tool methodology
- CME Group: Introduction to Fed Fund futures
- CME Group Rulebook, Chapter 22: 30-Day Federal Funds futures
- Duke University (Campbell Harvey): 30 Day Fed Fund futures
- CentralBank.Watch: CME expanding tree methodology
- BabyPips: Explainer, the CME FedWatch tool (Sep 2026)
- Federal Reserve Bank of New York: Effective Federal Funds Rate
- Kiplinger: October Fed meeting live updates and commentary (Oct 26 to 27, 2026)
- Newsquawk: Preview of the Federal Reserve rate decision due Oct 28
- Trading Economics: Fed raises rates for the first time since 2023 (Sep 16, 2026)
- Yahoo Finance: Traders price odds for an October Fed hike (Oct 15, 2026)
- Federal Reserve: December 2026 calendar
- FedRateCalc: FOMC meeting schedule, December 2026
- Thrive in Markets: FOMC 2026 meeting dates
- Finance Calendar: FOMC rate decision, October 2026
- Federal Reserve: FOMC announces tentative 2027 meeting schedule (Sep 5, 2025)
- MNI: Federal Reserve sets 2027 FOMC meeting schedule
- Central Banking: Fed raises interest rate 75bp for third time (Sep 21, 2022)
This article is for educational and informational purposes only. It is not financial, investment, medical or legal advice, and it is not a recommendation to buy or sell any security. Figures come from the sources listed and were checked on the date of publication; markets change quickly. Options trading involves substantial risk of loss.