The Yield Curve Explained: Inversions, Steepening and Stocks
What the yield curve is, why an inverted yield curve warned of past recessions, what steepening means now, and how traders read it for stocks.
The yield curve is a line connecting the interest rates on U.S. Treasury debt from the shortest maturities (a few months) to the longest (30 years). Normally it slopes upward, because lenders want more pay to tie up money longer. When short-term yields climb above long-term yields, the curve is “inverted,” and that shape has shown up ahead of each of the last eight U.S. recessions, according to the Cleveland Fed.
That track record is why the yield curve gets more attention than almost any other bond market chart. It is also why the last cycle was so humbling. The 2-year/10-year curve inverted in 2022, stayed upside down for more than two years, and then turned positive again in September 2024. No recession has followed. As of late October 2026, the Fed is raising rates again and the 10-year Treasury sits near 5%, so the shape of the curve is back in the conversation.
This guide covers what the yield curve measures, why inversions have worked as a warning, why the 2022 signal misfired, what “bull steepening” and “bear steepening” mean, and how I actually use the curve when I trade stocks and options.
- The yield curve plots Treasury yields by maturity. The two spreads people quote most are the 10-year minus 2-year (“2s10s”) and the 10-year minus 3-month.
- An inverted yield curve has preceded each of the last eight recessions by the 10-year/3-month measure, with a lag that San Francisco Fed research put at 6 to 24 months.
- The 2022 to 2024 inversion ran from mid-2022 to September 2024 and was not followed by a recession, which the Cleveland Fed now counts as a false positive.
- For traders, the direction of a move matters more than the level. A bull steepener and a bear steepener both widen the spread but tell very different stories.
- Use the curve as a regime filter for sectors and position size, not as a timing signal to sell stocks.
What the yield curve is
Pick any day and plot the yield on every Treasury maturity: 3-month bills, 2-year notes, 5-year, 10-year, 30-year bonds. Connect the dots and you have the yield curve. Because all of these are obligations of the same borrower, credit risk is essentially the same along the line. The differences come down to time and expectations.
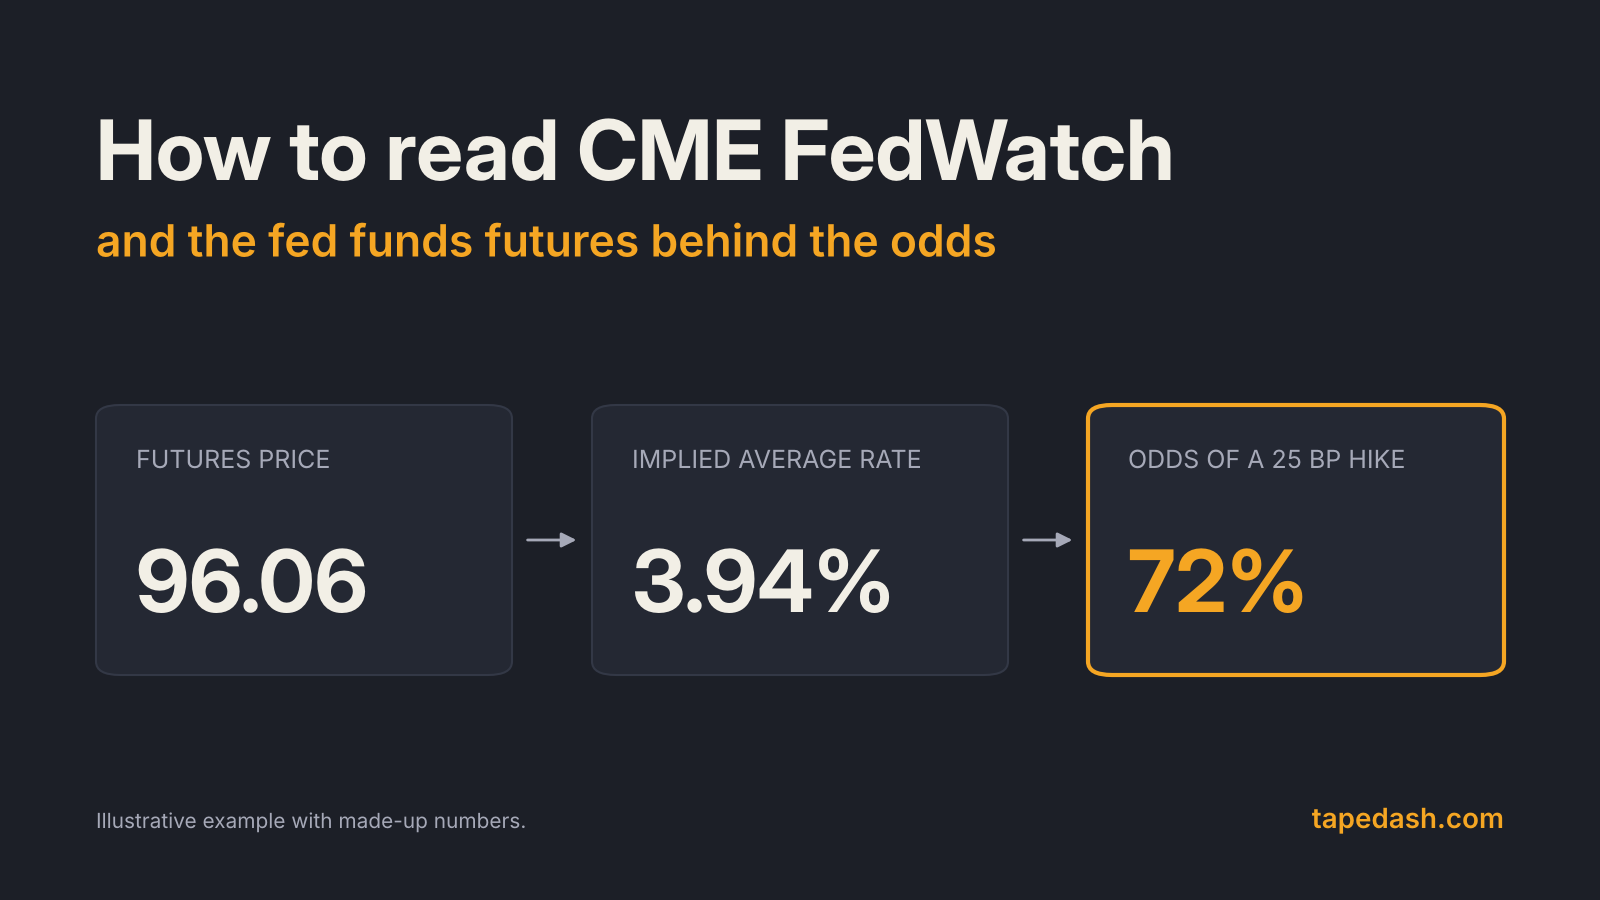
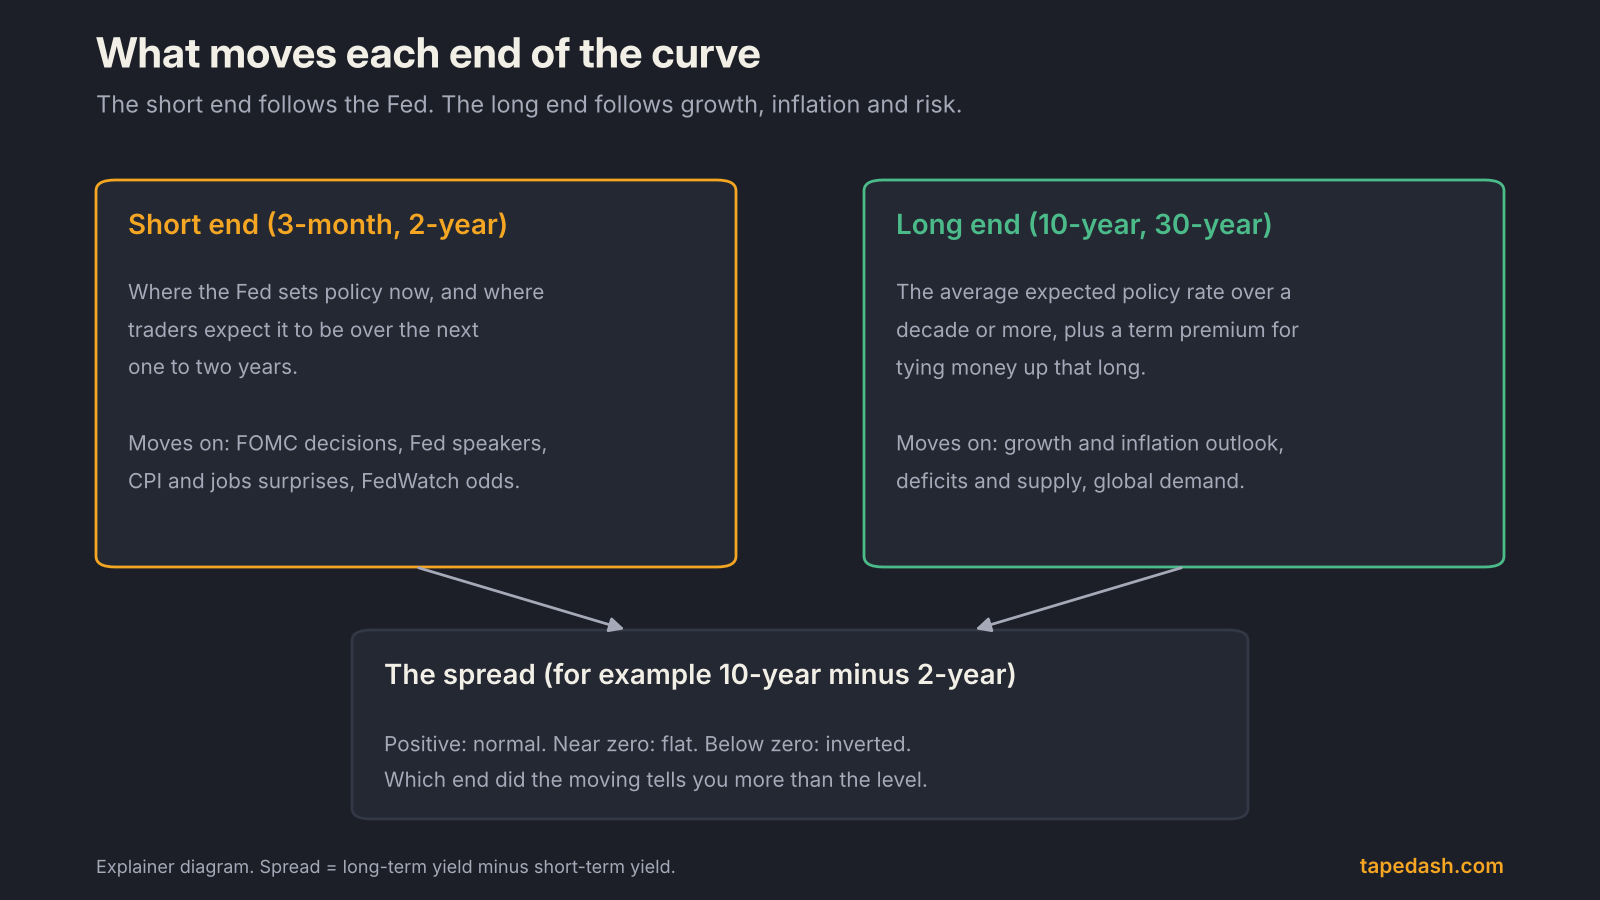
The short end, roughly 3 months to 2 years, is anchored by the Federal Reserve. A 3-month bill yields close to whatever the Fed’s policy rate is expected to be over the next three months. The 2-year reflects where traders expect the policy rate to average over the next two years, which is why it reacts so sharply to Fed meetings and inflation reports. If you want the mechanics of how those expectations get priced, our guide on how to read CME FedWatch and fed funds futures covers it in detail.
The long end, the 10-year and 30-year, is a different animal. It reflects the expected path of short rates over a decade or more, plus a “term premium,” the extra yield investors demand for the risk of holding a long bond through unknown inflation, deficits and supply. The Fed influences it, but does not set it.
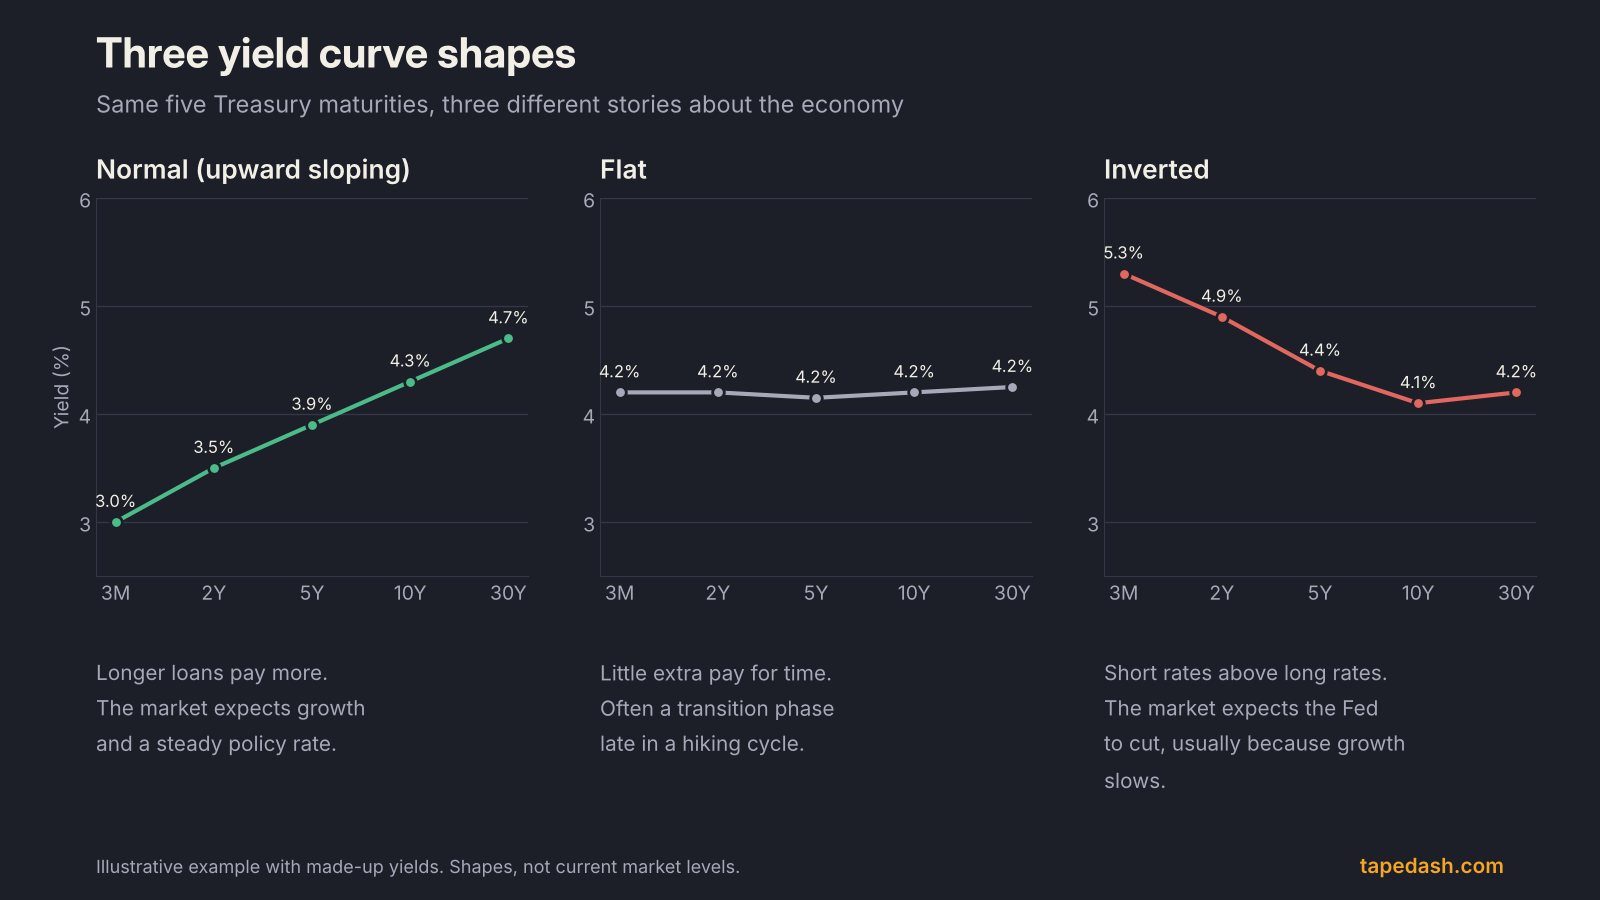
The three shapes, in plain terms
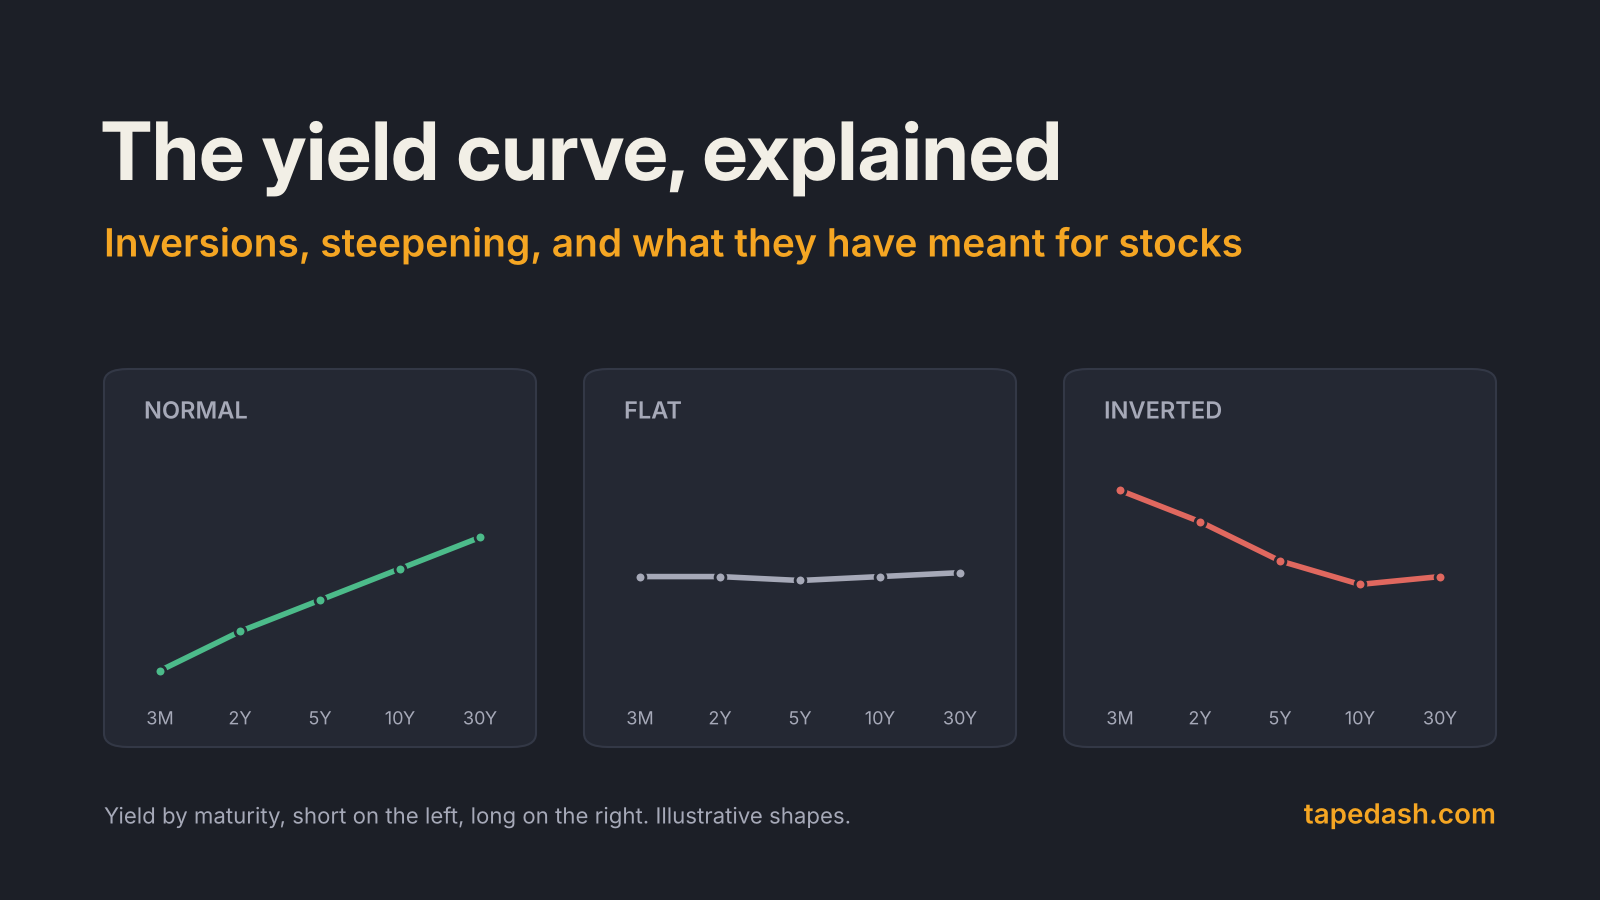
A normal curve slopes up. Investors expect the economy to keep growing and the Fed to keep policy roughly where it is or move gradually.
A flat curve means there is little extra pay for lending long. It often shows up late in a hiking cycle, when the Fed has pushed short rates up and the bond market doubts it can keep them there.
An inverted curve means short-term yields sit above long-term yields. The usual message is that the market expects the Fed to cut rates in the future, and the most common reason a Fed cuts is that growth weakens.
Why an inverted yield curve has signaled recessions
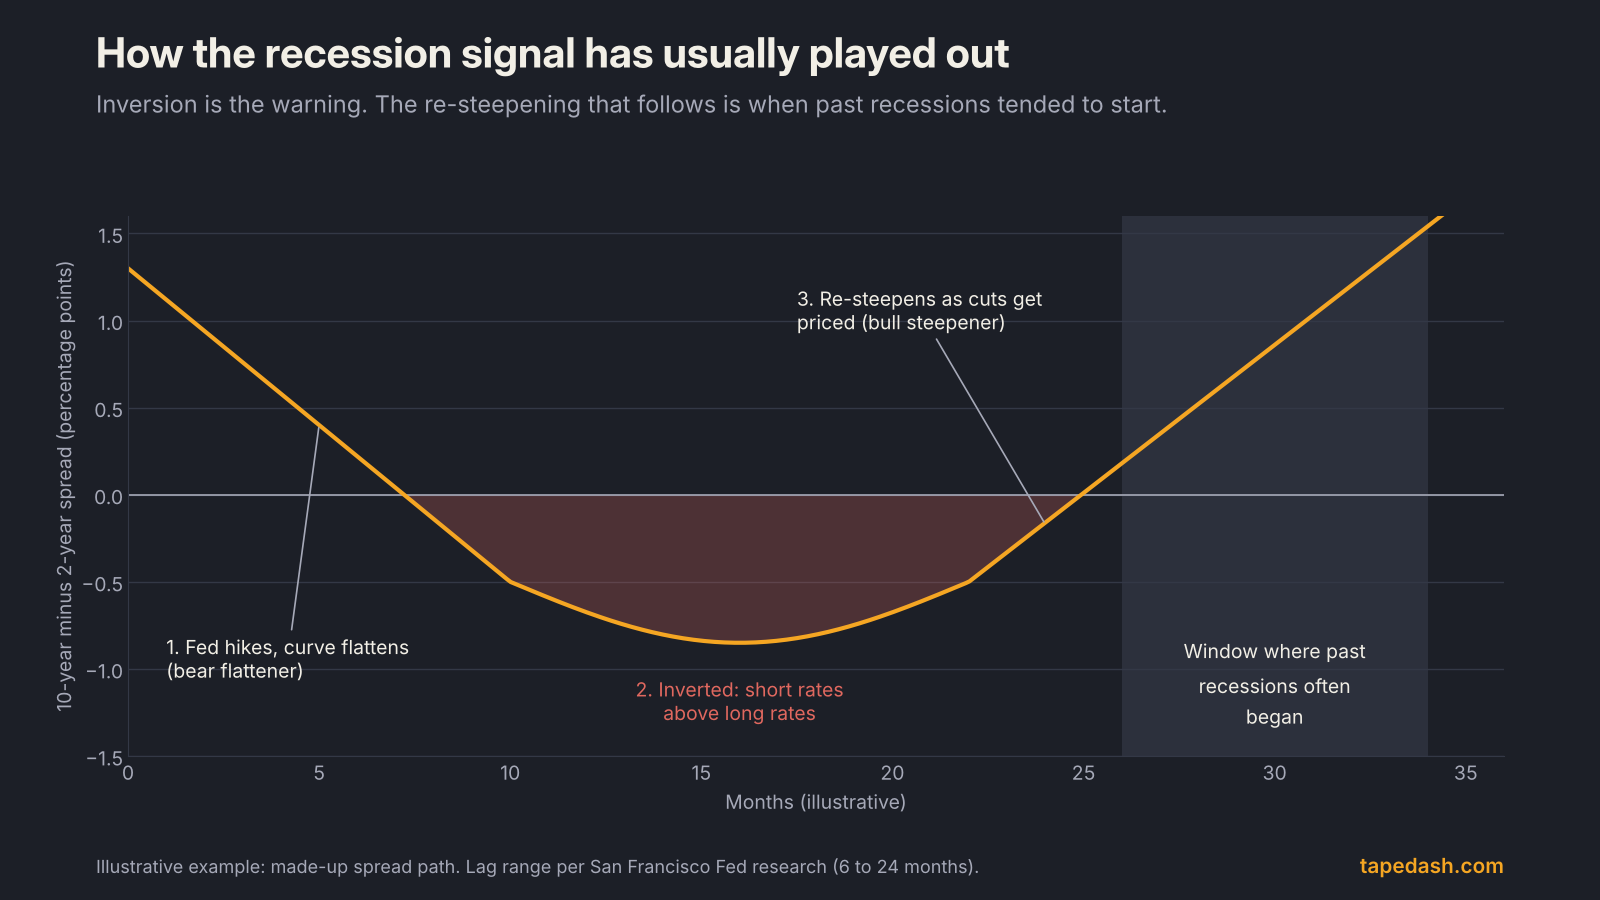
The logic is simpler than the reputation. When the Fed raises short rates high enough to slow the economy, the bond market starts pricing the cuts that typically follow a slowdown. Long yields stop rising, or fall, while short yields stay pinned by current policy. The curve inverts.
There is also a plumbing channel. Banks fund themselves with short-term deposits and lend at longer-term rates. When the curve inverts, that margin gets squeezed, and lending tends to tighten, which feeds back into slower growth.
The track record is the reason anyone cares. The New York Fed’s research notes that the 10-year minus 3-month spread has predicted essentially every U.S. recession since 1950, with one false signal in the 1960s. The Cleveland Fed puts it as inversions preceding each of the last eight recessions, and a 2018 San Francisco Fed Economic Letter found that the delay between an inversion and the start of a recession ranged from 6 to 24 months. That range is wide enough to make the signal close to useless for timing a stock market top, and that point gets lost in most headlines.
Which spread matters: 2s10s or 3-month/10-year
You will see both quoted constantly, and they do not always agree.
The 2s10s spread (10-year yield minus 2-year yield) is the market’s favorite because both are liquid, actively traded notes. It moves fast and reflects where traders think policy is going.
The 10-year minus 3-month spread is the one the Fed’s own research leans on. The New York Fed’s recession probability model uses it, as do the Cleveland Fed and the St. Louis Fed’s discussion of yield spreads. Because the 3-month bill tracks the current policy rate so closely, this spread measures how restrictive policy is today relative to the long-run outlook.
When the two diverge, the 3-month version usually tells you about current policy pressure and the 2-year version tells you about expected policy.
The 2022 to 2024 inversion: the signal that misfired
The last cycle is worth studying because it broke the pattern.
The 2-year yield first moved above the 10-year at the end of March 2022, the first 2s10s inversion since 2019, as Bloomberg reported and Fortune confirmed. The Fed was just starting what became an aggressive hiking campaign. By July 2022 the inversion was persistent, and in late October 2022 the 3-month/10-year curve closed inverted as well.
The trough came in March 2023, when the 2s10s gap reached more than a full percentage point. Reuters described it as the deepest inversion since 1981, and Fortune also called it the biggest since the early 1980s. Then the slow unwind. As markets began pricing Fed rate cuts in 2024, the 2-year fell faster than the 10-year, and on September 4, 2024 the 2s10s curve turned positive, ending an inversion that had run since mid-2022.
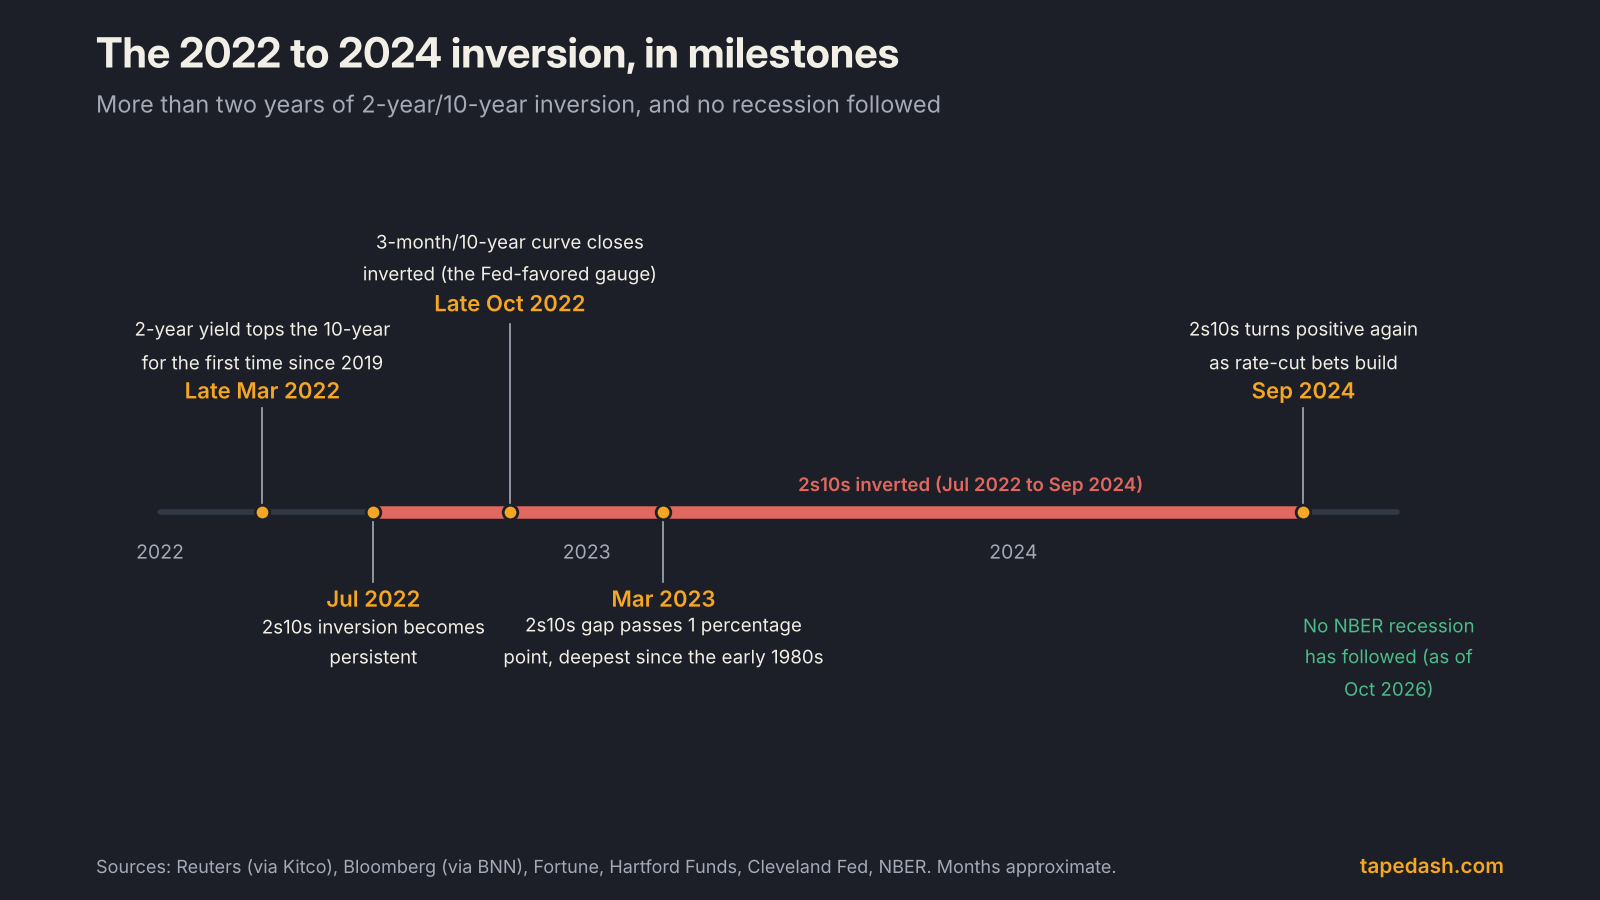
No recession followed. The NBER’s business cycle table still lists the February to April 2020 contraction as the most recent one, and the Cleveland Fed now lists the late-2022 to late-2024 inversion among its “notable false positives,” alongside a 1966 inversion and a very flat curve in 1998.
Why did it misfire? There is no settled answer, but three explanations get the most weight. Households and companies had locked in low fixed-rate debt during 2020 and 2021, so higher short rates took longer to bite. Large fiscal deficits kept supporting spending. And years of Fed bond buying had pushed the term premium unusually low, which kept long yields lower than they would otherwise have been, making the inversion deeper without it meaning as much. The Fortune piece from March 2022 flagged this last point at the time.
The lesson I take from it is narrow. The curve did its job as a description of policy: it said the Fed was restrictive, and it was. It failed as a forecast of the economy. Those are different things.
Steepening explained: bull steepener vs bear steepener
Once a curve un-inverts, the next question is how it is steepening. Bond traders use four labels, and they are less jargony than they sound. “Bull” means yields are falling (bond prices rising). “Bear” means yields are rising. “Steepener” and “flattener” describe what happens to the gap between long and short yields. The definitions below follow Hartford Funds and investingLive’s explainer.
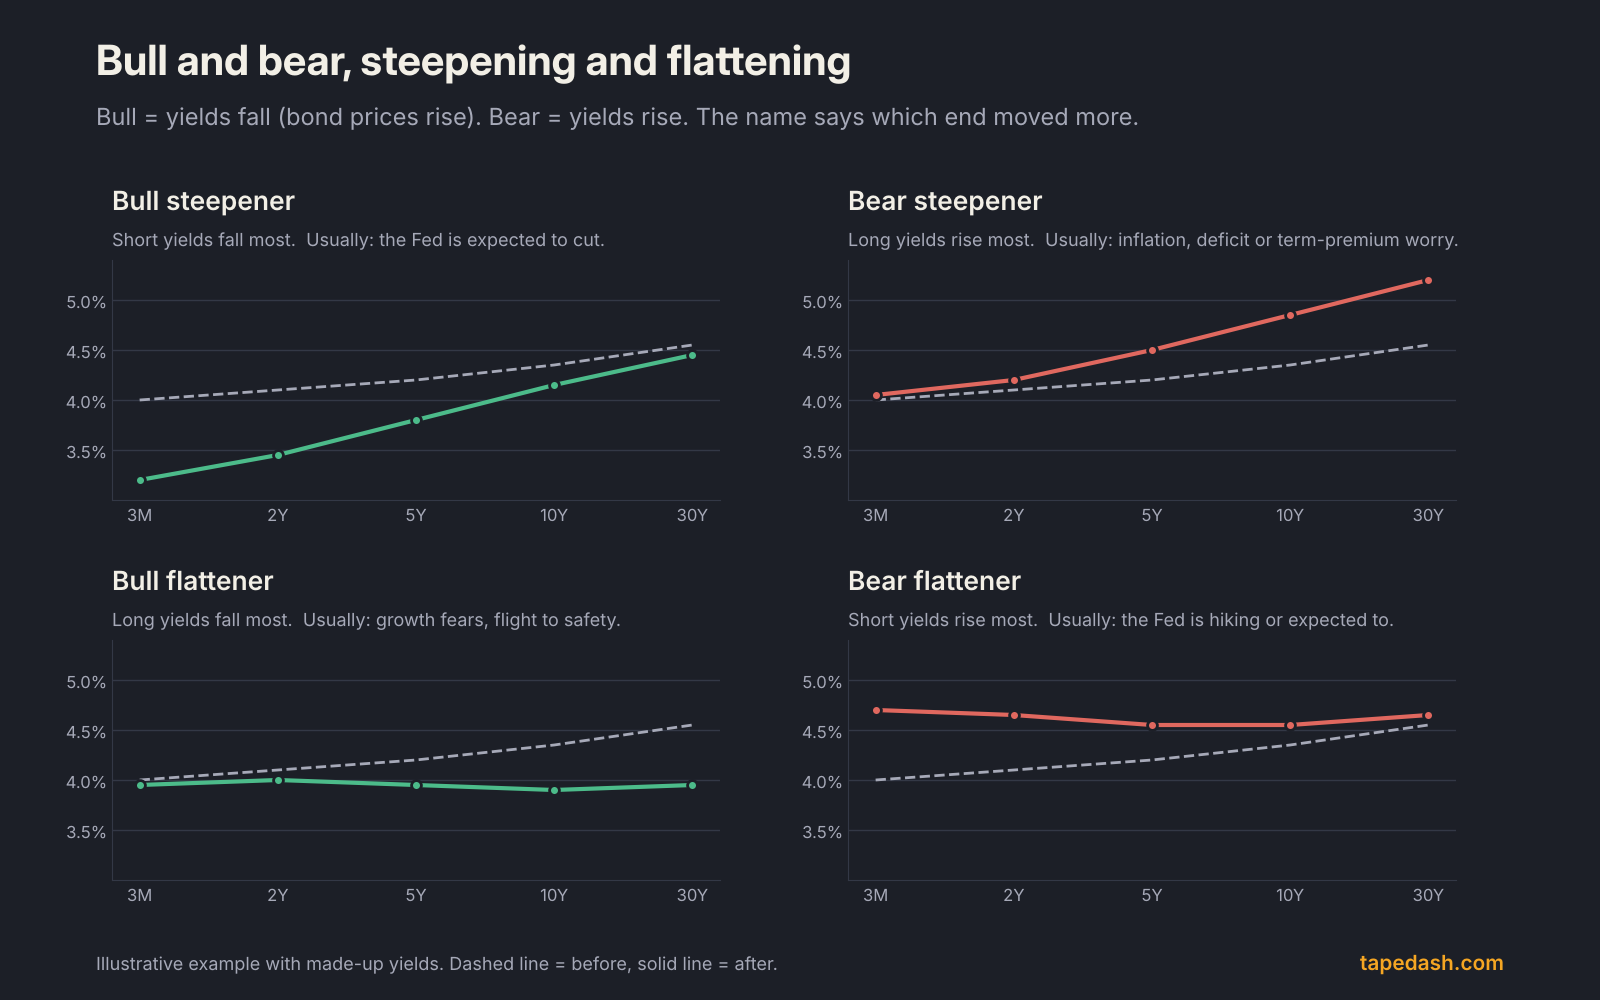
| Curve move | What happens | Typical driver | What it has tended to mean for stocks |
|---|---|---|---|
| Bull steepener | Short yields fall faster than long yields | Markets price Fed rate cuts | Depends on why the Fed is cutting. A benign easing helps small caps and housing; a growth scare favors defensives |
| Bear steepener | Long yields rise faster than short yields | Inflation fears, deficits, bigger term premium | Pressure on long-duration growth stocks and rate-sensitive sectors; banks’ lending margins widen |
| Bull flattener | Long yields fall faster than short yields | Growth worries, flight to safety | Defensive sectors and long bonds tend to lead |
| Bear flattener | Short yields rise faster than long yields | Fed hiking or expected to hike | Classic late-cycle setup; tighter financial conditions over time |
The steepener after an inversion is the phase recession watchers care most about. Penn Mutual and Advisor Perspectives both noted in 2024 that un-inversions have often come shortly before recessions, because the curve usually re-steepens when the Fed starts cutting into a weakening economy. In other words, the inversion is the warning, and the bull steepening that ends it has historically been closer to the event.
Inverted yield curve and stocks: what the history says
This is where traders get hurt. An inverted yield curve has not been a reliable signal to sell stocks.
Commonwealth Financial’s Anu Gaggar, quoted by both Fortune and Reuters, counted 28 inversions since 1900, with a recession following in 22 of them. That is a strong hit rate for the economy. It says nothing about when stocks peak, and in her work global equities rose in aggregate in the 12 months after the inversions since 1975. The most recent episode made the point loudly: the S&P 500 posted large gains while the 2s10s curve was inverted from 2022 to 2024, as Hartford Funds noted.
What the curve does shift is leadership. A flat or inverted curve squeezes bank lending margins and tends to hurt rate-sensitive small caps. A bear steepener raises the discount rate on long-dated cash flows, which is why high-multiple tech often struggles when the 10-year jumps. A bull steepener on a benign easing story tends to help housing, regional banks and small caps. If you want to check whether a rally is broad enough to survive a rate shock, pair the curve with the indicators in our market breadth guide.
How to use the yield curve as a trader
I do not trade the yield curve directly. I use it to decide what kind of market I am in, which sectors deserve the benefit of the doubt, and how much risk to carry. Here is the routine.
- Check both spreads, weekly. Note the 2s10s and the 10-year/3-month and whether each is positive, near zero or negative. Write it down. The trend over four to eight weeks matters more than any single day.
- Name the move. Ask which end moved. If the spread widened because the 2-year fell, that is a bull steepener and usually a Fed story. If it widened because the 10-year rose, that is a bear steepener and usually an inflation, deficit or term-premium story. Same spread change, opposite implications for growth stocks.
- Cross-check with the Fed. Compare the 2-year to the fed funds range. A 2-year well below the policy rate means the market expects cuts. A 2-year above it means hikes are being priced.
- Map it to sectors. Bear steepening: be skeptical of long-duration growth and rate-sensitive names. Bull steepening on a soft landing: small caps and housing get more room. Bull steepening on a growth scare: favor defensives and size down.
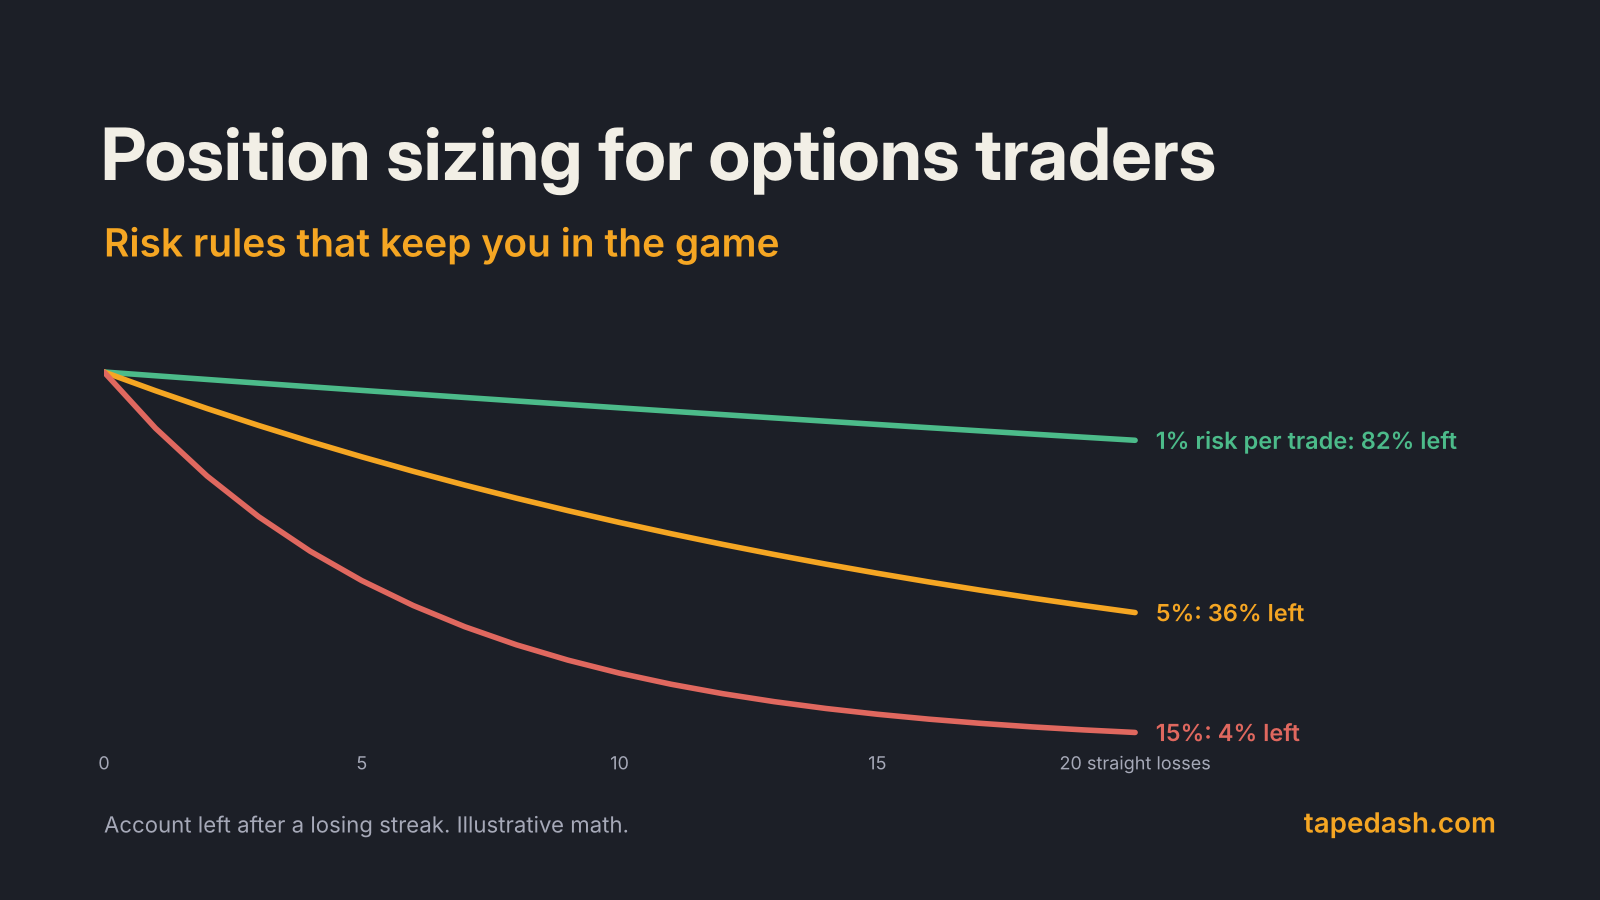
- Use it for sizing, not timing. When the curve is inverted or re-steepening fast after an inversion, I keep position sizes smaller and favor defined-risk options structures. The curve does not tell me when, but it does tell me how much margin for error to leave.
Where the curve stands in late October 2026
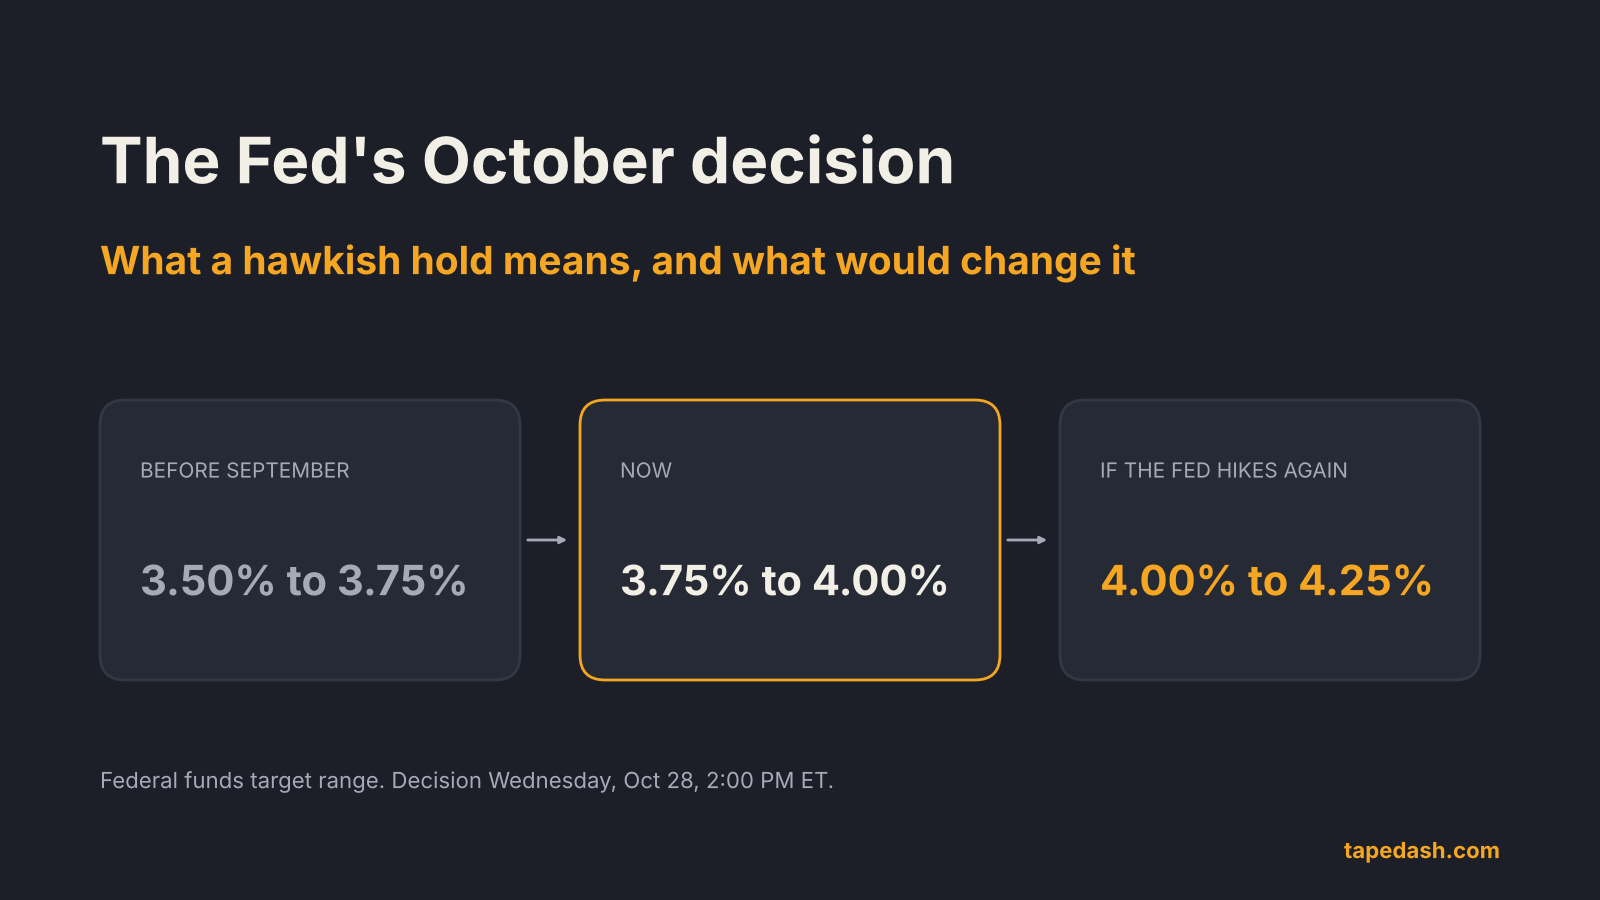
The setup today is unusual. The Fed raised its target range to 3.75% to 4.00% in September 2026, and the 10-year Treasury was trading just under 5% heading into this week’s meeting, as covered in our October Fed decision preview. The Cleveland Fed’s September reading had the 10-year/3-month spread positive, so the curve is upward sloping even while the Fed tightens.
That combination, a hiking Fed with a positively sloped curve, is the bear-steepening world: the market is demanding more yield for long-term risk rather than pricing a Fed-induced recession. If inflation keeps running hot and the Fed hikes again, watch whether the short end catches up to the long end (a bear flattener). That is the path that eventually leads back toward inversion.
What to watch next
The near-term calendar is busy. The Fed announces its decision on Wednesday, October 28, at 2:00 PM ET, with GDP and PCE inflation data on Thursday morning, October 29, and the next FOMC meeting on December 8 to 9. Each of these hits the short end first. On each, I watch whether the 2-year or the 10-year moves more, because that tells me which story the bond market is buying.
How TapeDash tracks the yield curve
If you want to watch this without building a spreadsheet, our Macro & Regime page tracks the Treasury curve alongside the policy rate and labels the current regime, and the Economy page lines up the data releases that move the short end. When I am deciding whether to lean into growth or defensives, those two pages are the first stop before I open a single chart.
You can explore the Terminal Preview for free with no account, or join the free TapeDash Daily to get the morning read on rates, flows and the calendar.
Yield curve FAQ
Does an inverted yield curve always mean a recession is coming?
No. It has preceded each of the last eight recessions by the 10-year/3-month measure, but it has also produced false signals, most recently the 2022 to 2024 inversion. The lag has ranged from 6 to 24 months, so even when it works it does not tell you when.
What is the 2s10s spread?
It is the 10-year Treasury yield minus the 2-year Treasury yield. A positive number means a normal, upward sloping curve. A negative number means the 2s10s curve is inverted.
Is a steepening yield curve good or bad for stocks?
It depends on which end is moving. A bull steepener driven by expected rate cuts can help small caps and housing if the economy holds up. A bear steepener driven by rising long-term yields usually pressures high-valuation growth stocks.
The one idea to keep: the yield curve tells you what the bond market believes about the Fed and the economy, not what the stock market will do next week. Read the shape, name the move, and let it set your sector bias and your position size rather than your exit date.
See it on the tape, not just in the headlines
TapeDash is the research desk for traders and investors: live options flow, dealer positioning, a real-time market scanner and trade alerts graded in public. Memberships open January 1, 2027, and the first 200 members lock Pro at $99 a month for as long as they stay.
Join the waitlistClick through the terminalSee the track recordSources
- Federal Reserve Bank of Cleveland: Yield Curve and Predicted GDP Growth
- Federal Reserve Bank of New York: The Yield Curve as a Leading Indicator (FAQ)
- Federal Reserve Bank of San Francisco: Economic Forecasts with the Yield Curve (Economic Letter 2018-07)
- Federal Reserve Bank of St. Louis: What Is the Probability of a Recession? The Message from Yield Spreads
- NBER: US Business Cycle Expansions and Contractions
- Congressional Research Service: The Yield Curve and Predicting Recessions
- Reuters via Kitco: U.S. yield curve reaches deepest inversion since 1981 (Mar 7, 2023)
- Bloomberg via BNN Bloomberg: U.S. two- and 10-year yields invert, flashing recession signal (Mar 29, 2022)
- Fortune: Yield curve inversion as a stock market and recession predictor (Mar 31, 2022)
- Fortune: Key recession indicator inverts, last eight recessions foreseen (Aug 2, 2022)
- Fortune: The bond yield curve disinverts as jobs data looks soft (Sep 4, 2024)
- Penn Mutual Asset Management: Uninverted (Sep 12, 2024)
- Hartford Funds: Yield curve regimes white paper
- investingLive: Bear flattening, bull flattening, bear steepening and bull steepening explained
- Advisor Perspectives: Yield curve shifts offer signals for stockholders
This article is for educational and informational purposes only. It is not financial, investment, medical or legal advice, and it is not a recommendation to buy or sell any security. Figures come from the sources listed and were checked on the date of publication; markets change quickly. Options trading involves substantial risk of loss.