Market Breadth: How to Tell If a Rally Is Healthy
Market breadth shows whether most stocks are joining a rally or a few giants are carrying it. Here is how to read the A/D line, new highs and other key gauges.
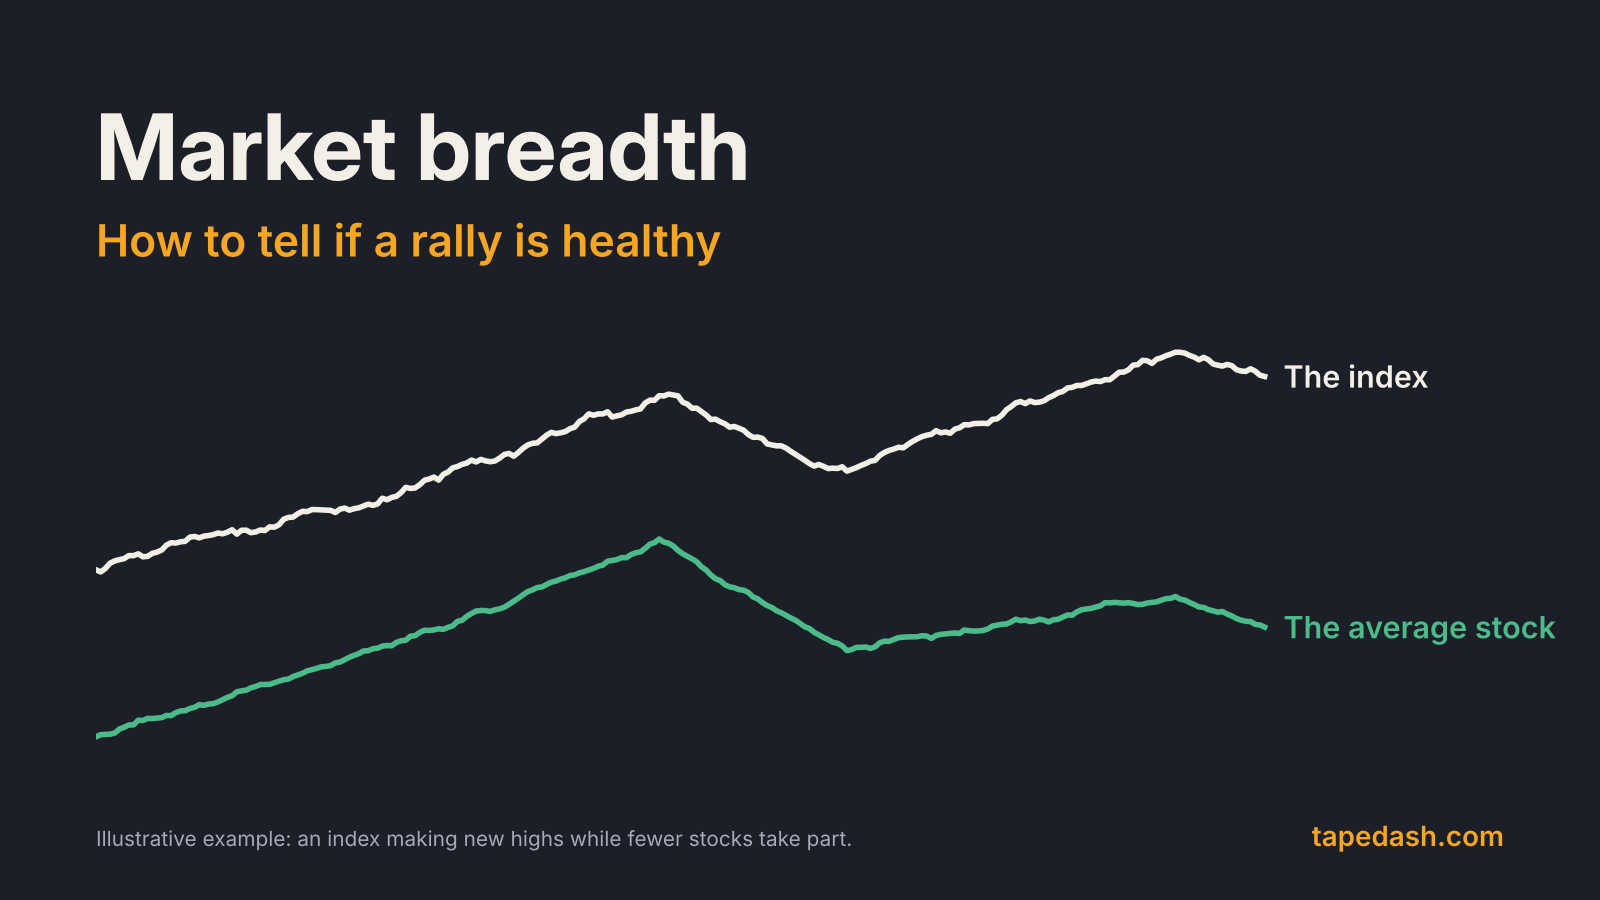
Market breadth measures how many stocks are taking part in a market move. A rally is healthy when most stocks rise with the index. It is fragile when the index climbs because a handful of the largest companies are doing the lifting while the typical stock goes sideways or down. Breadth indicators, such as the advance-decline line, the share of stocks above their 200-day moving average and the count of new highs versus new lows, are how traders tell those two situations apart.
Tuesday, October 27 was a good example of why it matters. The S&P 500 rose about 0.6% and the Nasdaq Composite gained more than 1%, while the Dow finished essentially flat, according to closing reports from AP and Yahoo Finance. AP’s wrap described a gain carried by a small group of influential AI stocks. The headline number said “up day.” Breadth asks how many stocks agreed.
This guide covers what market breadth is, the indicators worth knowing, how to read divergences without crying wolf, and the routine we use to judge whether a rally has real participation behind it.
- Market breadth compares the number of stocks rising with the number falling. It tells you whether a move is broad or narrow.
- The advance-decline line is the core gauge. When the index makes a new high and the A/D line doesn’t, participation is thinning.
- The share of stocks above their 200-day average and new highs vs. new lows show how many companies are in healthy long-term trends.
- Comparing the equal-weight S&P 500 with the cap-weighted index is the simplest breadth check available to anyone.
- Narrow breadth is a warning, not a timing signal. Markets can rally on thin participation for months.
What is market breadth?
Cap-weighted indexes like the S&P 500 and the Nasdaq 100 give the biggest companies the biggest say. When a few giants make up a large slice of the index, a strong day for them can push the whole index higher even if most members fall.
Breadth strips out that weighting. Every stock counts once. A day when 390 of 500 stocks rise is broad. A day when 160 rise and 340 fall is narrow, even if the index closes up the same 1% on both days.
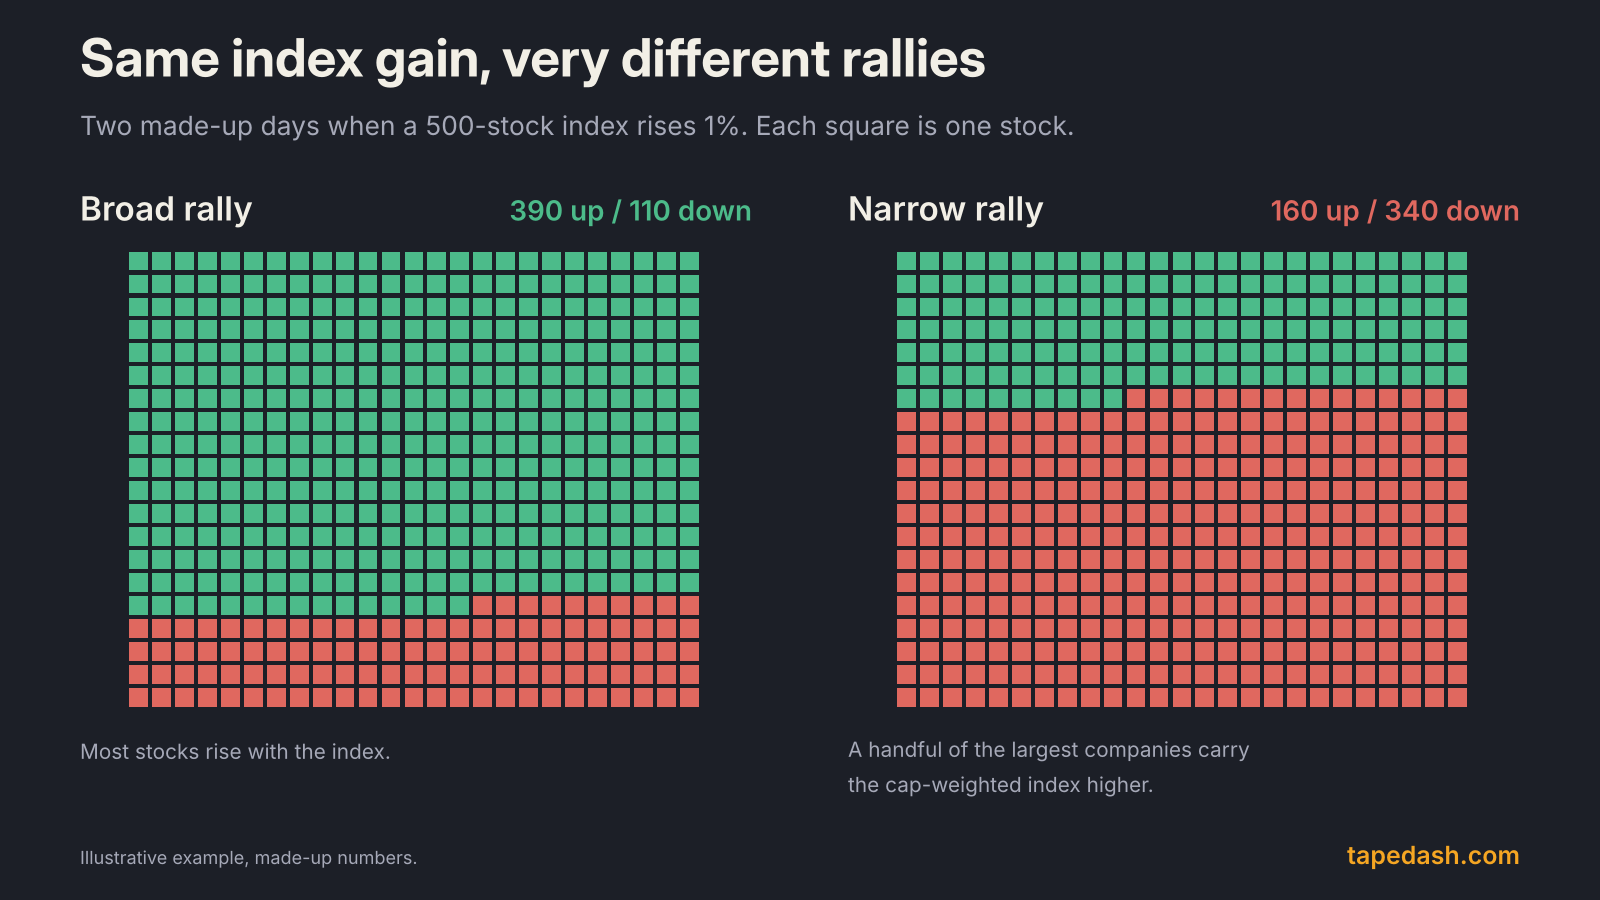
This matters because broad rallies tend to be sturdier. If hundreds of companies across sectors are rising, the advance doesn’t depend on any single story. If only a few are, the index is exposed to whatever happens to those few, whether that is an earnings miss, a regulatory headline or a rotation out of the theme. Breadth won’t tell you when a narrow market breaks. It tells you how much is riding on a small number of names.
The advance-decline line: the core breadth indicator
The advance-decline line is the oldest and simplest breadth tool. Each day, take the number of advancing stocks minus the number of declining stocks. That is net advances. Add it to the previous day’s total, and you get a running line that rises when more stocks go up than down and falls when the reverse is true (StockCharts).
The absolute level of the line doesn’t matter. The starting point is arbitrary. What matters is its direction compared with the index.
How to read an A/D line divergence
When the index and the A/D line make new highs together, participation is broad and the trend is confirmed. When the index makes a new high and the A/D line makes a lower high, fewer stocks are carrying the advance. That is a bearish divergence.
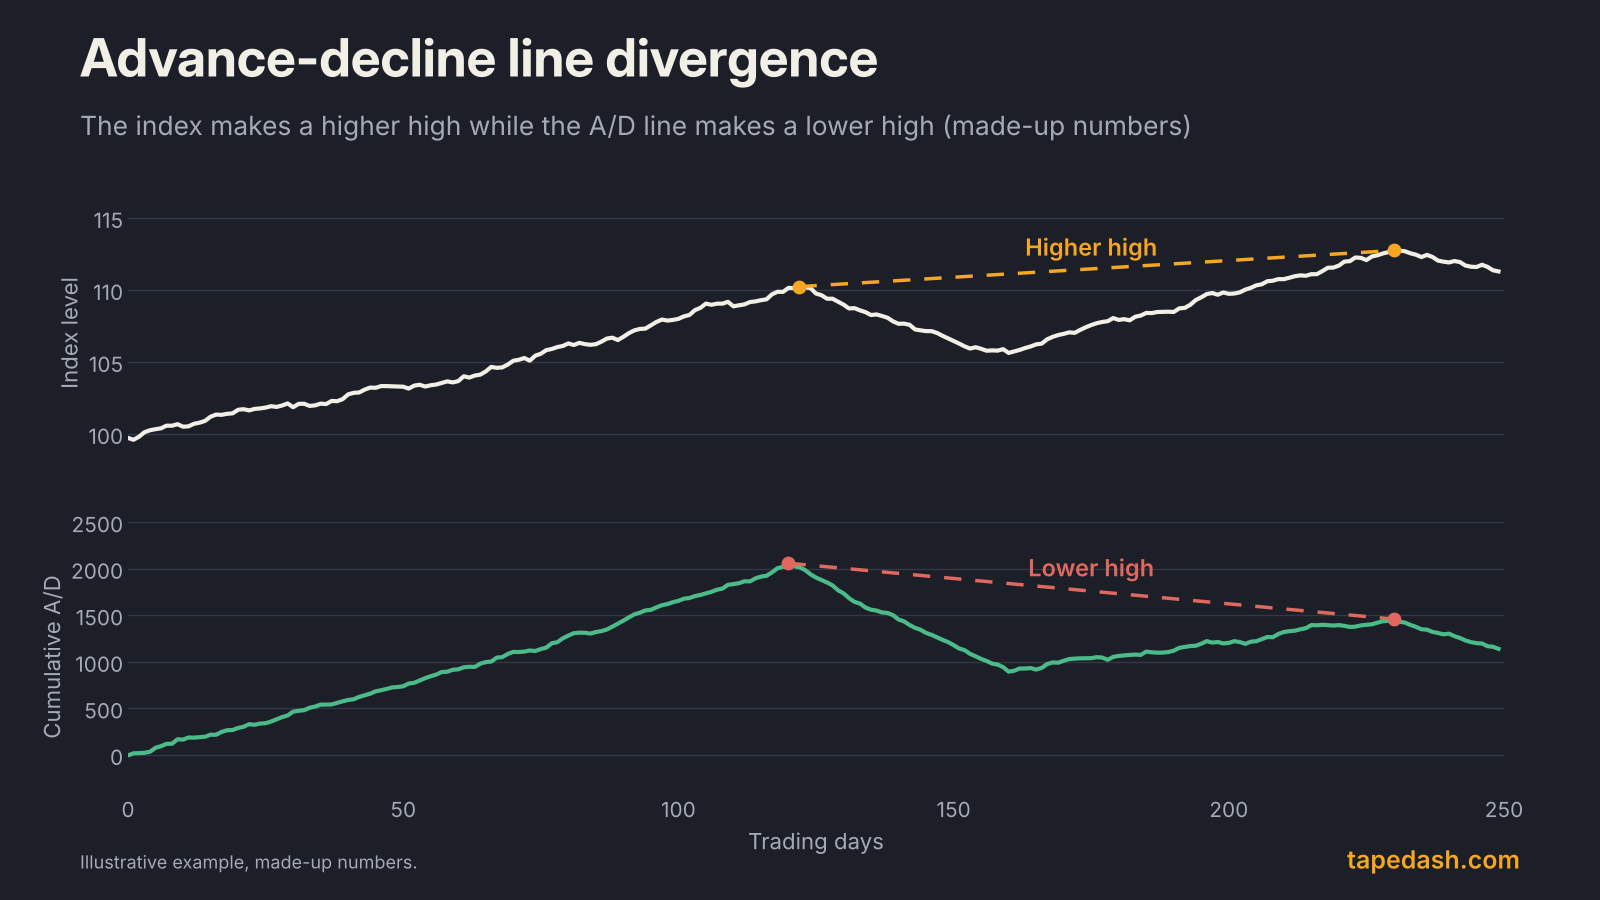
The reverse also works. If the index makes a new low but the A/D line holds a higher low, fewer stocks are participating in the decline, and selling pressure may be fading. Britannica and StockCharts both point to bearish A/D line divergences in the run-up to the 2008 bear market as a textbook case.
The caveats that matter
Two quirks are worth knowing before you lean on the A/D line. First, it treats a trillion-dollar company and a small-cap the same, so it leans toward small and mid-sized stocks, which make up most listings. That is the point of breadth, but it means a period when small caps lag for macro reasons, such as rising rates, can drag the line down even when large companies are fine. Second, the Nasdaq A/D line has a long-run downward drift because failing companies get delisted after years of counting as decliners, which StockCharts flags directly. Use the NYSE or S&P 500 versions for trend work, and compare the Nasdaq line with itself over shorter windows.
Other market breadth indicators worth knowing
The A/D line is the foundation. These gauges answer slightly different questions.
Percent of stocks above their 200-day moving average
This is the share of index members trading above their own 200-day moving average, which is a common definition of a long-term uptrend. A reading above 50% means more than half the index is in an uptrend. StockCharts’ David Keller describes using the 50% line as a dividing line between constructive and weak breadth (StockCharts). Many traders also track the 50-day version for a shorter-term read.
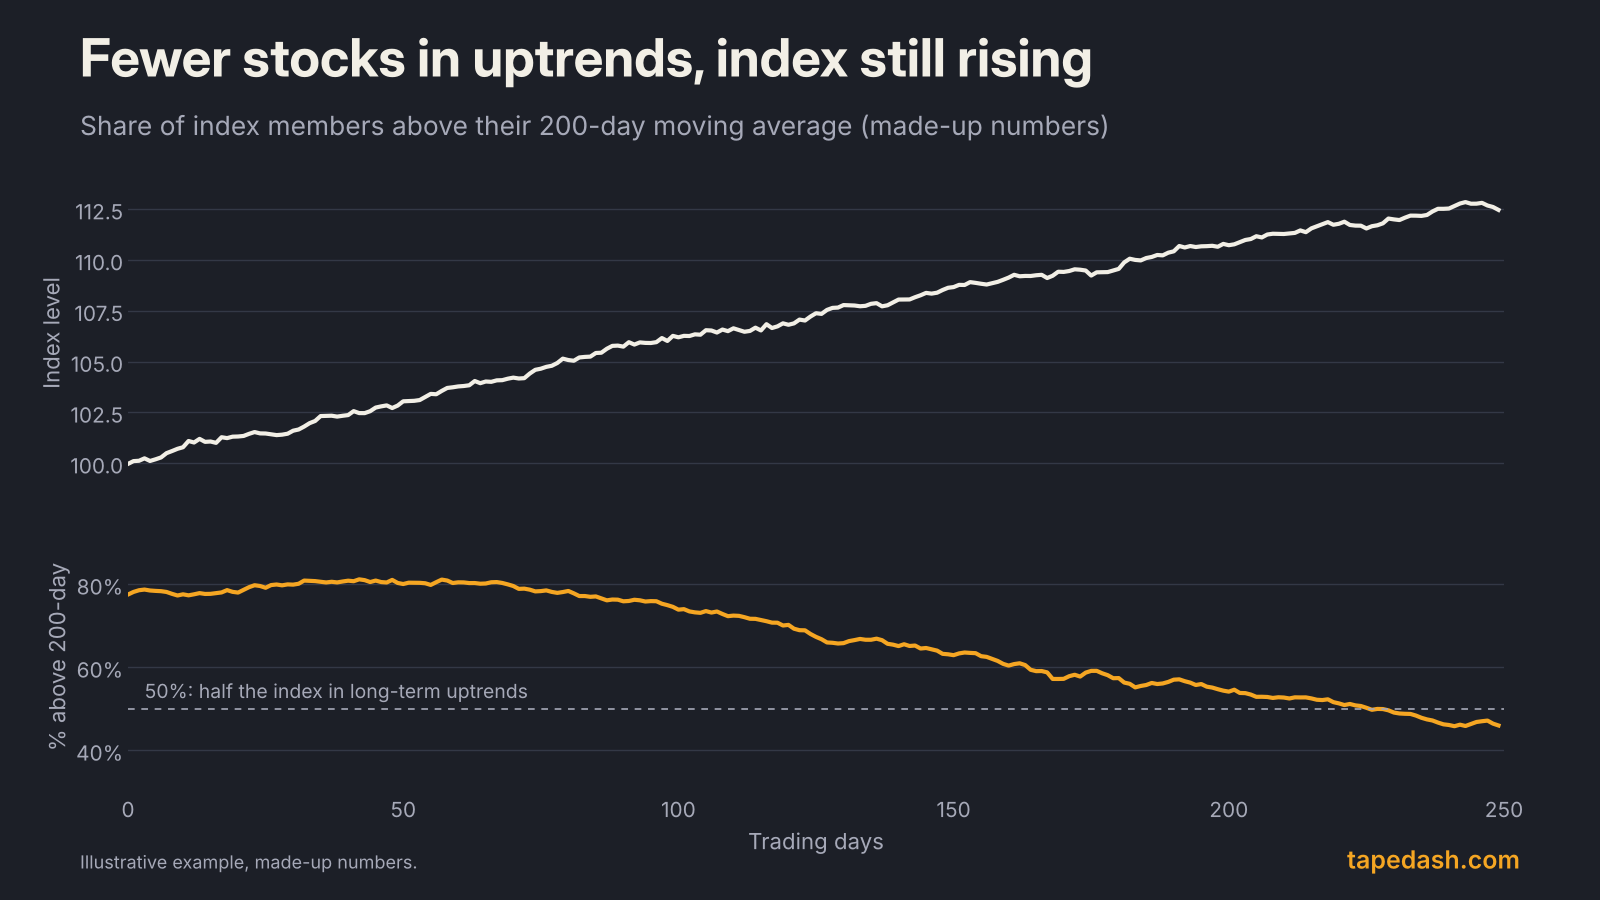
What I like about this one is that it shows erosion before price does. A market where the index is up but the share above the 200-day keeps falling is one where leadership is quietly narrowing.
New highs vs. new lows
Count how many stocks hit a new 52-week high and how many hit a new 52-week low. In a healthy uptrend, new highs expand as the index rises. If the index pushes to a record but fewer stocks are making their own new highs, the advance is narrowing (TradingView). StockCharts’ High-Low Index smooths this into one number: new highs as a percentage of new highs plus new lows, averaged over 10 days. Readings above 50 mean highs outnumber lows. Readings that stay above 70 tend to accompany strong uptrends, and readings that stay below 30 tend to accompany strong downtrends (StockCharts).
The McClellan Oscillator
Developed by Sherman and Marian McClellan, this is a momentum version of breadth (Capital.com). It subtracts a 39-day exponential moving average of net advances from a 19-day one. Above zero, breadth momentum is improving. Below zero, it is deteriorating. StockCharts uses a ratio-adjusted version that divides net advances by total issues, so readings are comparable as the number of listed stocks changes (StockCharts). Its running total, the McClellan Summation Index, gives a slower, longer-term read.
The Zweig Breadth Thrust
This one is rare and specific. Take the share of advancing issues out of advancing plus declining issues and smooth it with a 10-day exponential moving average. A thrust occurs when that reading moves from below 40% to above 61.5% within 10 trading days (BabyPips, TrendInvestorPro). It describes a market going from washed out to overwhelmingly broad buying in about two weeks.
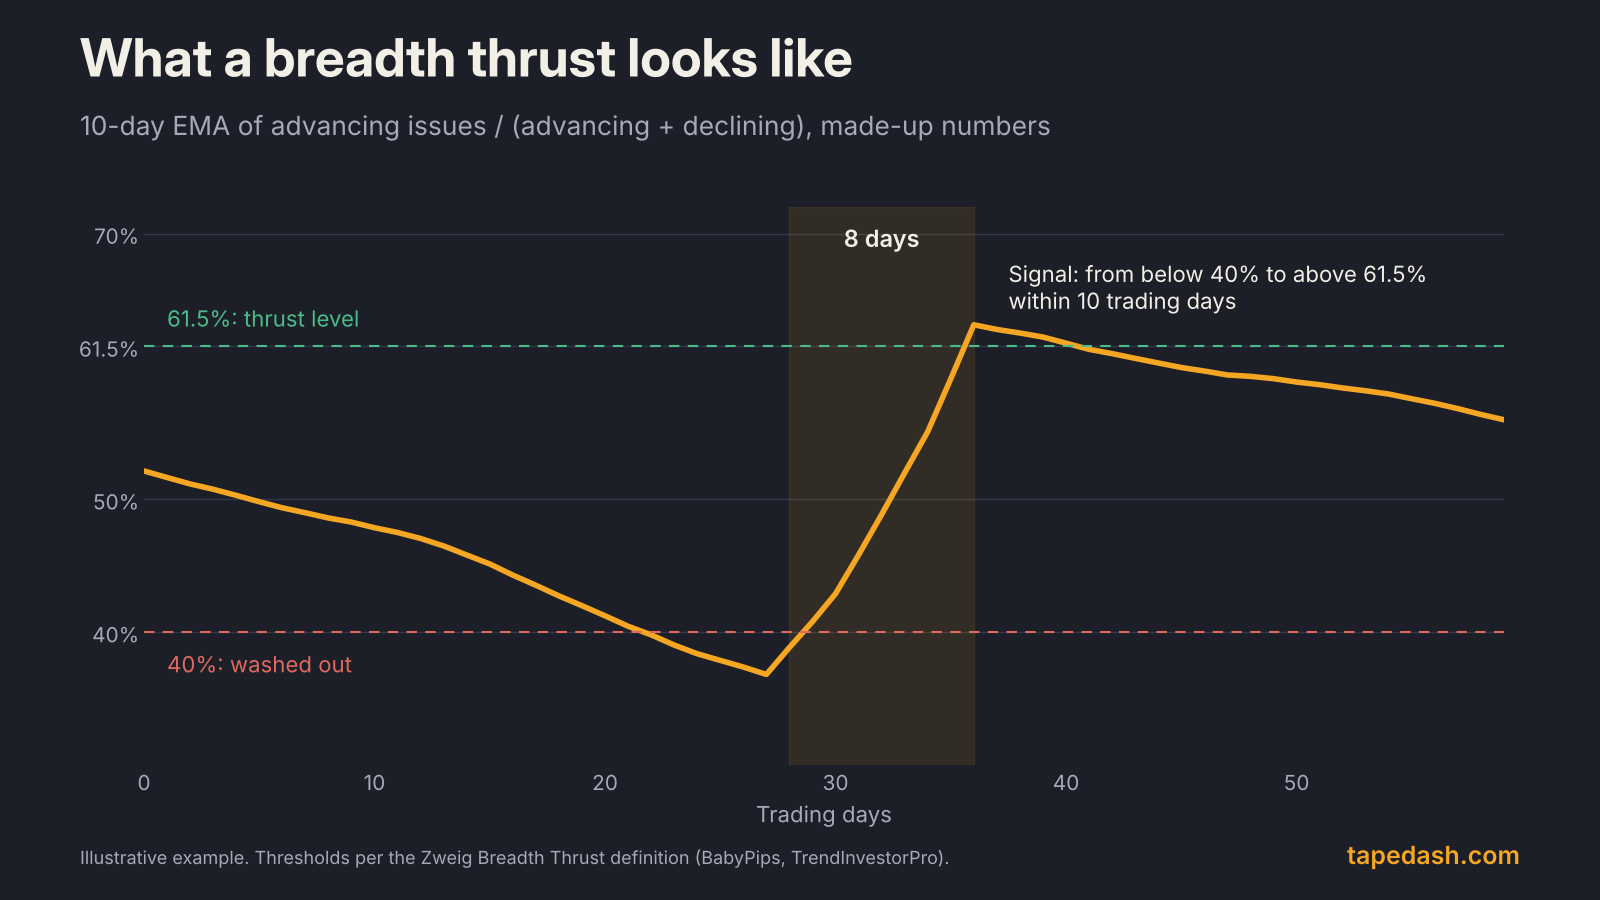
Breadth thrusts tend to appear near the start of new advances after sharp selloffs, which is why traders watch for them. They are also rare enough that a near miss, a surge that takes 12 days instead of 10, does not count.
Equal-weight vs. cap-weight
The easiest breadth check anyone can run is to compare the S&P 500 with its equal-weight version. The S&P 500 Equal Weight Index holds the same companies but gives each roughly 0.2% of the index and resets those weights every quarter (S&P Dow Jones Indices, ETF Trends). When the cap-weighted index beats the equal-weight one, the biggest companies are leading. When equal-weight wins, the average stock is keeping up or doing better. A chart of the ratio between the two tells you the direction of leadership at a glance.
Market breadth indicators compared
| Indicator | What it measures | Healthy reading | Warning sign | Best used for |
|---|---|---|---|---|
| Advance-decline line | Running total of advancers minus decliners | Makes new highs with the index | Index makes a new high, A/D line doesn’t | Confirming trends over weeks to months |
| % above 200-day average | Share of stocks in long-term uptrends | Above 50% and steady or rising | Falling while the index rises | Spotting slow erosion in participation |
| New highs vs. new lows | Stocks at 52-week highs vs. lows | New highs expanding as the index rises | Fewer new highs at index records | Checking leadership at market peaks |
| McClellan Oscillator | Momentum of daily net advances | Above zero | Lower highs while the index rises | Short-term breadth momentum |
| Zweig Breadth Thrust | Speed of a shift to broad buying | Below 40% to above 61.5% in 10 days | Not a warning tool | Spotting the start of new advances |
| Equal-weight vs. cap-weight | Average stock vs. biggest stocks | Ratio flat or rising | Ratio falling for months | A quick, accessible concentration check |
Narrow breadth is a warning, not a sell signal
This is the mistake I see most often. Someone spots a divergence, decides the market is about to roll over, and fights a rally that runs for another six months.
Narrow markets can persist for a long time. When the leadership group has real earnings growth behind it, the index can keep climbing while most stocks tread water. Breadth divergences tell you that the base of the rally is thin and that the index is more exposed to its leaders. They don’t tell you when that exposure will matter.
The way we use it on the desk is as a risk dial rather than an on/off switch. Strong, confirming breadth means we give trends more room. Deteriorating breadth means tighter risk on index-level positions, more attention to how the leaders react to news, and less willingness to chase breakouts. When breadth finally does break, it usually shows up in the leaders’ price action too, which is the confirmation worth waiting for.
How to use market breadth: a weekly routine
Here is a simple process you can run in 15 minutes once a week.
1. Compare the index with its A/D line. Pull up a six-month chart of the S&P 500 and the NYSE or S&P 500 advance-decline line. Are they making new highs together? If the index has made a new high in the last month and the A/D line hasn’t, note it.
2. Check the share above the 200-day. Is it above or below 50%? More important, is it rising or falling while the index rises?
3. Look at new highs. At the index’s most recent high, were more or fewer stocks making their own 52-week highs than at the previous index high?
4. Plot the equal-weight ratio. Divide the equal-weight S&P 500 by the cap-weighted one. A ratio sliding for months means leadership is concentrated.
5. Score it. If three or four of these confirm the trend, breadth is healthy. If two or more are diverging, treat the rally as narrow and adjust risk accordingly. Then check sector participation: a rally led by technology alone is narrower than one with financials, industrials and healthcare joining in.
Breadth also pairs well with the macro picture. Small caps and equal-weight indexes tend to be more sensitive to borrowing costs, so a shift in rate expectations can move breadth readings quickly. Our guide to the yield curve covers that link, and during earnings season, reading reports like a trader helps you judge whether the leaders still deserve to lead.
What to watch next
The near-term test for breadth is the Fed. The October decision lands Wednesday at 2:00 PM ET, and the next meeting runs December 8 to 9. Rate-sensitive small caps and the equal-weight index usually react more than the mega-caps, so the days after each decision are a good time to see whether participation is widening or narrowing. Earnings season is the other input. If results from the largest companies keep carrying the index while the average stock lags, expect the cap-weight versus equal-weight gap to keep widening.
How to track market breadth with TapeDash
If you want to watch whether a rally is broad or narrow as it happens, this is how we put it together. The Macro and Regime page tracks the market’s risk regime alongside rates, the dollar and credit, so you can see whether a narrowing rally is happening in a calm backdrop or a stressed one. Market Tide shows how options money across the market is leaning through the day, which helps separate a broad risk-on session from one where flow is piling into a few names.
The Live Scanner flags unusual moves, gaps and large prints across hundreds of stocks, so you can see quickly whether strength is spreading beyond the leaders. You can try it, with the rest of the terminal, in the free Terminal Preview without an account.
Market breadth FAQ
What is a good market breadth indicator for beginners?
Start with the equal-weight versus cap-weight comparison and the share of stocks above their 200-day moving average. Both are easy to find on free charting sites, easy to understand and quick to check once a week. Add the advance-decline line once you’re comfortable reading divergences.
Does bad breadth mean the market will crash?
No. Narrow breadth means the index depends on fewer stocks, which raises the stakes if those leaders stumble. Markets have climbed on narrow breadth for long stretches. Treat it as a reason to manage risk more carefully, not as a forecast of a decline.
What is the difference between market breadth and market sentiment?
Breadth measures what stocks are actually doing: how many are rising, falling or making new highs. Sentiment measures how investors feel, through surveys, put-call ratios or positioning. They often move together, but breadth is grounded in prices, which makes it harder to argue with.
The one idea to keep
The index tells you the score. Breadth tells you how many players are on the field. When most stocks rise with the index, give the trend room. When a few giants are carrying everything, keep riding it if you like, but respect how much now depends on so few names.
See it on the tape, not just in the headlines
TapeDash is the research desk for traders and investors: live options flow, dealer positioning, a real-time market scanner and trade alerts graded in public. Memberships open January 1, 2027, and the first 200 members lock Pro at $99 a month for as long as they stay.
Join the waitlistClick through the terminalSee the track recordSources
- StockCharts ChartSchool: Advance-Decline Line
- Britannica Money: Advance/decline line
- StockCharts ChartSchool: McClellan Oscillator
- Capital.com: What is the McClellan Oscillator
- BabyPips: Zweig Breadth Thrust
- TrendInvestorPro: Two ways to use the Zweig Breadth Thrust indicator
- StockCharts ChartSchool: High-Low Index
- TradingView: Market breadth, new highs and lows
- StockCharts (David Keller): Three breadth indicators to confirm a bullish market trend (May 10, 2024)
- S&P Dow Jones Indices: S&P 500 Equal Weight Index FAQ
- ETF Trends: Overcome S&P 500 concentration risk with RSP
- AP via BNN Bloomberg: AI stocks lift Wall Street closer to its record (Oct 27, 2026)
- Yahoo Finance: Stock market today, Tuesday Oct 27, 2026
- Finance Calendar: FOMC rate decision, October 2026
- Thrive in Markets: FOMC 2026 meeting dates
This article is for educational and informational purposes only. It is not financial, investment, medical or legal advice, and it is not a recommendation to buy or sell any security. Figures come from the sources listed and were checked on the date of publication; markets change quickly. Options trading involves substantial risk of loss.