How to Read the CPI Report: Headline, Core and What Traders Watch
How to read the CPI report: headline vs core, shelter, supercore, base effects and CPI vs PCE, using September's 3.7% print and what traders watch next.
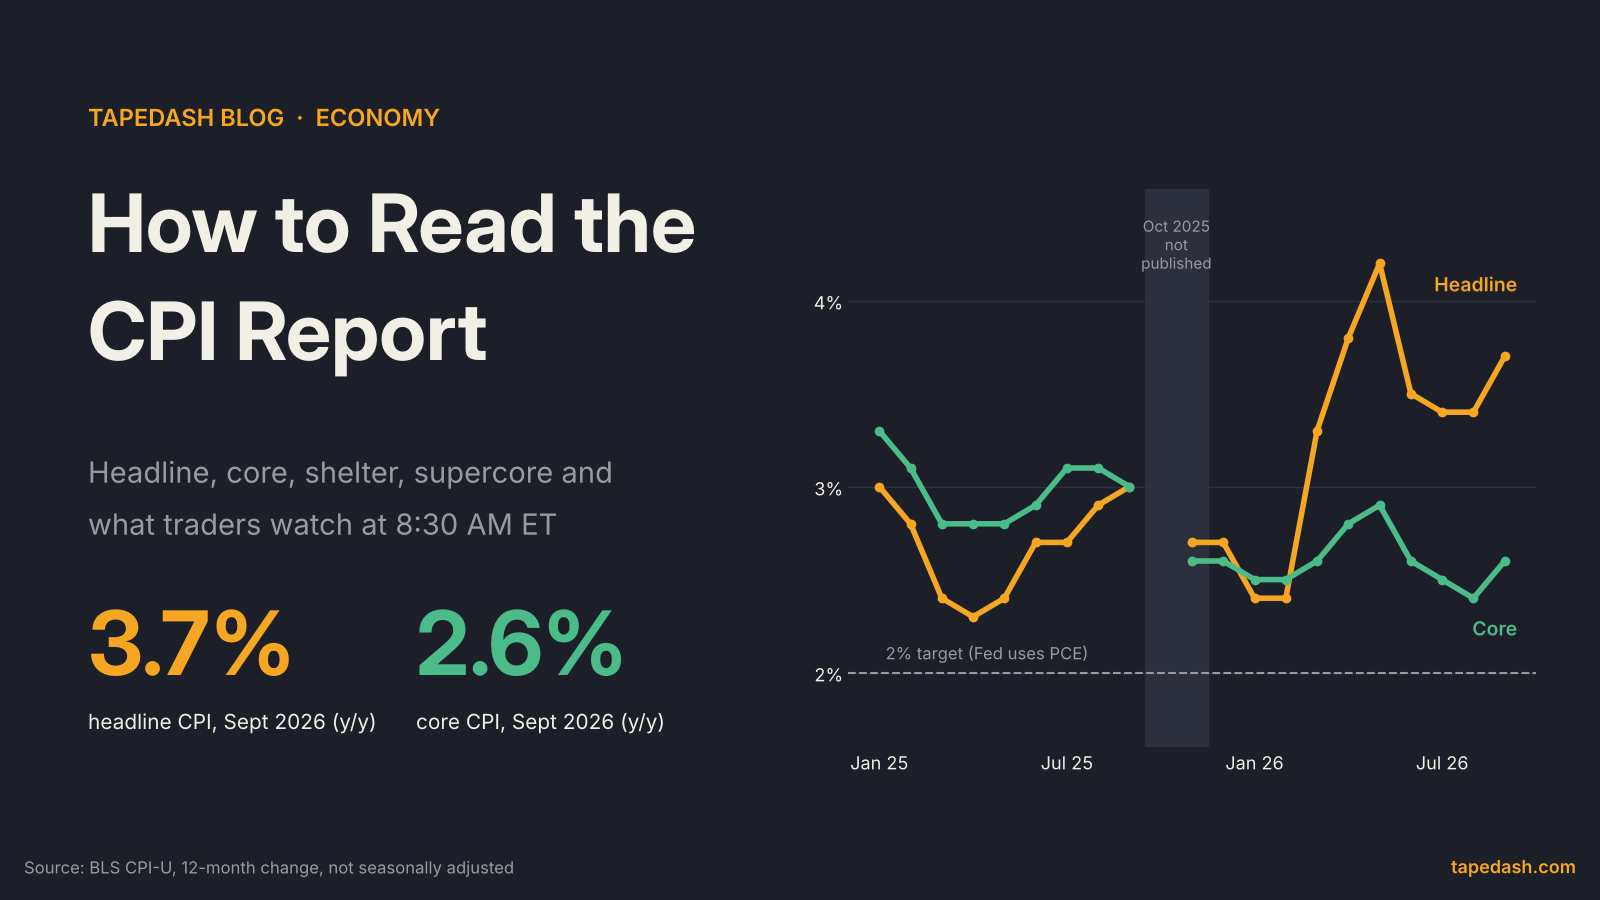
The September consumer price index came out on October 14, and it was hotter than most people expected. Prices rose 0.6% in the month and 3.7% from a year earlier, up from 3.4% in August, according to the Bureau of Labor Statistics and Reuters. Core CPI, which leaves out food and energy, rose 0.3% for the month and 2.6% for the year. Within the hour the bond market had repriced the Fed, the 10-year Treasury yield had briefly traded above 5.3%, and stocks were lower.
So how do you read the CPI report? Start with the monthly change in core CPI, compare it with what economists expected, and then work down the table to see which parts of the economy drove it: energy, shelter or the labor-heavy services the Fed calls supercore. The headline year-over-year number is the one on the news, but it is the slowest-moving and least informative figure in the release.
This guide walks through the report the way we read it on the desk at 8:30 AM ET: what CPI measures, headline vs core, why shelter is a lagging third of the index, how base effects and seasonal adjustment can fool you, how CPI differs from the PCE index the Fed actually targets, and how markets turn a tenth of a percentage point into a repricing of rate odds. It also covers an unusual wrinkle in the next release on November 10.
- Read core month-over-month first. September core CPI rose 0.3% against a 0.2% consensus. That surprise, not the 3.7% headline, is what moved rate odds.
- Headline is being driven by energy. Energy rose 5.2% in September and gasoline 9.1%, seasonally adjusted. Core is running far below headline.
- Shelter is about a third of CPI and moves slowly because rents are sampled every six months. Supercore (core services excluding housing) is the wage-sensitive piece the Fed watches.
- The Fed targets PCE, not CPI. Core PCE was 3.0% in August, above core CPI, because the two indexes weight things differently.
- The October CPI on Nov 10 is unusual. Because no October 2025 data was collected during the shutdown, BLS says it will not publish 12-month changes for most October 2026 indexes.
What the CPI report measures
The consumer price index tracks the prices urban households pay for a fixed basket of goods and services: groceries, gasoline, rent, car insurance, airfares, doctor visits, haircuts and so on. Each month BLS collects prices, compares them with the prior month, and weights each item by how much consumers spend on it. The main series is CPI-U, for all urban consumers, and it is the one quoted in the headlines.
The release comes out at 8:30 AM ET, usually in the second week of the month, and covers the prior month. September’s report came out on October 14. The headline index level was 336.940 (1982 to 1984 equals 100), according to BLS and Securities.io, though nobody trades the index level. What markets react to is the percentage change.
Two features of the basket matter for everything that follows. First, CPI measures what households pay out of pocket. Second, its weights are fixed for a year at a time. Both are the reasons it differs from the PCE index, which we will get to.
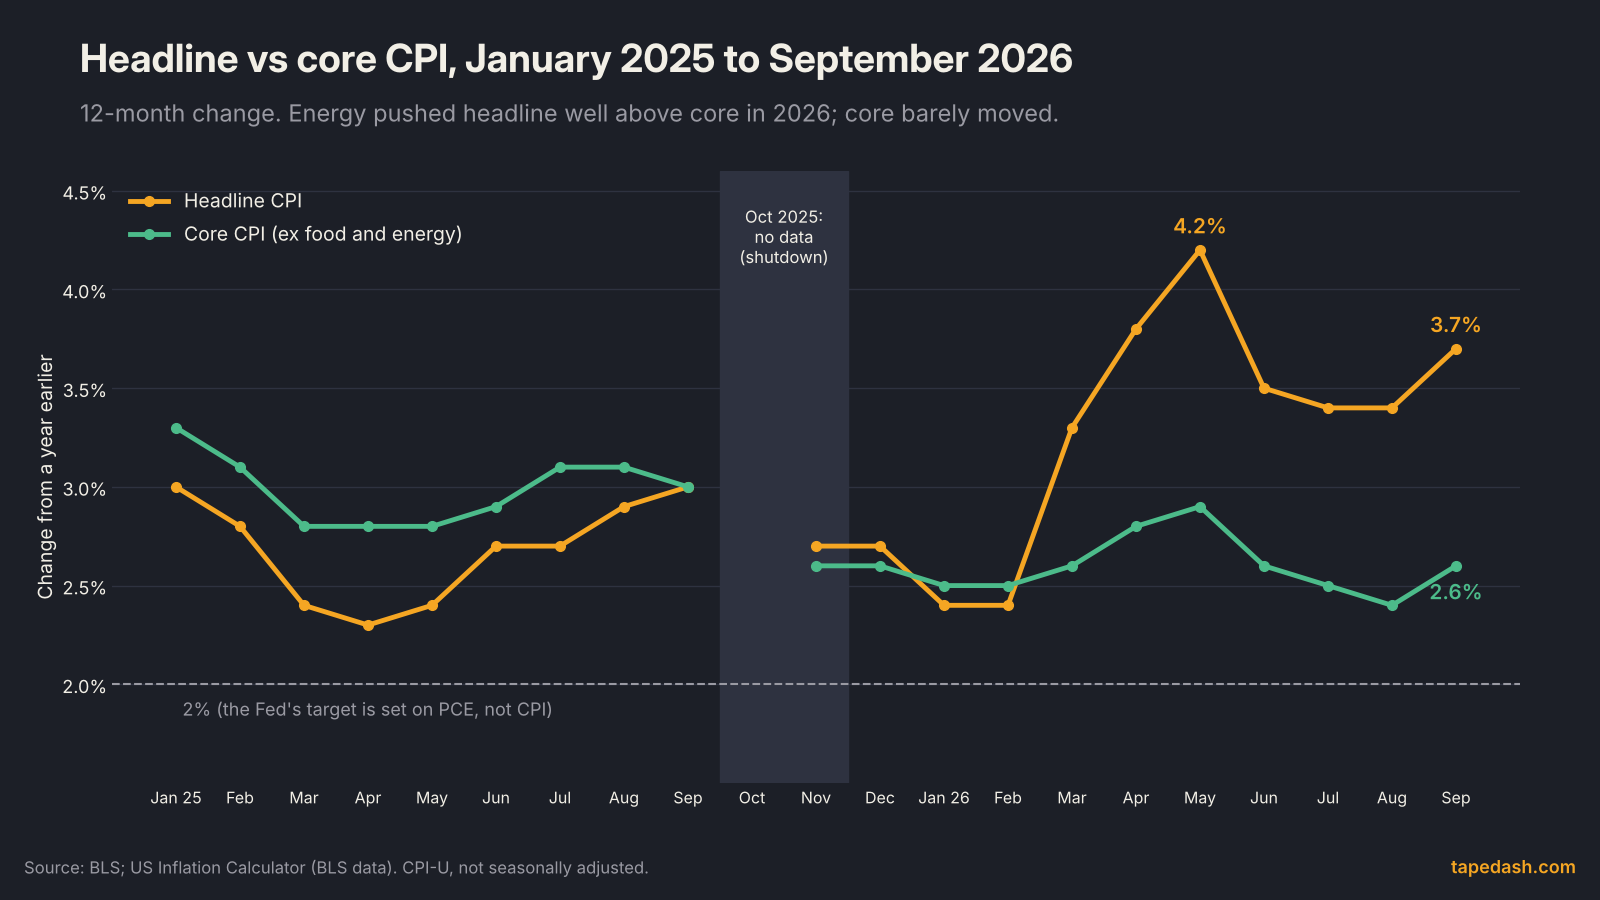
Headline CPI vs core CPI
Headline CPI is everything. Core CPI is everything except food and energy. The reason for stripping those out is simple: they swing hard for reasons that have little to do with underlying demand, such as a refinery outage, a drought or a geopolitical shock to crude. Those moves often reverse, and a central bank cannot do much about them with interest rates.
September 2026 is a clean example of why the split matters. Headline CPI rose 0.6%. Energy alone rose 5.2% and gasoline 9.1%, and BLS said gasoline accounted for more than half of the monthly increase in all items (BLS, First Trust). Food was flat. Over 12 months, energy was up 20.4% and gasoline 34.2%. Meanwhile core rose 0.3%, the same as in August.
The chart above shows the pattern all year. Headline went from 2.4% in February to 4.2% in May, then back to 3.4% by summer and 3.7% in September, according to US Inflation Calculator and SimianX, both drawing on BLS data. Core spent all of 2026 between 2.4% and 2.9%. If you only read headline, you would think inflation had doubled. Core says something more modest: prices outside energy are rising a little faster than the Fed wants, and in September that pace ticked up.
That does not mean headline is irrelevant. Gasoline is a large, visible price, and sustained energy inflation can seep into core through airfares, shipping costs and what people expect inflation to be. September’s 12-month airfare increase of 22.4% is one place where that pass-through shows up. But for judging the trend, core is the starting point.
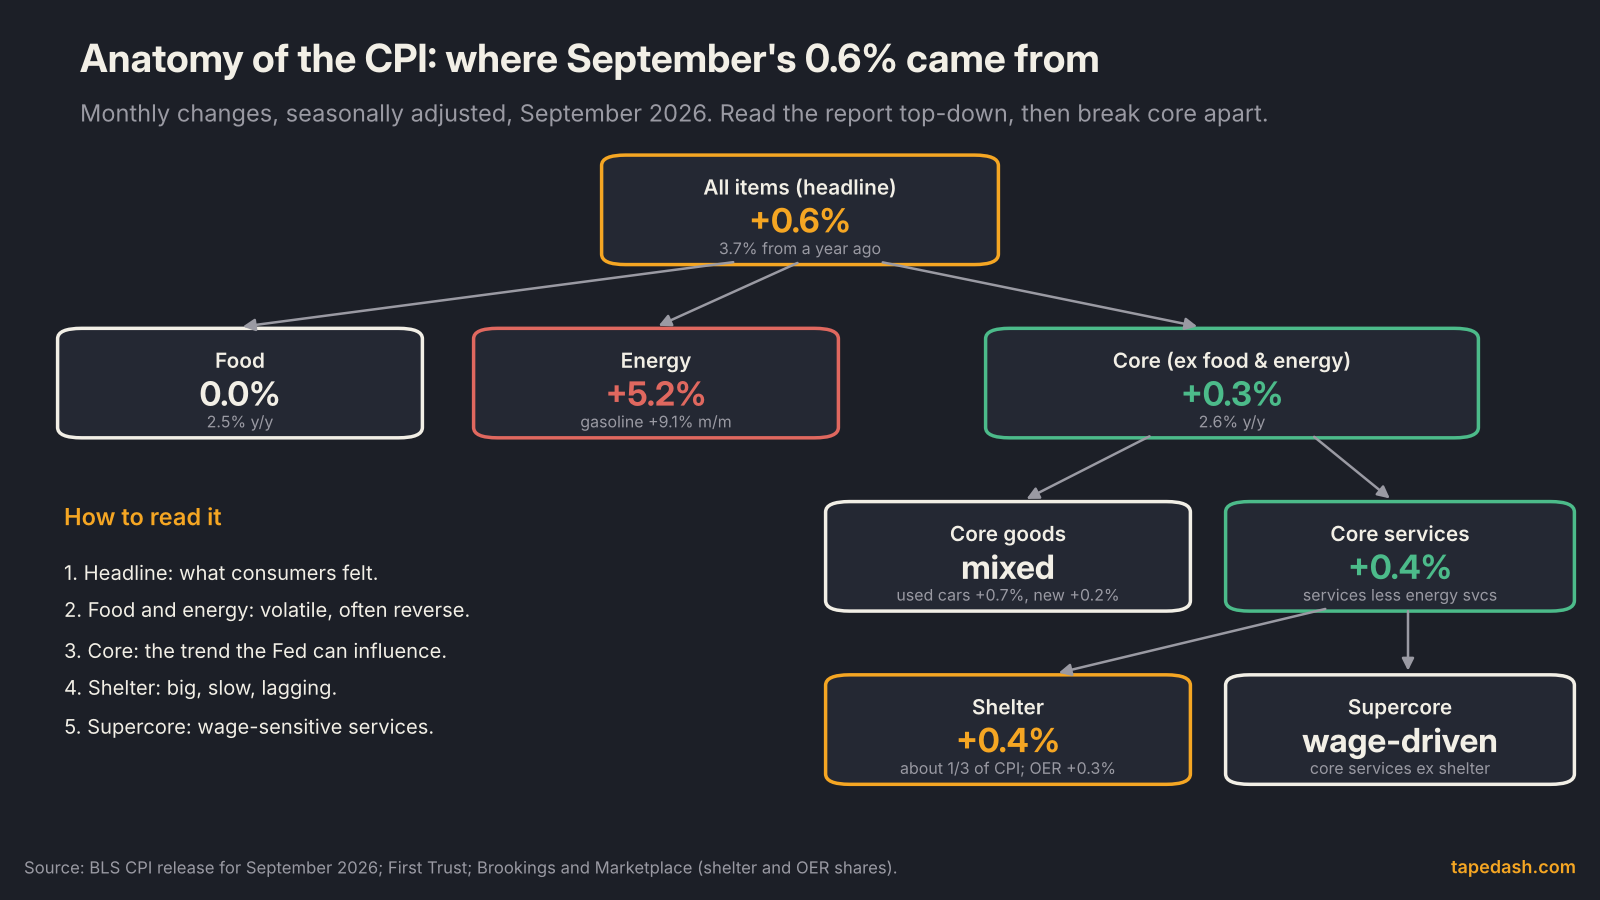
Shelter and owners’ equivalent rent: the slow third of CPI
Shelter is the biggest single piece of CPI, at roughly a third of the index, and owners’ equivalent rent (OER) alone is about a quarter of it, according to Brookings and Marketplace. OER is not a house price or a mortgage payment. It is BLS’s estimate of what homeowners would pay to rent their own homes, built from the rents of comparable rental units.
The important detail is the sampling. BLS prices each rental unit once every six months on a rotating schedule, so a big change in market rents shows up in CPI slowly, spread over many months. Brookings also points out that CPI tracks rents for continuing tenants, which adjust more slowly than asking rents on new listings. That is why private rent indexes usually turn months before CPI shelter does.
In September, shelter rose 0.4% and OER 0.3%. Over 12 months, shelter was up 3.2% and OER 3.3% (BLS, First Trust). Because shelter is so heavy, a 0.1 point swing in OER can decide whether core rounds to 0.2% or 0.3%. When I see a core surprise, shelter is the first row I check, because a shelter-driven miss tends to be noisy and a non-shelter miss tends to stick.
Supercore inflation: the services number the Fed watches
Supercore means core services excluding housing: things like medical care, car insurance, haircuts, airfares and other services where labor is a big part of the cost. Jerome Powell, then Fed chair, called core services ex housing “the most important category” for understanding core inflation, as CNN reported, because it tracks wage pressure more closely than goods or rents do.
BLS does not publish a single “supercore” line, so traders build it from the components or read it from data providers. The closest official row is services less energy services, which includes shelter. In September that row rose 0.4% for the month and 3.1% for the year (BLS, First Trust). With shelter at 0.4% too, services outside housing were not doing anything dramatic. That matters for the Fed: an energy shock that stays in energy is a different problem from wages pushing up service prices across the board.
Month-over-month vs year-over-year, and base effects
The CPI release gives two kinds of change, and they answer different questions. The monthly change tells you what happened last month. The 12-month change tells you what happened over the last year, which is really the sum of the last twelve monthly changes compounded together.
Traders care most about the monthly number because it is new information. The 12-month number is mostly old news: eleven of its twelve months were already known. A useful habit is to annualize the monthly figure. A 0.2% core month is roughly a 2.4% annual pace, close to the Fed’s goal. A 0.3% month is roughly 3.7%. That is why the gap between 0.2% and 0.3%, which looks tiny, moves markets.
How base effects distort the 12-month rate
Because the 12-month rate is a rolling window, it changes for two reasons: a new month comes in, and the same month from a year earlier drops out. If last year’s month was unusually hot, the annual rate can fall sharply even when this month is perfectly ordinary. That is a base effect.

This year has a large one built in. Headline CPI rose 0.9% in March 2026 alone, seasonally adjusted, per SimianX and Securities.io. That month stays inside the 12-month headline rate until the March 2027 report replaces it. When it drops out, the annual rate will likely fall noticeably even if prices keep rising at a normal pace. Anyone who reads that drop as “inflation is beaten” will be reading the arithmetic, not the economy. The fix is to look at the monthly numbers, or at three- and six-month annualized rates, which First Trust and others publish with each release.
Seasonal adjustment: why the monthly and annual columns differ
Some prices follow the calendar: gasoline in driving season, apparel around new collections, hotel rates around holidays. BLS removes those regular patterns from the monthly changes so that one month can be compared with the next. The 12-month change is not seasonally adjusted, because comparing September with September already cancels the seasonal pattern.
September’s gasoline line shows how much that adjustment can matter. Before adjustment, gasoline rose 6.5%. After adjustment it rose 9.1% (BLS, Securities.io). Gasoline prices usually ease after summer, so the seasonal model expected a smaller rise, and the adjusted figure treats the actual increase as bigger than normal. BLS also recalculates its seasonal factors each February, which is why monthly figures you saw on release day can shift by a tenth when you check them later.
CPI vs PCE: which inflation number the Fed targets
The Fed’s 2% inflation goal is defined using the personal consumption expenditures (PCE) price index from the Bureau of Economic Analysis, not CPI, as the Federal Reserve and the Atlanta Fed both explain. CPI still moves markets more on release day, because it comes out first and much of PCE is built from CPI prices. Traders use CPI to estimate the PCE number that follows a couple of weeks later.
The two indexes differ in scope and in weights. In a 2023 speech, Fed Governor Philip Jefferson noted that PCE covers spending made on households’ behalf, such as health care paid through Medicaid, and that its housing share is noticeably smaller than CPI’s. PCE weights also update every month, while CPI’s stay fixed for a year.
| Feature | CPI | PCE price index |
|---|---|---|
| Published by | Bureau of Labor Statistics | Bureau of Economic Analysis |
| Timing | About two weeks after month end | Late in the following month |
| What it covers | Out-of-pocket spending by urban households | All consumer spending, including what employers and government pay on households’ behalf |
| Shelter weight | About a third of the index | Noticeably smaller |
| Weights | Fixed for a year | Updated every month |
| Fed’s target | Not the official target | The 2% target is set on PCE |
| Latest core reading | 2.6% (September 2026) | 3.0% (August 2026) |
Normally PCE inflation runs below CPI, partly because of the weighting differences. This year the core measures have flipped: core PCE was 3.0% in August according to BEA and Reuters, while core CPI was 2.4% that month. Reuters attributed the gap to the different component weights. The practical lesson is that a calm core CPI does not guarantee a calm core PCE, and the Fed is looking at the second number. If you want more on how those readings turn into rate expectations, our guide to reading CME FedWatch walks through it.
How to read the CPI report step by step
When the release hits, I read it in the same order every time. The BLS summary table lists each major category with the last few monthly changes (seasonally adjusted) and the 12-month change (not adjusted). Here is September’s version, trimmed to the rows that matter.
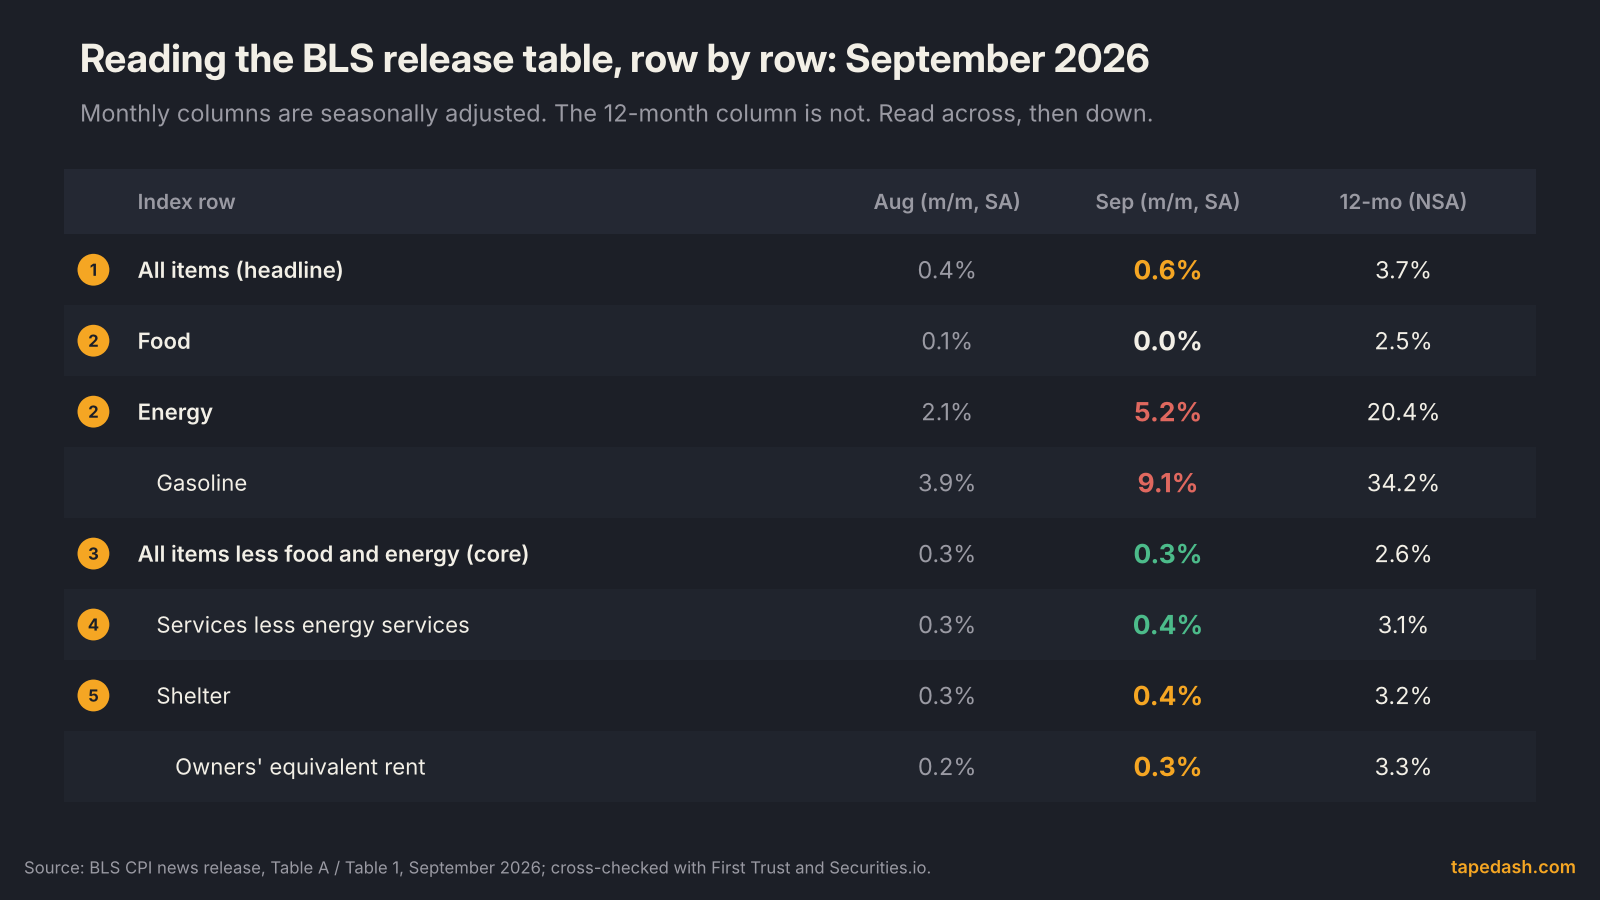
- Headline monthly vs consensus. All items rose 0.6%, in line with the 0.6% forecast in the Reuters poll. Headline 12-month was 3.7% against 3.6% expected (Reuters, investingLive). A small miss on headline.
- Food and energy. Food was flat; energy jumped 5.2%. That explains almost the entire gap between headline and core.
- Core monthly vs consensus. Core rose 0.3% against a 0.2% consensus (First Trust, investingLive). This is the line that matters most. Look past the rounding if you can: data services publish core to two decimals, and a 0.26% and a 0.34% both print as 0.3% but tell different stories.
- Services less energy services. Up 0.4%. Services are where sticky inflation lives.
- Shelter and OER. Shelter up 0.4%, OER 0.3%. If shelter explains the core miss, I discount it somewhat. If it does not, I take the miss more seriously.
- The 12-month column last. Core 2.6%, up from 2.4%. Then check what dropped out of the window before reading meaning into the change.
Read in that order, September said: energy drove the headline, core was a tenth hotter than hoped, and the firmness was spread across services and shelter rather than coming from one odd category. That combination is why the reaction was bigger than a 0.1 point miss would suggest.
How markets react to the CPI report
A CPI print moves markets through one channel first: expectations for the Fed. If inflation runs hotter than forecast, traders price fewer rate cuts or more hikes. Short-term Treasury yields rise with those expectations, the dollar tends to firm, and stocks whose value depends on distant earnings, such as long-duration growth names, usually take the hardest hit.
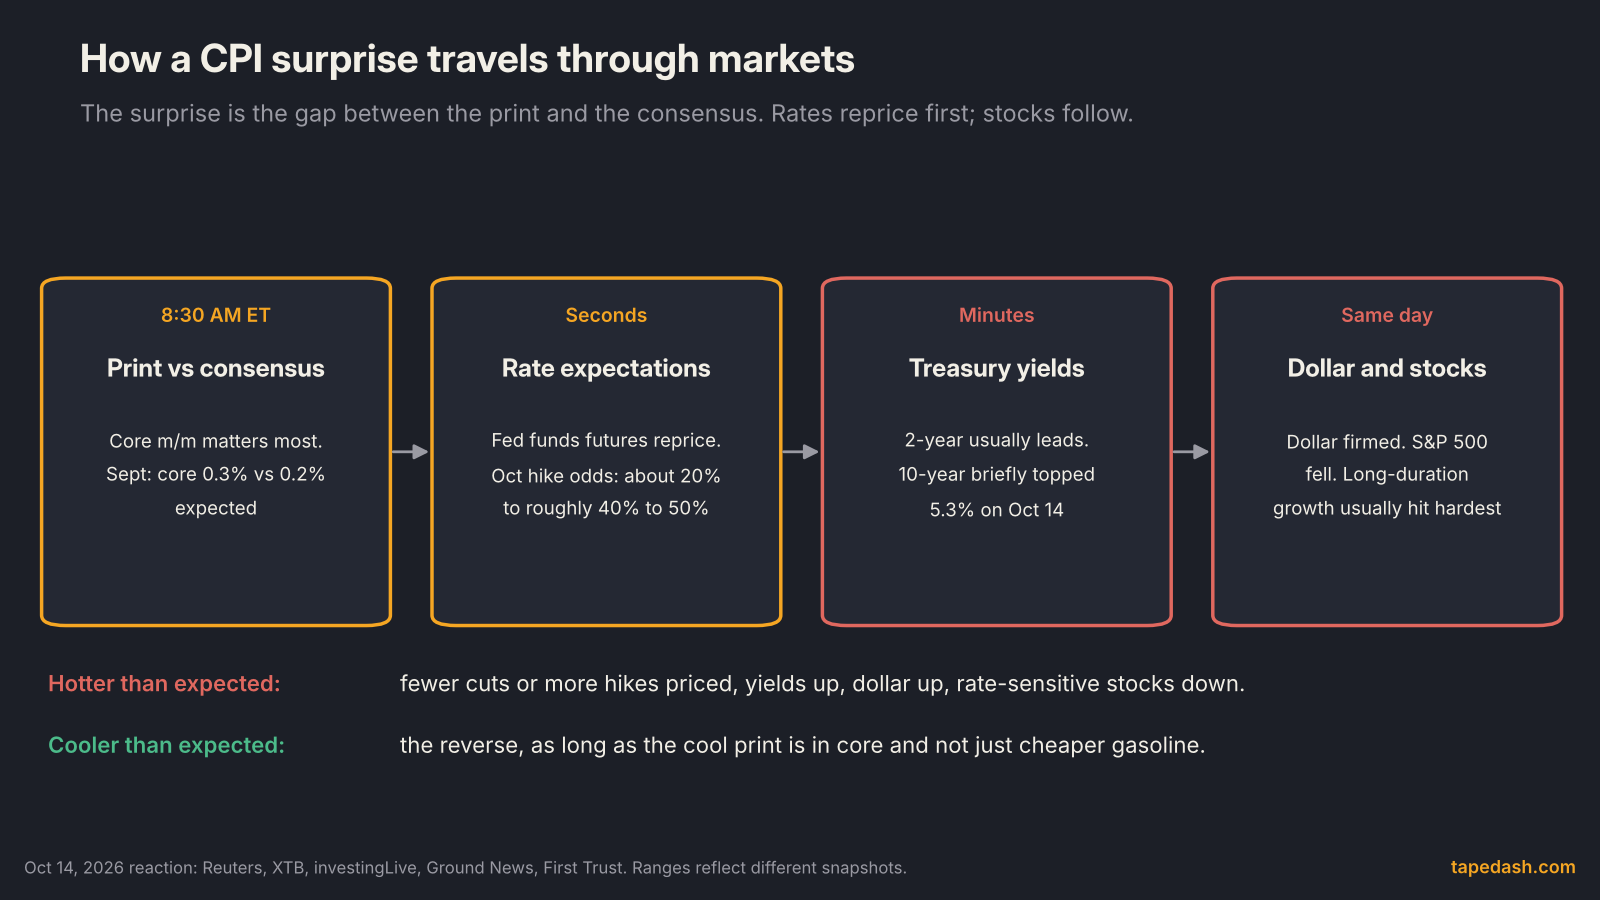
October 14 followed the script. Before the release, futures implied roughly a one-in-five chance of a rate hike at the October meeting. Afterward, estimates ranged from about 40% to about 50% depending on the source and time of the snapshot (XTB, investingLive, Ground News). The 10-year Treasury yield briefly traded above 5.3%, the dollar firmed and the S&P 500 fell. The yield curve guide explains why the short end usually moves first on data like this.
Three things decide how big the reaction gets. The size of the core surprise is the first. The second is where the surprise came from: a miss in supercore carries more weight than one in used cars or lodging. The third is what was already priced. When the market expects the Fed to hike, a hot print confirms the story and the move can be modest. When the market expects cuts, the same print forces a repricing and the move is larger. In my own process, I never treat the first five minutes as the verdict. The initial spike reflects the headline number; by 9:30 AM, after desks have dug into the components, the market has usually decided what the report really said.
What to watch next: the November 10 CPI and a missing base
The next CPI report covers October and comes out on Tuesday, November 10, at 8:30 AM ET, according to the BLS schedule and Eco3min. It will look different from a normal release.
During the federal funding lapse in the fall of 2025, BLS could not collect October 2025 price data and canceled that month’s report (AP via Star-Advertiser, BLS). Most series have no October 2025 index. Because a 12-month change for October 2026 needs an October 2025 base, BLS says it will not publish 12-month percent changes for October 2026 for the indexes missing that data, which covers most series. Eco3min likewise notes the October 2026 annual rate has no official base. Monthly changes for October 2026 should still be published as usual.
For traders, that makes the November 10 report almost purely a month-over-month event. Expect data providers and economists to fill the gap with their own estimates, and expect those estimates to differ. I would anchor on the official monthly core change and treat any “annual rate” headline that day as an estimate, not a BLS figure. Shelter deserves extra care too: BLS carried October 2025 rents forward, which froze the rent and OER indexes for that month, and Mortgage News Daily reported that BLS research later found every alternative method produced firmer shelter readings than the official ones (Mortgage News Daily, BLS).
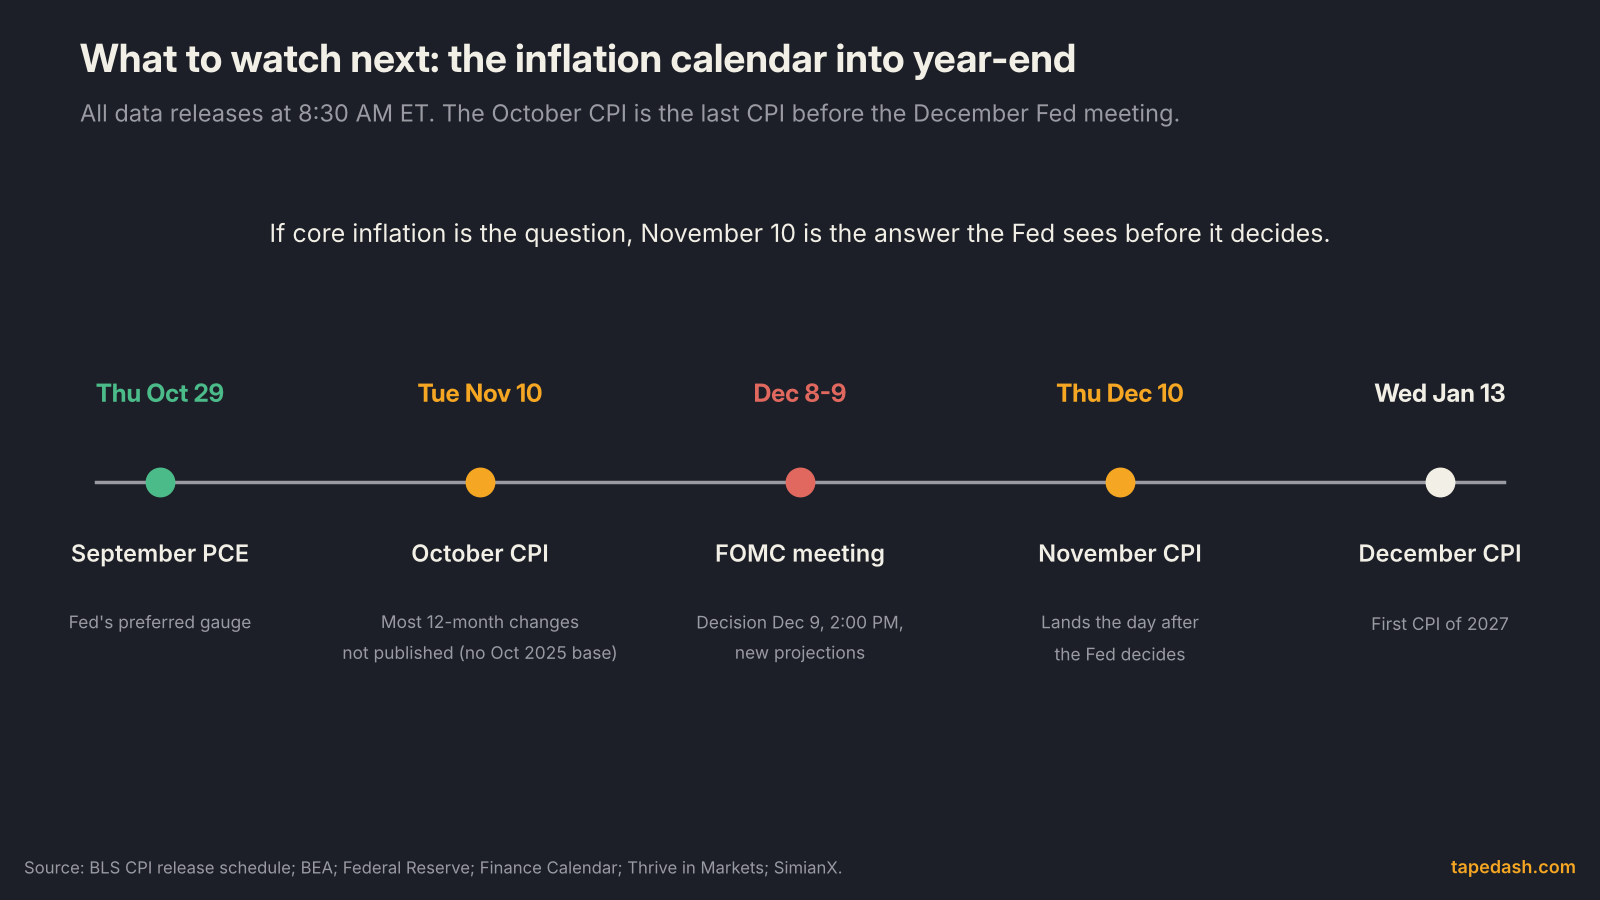
The dates around it, all at 8:30 AM ET for data:
- Thursday, October 29: September personal income and outlays, which includes PCE and core PCE (BEA, Thrive in Markets).
- Tuesday, November 10: October CPI.
- December 8 to 9: The last FOMC meeting of 2026, with the decision on December 9 and new economic projections (Federal Reserve, FedRateCalc).
- Thursday, December 10: November CPI, one day after the Fed decides (BLS, Finance Calendar).
- Wednesday, January 13, 2027: December CPI (BLS, SimianX).
That ordering is the key point for the next six weeks. If you want to know what inflation data the Fed will have in hand on December 9, it includes September PCE and October CPI, plus the jobs data. The labor side matters as much as prices right now, and our explainer on the jobs report covers how to read that one.
How we track CPI and the macro calendar in TapeDash
If you want to follow CPI the way it is described here, these are the TapeDash pages built for it. The Economy page lists each upcoming release with its time, the consensus forecast and the prior reading, then fills in the actual number and tags it above, below or in line with consensus once it prints. Each indicator also carries its history, the change versus the prior reading and a year ago, and a short note on what it is and how markets usually react, so a 0.3% core print comes with context instead of a bare number.
The Macro & Regime page is where we watch the reaction: Treasury yields, the dollar, credit and the market’s overall risk regime in one view, so you can tell whether a hot CPI is a one-day jolt or a change in the backdrop. Both are open in the free Terminal Preview with no account. If you would rather get the read after the close, the free TapeDash Daily covers the data, the rate repricing and what moved, and the first 200 members lock Pro at $99 a month for as long as they stay.
CPI report FAQ
What time is the CPI report released?
CPI is released at 8:30 AM ET, normally in the second week of the month, covering the previous month. The next release, for October, is Tuesday, November 10, 2026, and the one after that, for November, is Thursday, December 10.
Is core CPI or headline CPI more important?
For markets and the Fed, core is usually more important because it removes food and energy, which swing for reasons interest rates cannot fix. Headline still matters for consumers and for inflation expectations, especially when energy prices are moving as much as they did in 2026.
Why does the Fed use PCE instead of CPI?
The Fed defines its 2% goal using the PCE price index because it covers a broader range of spending, including what is paid on households’ behalf, and its weights adjust monthly as spending patterns change. CPI still matters because it arrives first and feeds directly into the PCE estimate.
The one idea to keep
The CPI headline is the number everyone quotes and the one that tells you the least. Read the monthly core change against the consensus, find out whether shelter, energy or services drove it, and check what is dropping out of the 12-month window before you trust any trend. On November 10 that discipline matters more than usual, because for most of the index there will be no official annual rate to quote. The monthly core number will carry the whole report.
See it on the tape, not just in the headlines
TapeDash is the research desk for traders and investors: live options flow, dealer positioning, a real-time market scanner and trade alerts graded in public. Memberships open January 1, 2027, and the first 200 members lock Pro at $99 a month for as long as they stay.
Join the waitlistClick through the terminalSee the track recordSources
- U.S. Bureau of Labor Statistics: Consumer Price Index Summary, September 2026
- U.S. Bureau of Labor Statistics: CPI news release with tables (PDF), September 2026
- U.S. Bureau of Labor Statistics: 2025 federal government shutdown impact on the CPI, FAQ
- U.S. Bureau of Labor Statistics: CPI release schedule
- Reuters via Devdiscourse: US consumer prices accelerate in September on costlier gasoline; core CPI firmer (Oct 14, 2026)
- First Trust: The Consumer Price Index rose 0.6% in September (Oct 14, 2026)
- investingLive: US September CPI 3.7% vs 3.6% expected (Oct 14, 2026)
- Securities.io: U.S. CPI rises 0.6% in September as gasoline lifts annual rate to 3.7%
- XTB: US inflation concerns rise (Oct 14, 2026)
- Ground News: 10-year Treasury yield briefly tops 5.32% after hotter CPI
- Bureau of Economic Analysis: Personal Income and Outlays, August 2026
- Thrive in Markets: Next core PCE release, Oct 29, 2026
- Federal Reserve: What is inflation and how does the Fed measure it
- Federal Reserve: Governor Jefferson on CPI and PCE inflation measurement (Feb 27, 2023)
- Federal Reserve Bank of Atlanta: What is PCE? Explaining the Fed's preferred inflation measure
- Brookings: How does the Consumer Price Index account for the cost of housing?
- Marketplace: Owners' equivalent rent and shelter in the CPI
- CNN: The new inflation buzzword is supercore
- Mortgage News Daily: CPI shelter data and the shutdown (May 15, 2026)
- Honolulu Star-Advertiser (AP): October CPI report scrapped after government shutdown
- US Inflation Calculator: Current US inflation rates, 2000 to 2026
- SimianX: Latest US inflation numbers, CPI calendar through 2027 and release-day data
- Eco3min: Next US CPI release, date, time and base effect
- Finance Calendar: US CPI report, December 2026
- Federal Reserve: December 2026 calendar
- FedRateCalc: FOMC meeting schedule, December 2026
This article is for educational and informational purposes only. It is not financial, investment, medical or legal advice, and it is not a recommendation to buy or sell any security. Figures come from the sources listed and were checked on the date of publication; markets change quickly. Options trading involves substantial risk of loss.