The VIX Explained: What the Fear Gauge Measures and How to Use It
The VIX explained in plain English: how Cboe builds the fear gauge, the rule of 16, term structure, record spikes, and how traders actually read it.
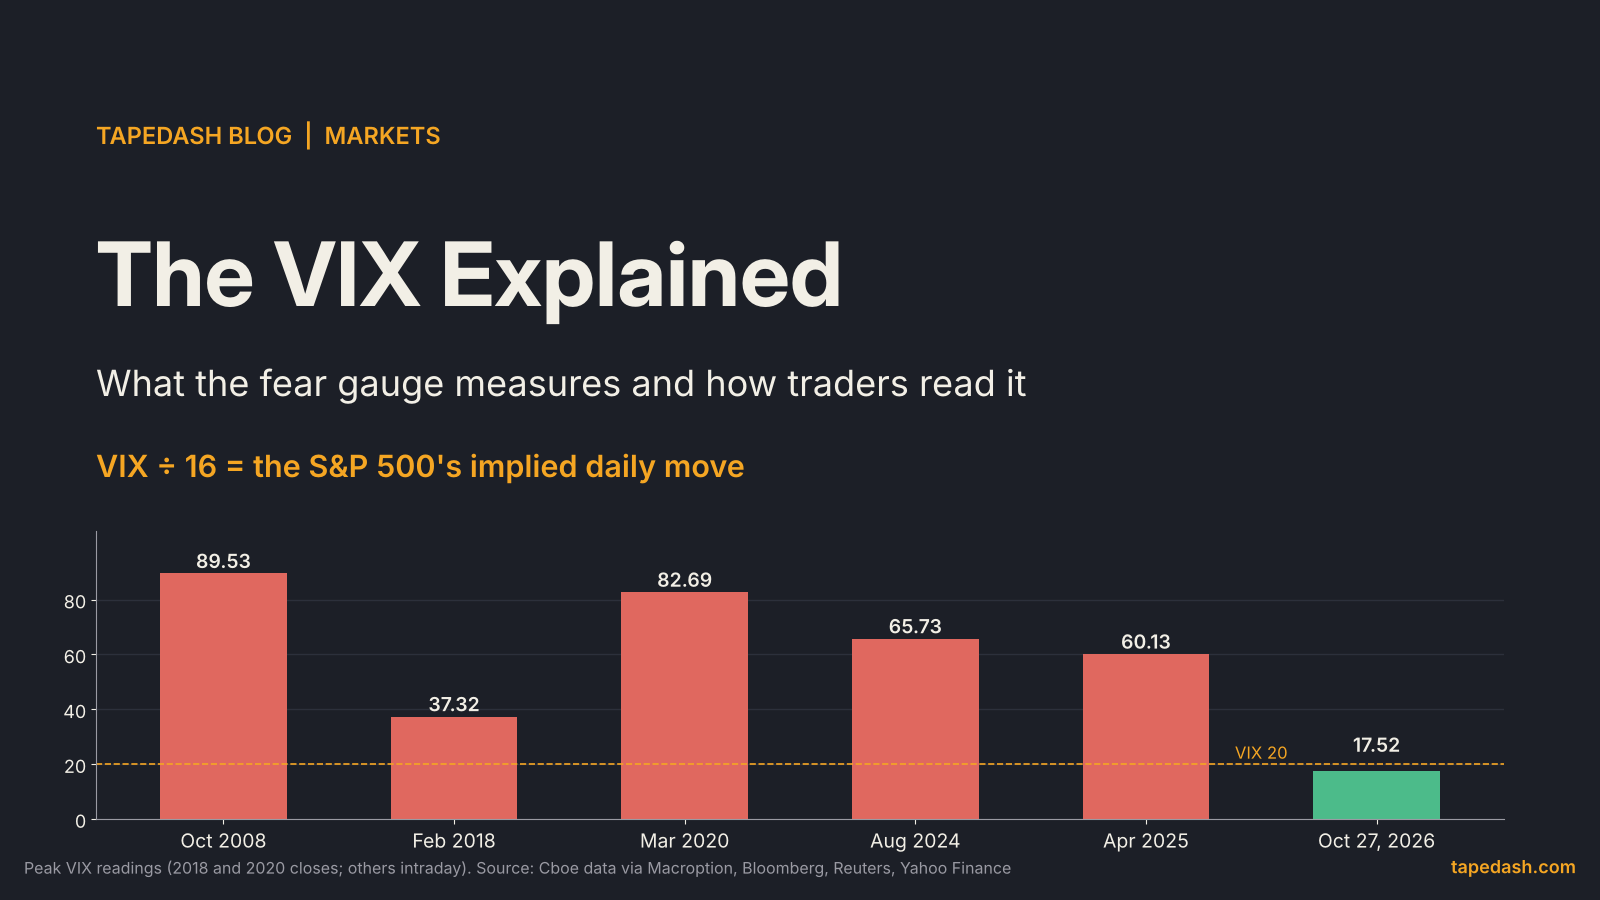
The VIX walked into today’s Fed decision looking relaxed. Cboe’s Volatility Index closed Tuesday at 17.52, down 4.7% on the day, according to both Zacks’ morning market note on Yahoo Finance and ad-hoc-news. On a day with a 2:00 PM ET rate decision and a press conference behind it, that is a market paying for some protection, but not much.
So what does 17.52 actually mean? Here is the VIX explained in one sentence: it is the 30-day implied volatility of S&P 500 options, quoted as an annualized percentage. Cboe’s own methodology describes it as a measure of the market’s expectation of 30-day forward-looking volatility. It is not a measure of how far stocks have fallen, and it is not a forecast of direction. It is the price of insurance, turned into a number.
This guide covers how Cboe builds the fear gauge in plain words, the quick math that turns a VIX reading into an expected daily move, why the VIX term structure tells you more than the headline number, what the big spikes looked like, and why you cannot simply buy the VIX. If you want the underlying concept first, our guide to implied volatility and the expected move covers it, and I will not repeat it here.
- The VIX measures the 30-day implied volatility of S&P 500 options. It is built from option prices, not from past stock moves.
- Divide the VIX by 16 for a rough one-standard-deviation daily move in the S&P 500. Tuesday’s 17.52 close works out to about 1.1% a day.
- The term structure (VIX9D, VIX, VIX3M and beyond) usually slopes upward. When short-dated volatility trades above longer-dated volatility, the market is pricing stress now rather than later.
- Record readings include an 89.53 intraday high in October 2008 and an 82.69 close on March 16, 2020. Intraday peaks often run far above the close.
- You cannot buy the VIX itself. Futures and the funds that hold them tend to lose value when the curve is in contango, even if the VIX does not move.
What is the VIX index?
The Cboe Volatility Index started in 1993. It originally used S&P 100 options and was rebuilt in 2003 around the much larger S&P 500 options market, a history both Cboe and Charles Schwab lay out. Schwab’s shorthand is the right one to hold onto: people watching the VIX are watching the implied volatility of SPX options.
That framing explains the nickname. When investors get nervous, they buy S&P 500 puts to protect portfolios. More demand for puts pushes up their prices, higher option prices mean higher implied volatility, and the VIX rises. When markets are calm and nobody wants insurance, option prices sag and the VIX drifts lower. Fear is just the story we tell about the order flow.
Three things the VIX is not:
- It is not a crash predictor. It reacts to selling far more often than it anticipates it.
- It is not symmetric. The VIX tends to jump when stocks fall and grind lower when they rise, because protection demand is lopsided.
- It is not tradable. It is a calculated index, like the S&P 500 itself. More on that below.
How Cboe calculates the VIX, in plain words
The VIX does not come from a pricing model like Black-Scholes. Cboe takes a wide strip of real option prices and adds them up in a way that captures the market’s total bet on movement.
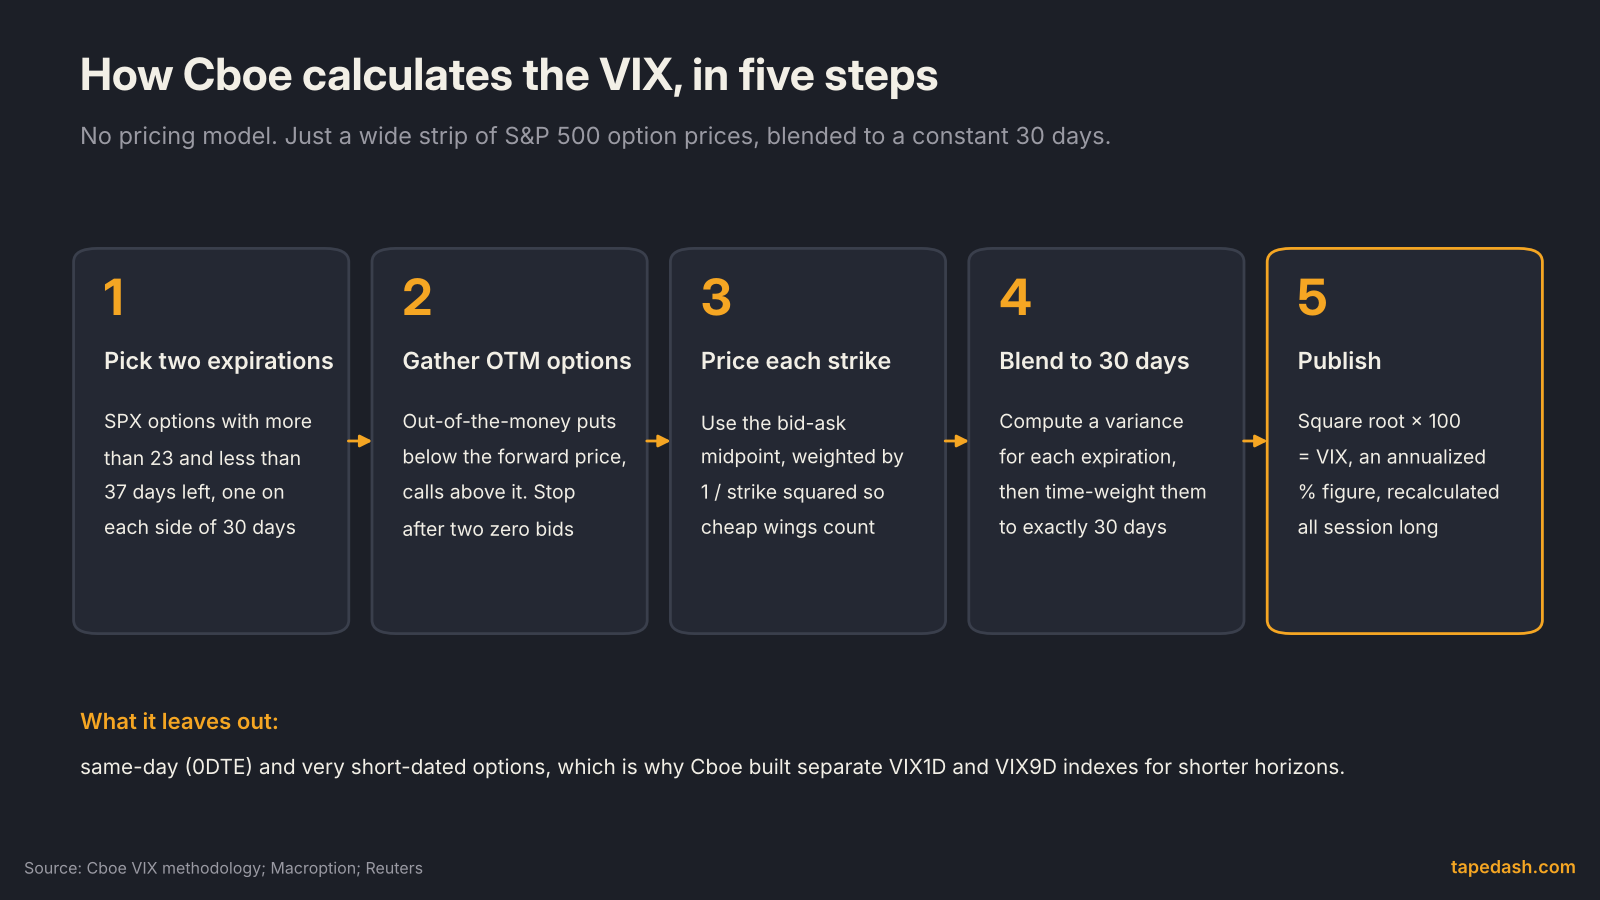
Here is the sequence in plain terms.
Pick two expirations. The calculation uses two S&P 500 expirations with more than 23 and fewer than 37 days to go, one on each side of 30 days. Both Macroption’s step-by-step walkthrough and Reuters’ reporting give that window. Weekly SPX options are included, so the pair rolls forward every week.
Gather out-of-the-money options. For each expiration, Cboe uses puts below the forward price of the index and calls above it, moving outward strike by strike until it hits two consecutive strikes with zero bids. In-the-money options are left out.
Price each strike. Each option is valued at the midpoint of its bid and ask, and its contribution is weighted by one over the strike squared. That weighting matters: it means cheap far-out-of-the-money puts still count, which is why the VIX reacts so sharply when crash protection gets bid.
Blend to 30 days. Cboe computes a variance for each expiration, then time-weights the two so the result reflects exactly 30 days. Per the Cboe methodology, time is measured in minutes, not days.
Publish. The square root of that variance, times 100, is the VIX.
One consequence worth knowing: same-day options sit outside the window entirely. That is why Cboe launched a separate 1-day index, VIX1D, on April 24, 2023, as both Cboe’s announcement and Reuters reported. If you trade around a single event like a Fed decision, the 30-day VIX dilutes that event across a month. The 0DTE market prices it head-on.
The rule of 16: turning the VIX into an expected daily move
The VIX is annualized, which makes it awkward to use on its own. Nobody trades a year at a time. The fix is a piece of arithmetic every options desk uses.
Volatility scales with the square root of time. A year has roughly 252 trading days, and the square root of 252 is about 15.87, so dividing an annualized volatility by 16 gives an approximate one-day figure. Schwab walks through exactly this: a VIX of 16 implies roughly 1% daily moves, 24 implies about 1.5%, and 32 about 2%. Option Alpha describes daily volatility the same way, as about one-sixteenth of the annual number.
Apply it to Tuesday’s close: 17.52 divided by 16 is about 1.1%. That is the options market saying a typical day, one standard deviation, is a move of roughly 1.1% in the S&P 500 either way. For a month, multiply the VIX by the square root of 30/365 (about 0.29) and you get roughly 5%.
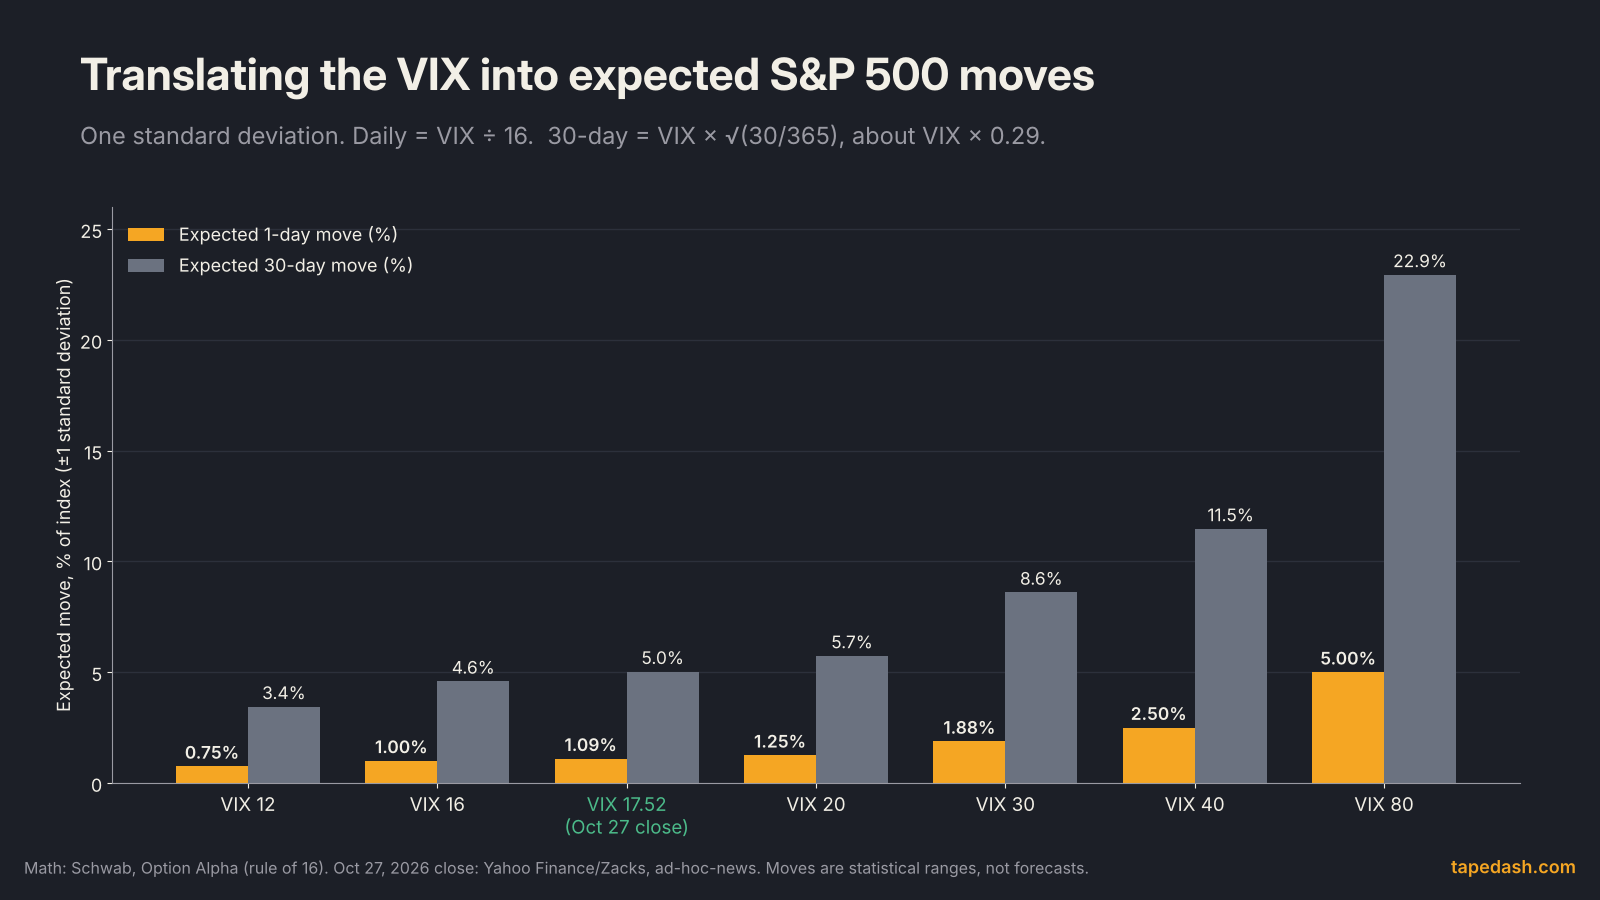
Two cautions before you lean on this. First, one standard deviation is not a ceiling. Markets have fat tails, and moves of two or three times the implied daily range happen more often than a textbook bell curve suggests. Second, the VIX usually prices a bit more movement than the S&P 500 actually delivers. That gap is the premium option sellers collect for taking crash risk, and it is why a VIX of 17 does not mean you will see a 1.1% move every day. Plenty of days are quieter. A few are much louder.
What counts as a high or low VIX?
The long-run average sits a little under 20. Saxo puts it around 19.5, and Eco3min’s work on the Cboe data describes the index as mean-reverting around 19 to 20. On the desk we think in rough bands rather than precise thresholds:
- Below 15: calm, often a slow grind higher, with cheap protection.
- 15 to 20: normal. Tuesday’s 17.52 sits here.
- 20 to 30: nervous. Daily ranges above 1.25% become routine.
- Above 30: stress. Markets are pricing daily moves near 2% or more.
The band matters less than the direction and speed of travel. A VIX rising from 13 to 19 in three days tells you more than a VIX sitting at 22 for a month.
VIX term structure: contango vs backwardation
The single most useful upgrade to reading the VIX is to stop looking at one number. Cboe publishes a whole family of volatility indexes on the same S&P 500 options at different horizons: VIX9D (9 days), VIX (30 days), VIX3M (3 months), VIX6M (6 months) and VIX1Y (1 year), all on its term structure page, plus the VIX1D for the current session.

Contango is the normal state. Shorter-dated volatility trades below longer-dated volatility, so VIX9D sits under the VIX, which sits under VIX3M. The logic is simple: more can go wrong over six months than over nine days, so longer protection costs more per unit of time when nothing is happening. Eco3min’s analysis of Cboe data finds the futures curve in contango on the large majority of trading days.
Backwardation is the stress state. When something breaks, near-term protection becomes the scarce thing, and the curve inverts. The VIX trades above VIX3M, and VIX9D jumps above both. That inversion showed up in the 2008 crisis, the February 2018 volatility shock, the 2020 Covid crash, the August 2024 unwind and the April 2025 tariff selloff, per the same Eco3min study.
How to read the term structure
The ratio of the VIX to VIX3M is the cleanest single check. Below 1.0, the curve is in contango and the market sees today as no scarier than the months ahead. Near or above 1.0, near-term fear has caught up with or passed longer-term fear.
When I read it, I care about three things:
- Is the front end rising faster than the back? If VIX9D jumps while VIX3M barely moves, the market is pricing a specific event, not a regime change. Fed days, CPI mornings and big earnings weeks often look like this.
- Did the curve invert? A full inversion is rare and usually coincides with forced selling. It tends to be a feature of the worst part of a drawdown rather than the start of one.
- How fast does it normalize? After a shock, the speed at which the curve returns to contango is a decent read on whether the stress was a liquidity event or something more lasting.
The biggest VIX spikes in history
The table below lists the readings that define the VIX’s range. Each figure is confirmed by at least two independent sources, and intraday highs and closing highs are marked separately because they often differ by a wide margin.
| Episode | Date | VIX reading | What drove it |
|---|---|---|---|
| Financial crisis | Oct 24, 2008 | 89.53 intraday, the all-time high | Global bank failures and credit freeze |
| Financial crisis | Nov 20, 2008 | 80.86 close, a record until 2020 | Continued crisis selling |
| Volmageddon | Feb 5, 2018 | 37.32 close, up about 116% in one day | Short-volatility products unwinding |
| Covid crash | Mar 16, 2020 | 82.69 close, the record close | Pandemic shutdowns |
| Yen carry unwind | Aug 5, 2024 | 65.73 intraday, 38.57 close | Crowded carry and short-vol trades unwinding |
| Tariff shock | Apr 4 and 7, 2025 | 45.31 close (Apr 4), 60.13 intraday (Apr 7) | Broad U.S. tariff announcements |
Sources: the 2008 figures from Macroption, Bloomberg and VIX and More; 2018 from CNN and Macroption; 2020 from CNBC, Bloomberg and Macroption; August 2024 from Reuters and Macroption; April 2025 from Bloomberg, Investing.com and Macroption.
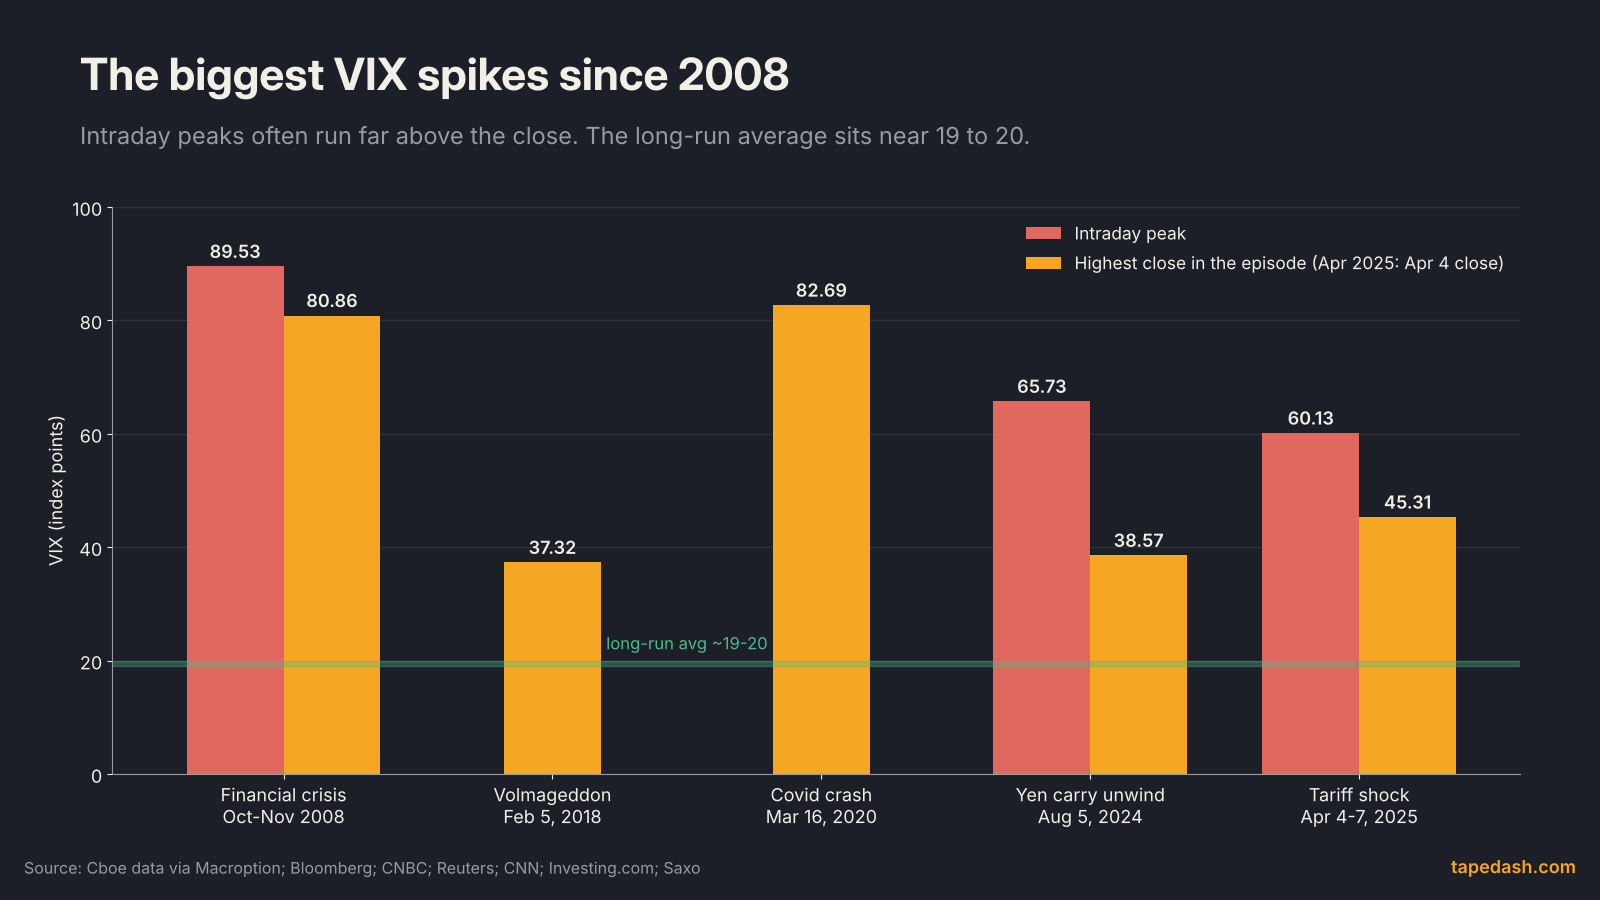
A few lessons come out of that table.
The intraday number can mislead. On August 5, 2024, Reuters reported the VIX hit 65.73 before the cash market even opened, the largest intraday jump in its history, then closed at 38.57. Thin pre-market quotes on far-out puts can distort a calculation that leans on those prices. If you want the background on that week, our yen carry trade explainer covers what was unwinding.
Speed matters as much as level. February 2018 never got near the 2008 or 2020 highs, but the VIX more than doubled in a single session, its largest one-day percentage rise on record per CNN. That speed is what broke products that were short volatility.
Spikes fade. Every episode in the table eventually returned toward the high teens or low 20s. That is not a guarantee about the next one, but it is why selling volatility after a spike is a popular trade, and why it occasionally ends very badly when a spike keeps going.
Why you can’t buy the VIX directly
This is where a lot of newer traders get hurt. The VIX is a calculation, not an asset. There is nothing to buy. What you can trade are derivatives on it: VIX futures, which launched in 2004, and VIX options, which followed in 2006, per Cboe and MarketsWiki.
VIX futures are not the VIX. Each contract is the market’s guess at where the VIX will settle on a specific future date. In contango, those futures trade above spot, because the market expects today’s calm to be followed by a more normal level of volatility later.
Exchange-traded products that offer “VIX exposure” hold those futures. A long-VIX note such as VXX holds a blend of the first- and second-month futures and shifts a slice of the position from the front contract to the next one every day, to keep about 30 days of maturity, as Vance Harwood explains and Schaeffer’s also describes.
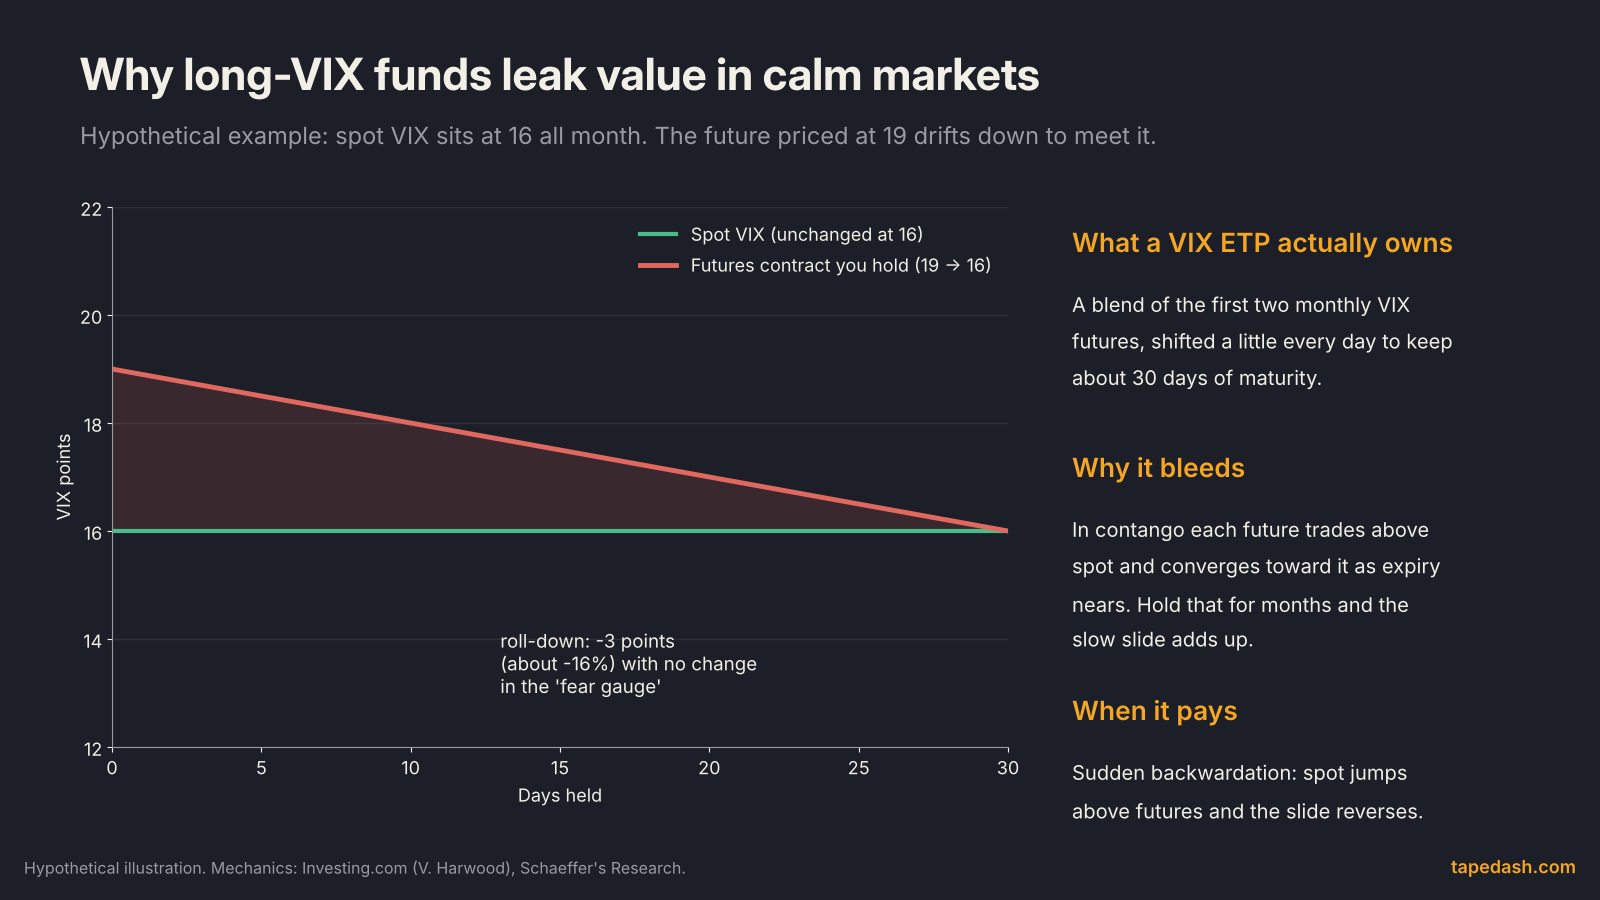
Why VIX funds decay
The common explanation is that rolling itself costs money. Harwood and Schaeffer’s both make a sharper point: the loss comes from the futures sliding down toward spot as they approach expiration. In the hypothetical above, spot VIX sits at 16 all month. The future you bought at 19 converges to 16 by expiration, a loss of about 16% with no change at all in the fear gauge. Repeat that month after month and a long-VIX fund bleeds even if the VIX ends the year where it started.
The reverse is also true. When the curve flips into backwardation, futures trade below spot, and long-VIX products can gain more than the index itself in a sharp spike. The flip side hit inverse products in February 2018, when the surge in volatility wiped out short-VIX notes that had been collecting that roll-down for years, a collapse Eco3min documents.
The practical takeaway: a long-VIX product is a short-term hedge or a trade, not something to buy and hold. If you own one, know what the curve looks like and how long you plan to stay.
How traders use the VIX
Here is how the VIX fits into the morning routine, as a process rather than a signal.
Use it as a ruler. Divide by 16 and you know what a normal day looks like. If the S&P 500 is down 0.8% with the VIX at 17, that is inside the expected range and not news. If it is down 2.5%, that is more than a two-standard-deviation day, and something real is happening.
Size positions to it. Higher VIX means wider daily ranges, which means the same number of shares or contracts carries more risk. Cutting size when the VIX doubles is the simplest risk rule there is.
Read it against price. The usual relationship is stocks down, VIX up. When stocks fall and the VIX barely moves, the selling is orderly and hedges were already in place. When stocks rise and the VIX rises too, someone is paying up for protection into strength, which is worth noticing.
Check the curve, not just the level. A VIX of 22 in contango is a nervous market. A VIX of 22 with VIX9D above it is a market bracing for something specific in the next week or two.
Price options with it. When the VIX is low, buying index options is cheap relative to history, and selling them pays little. When it is high, the opposite holds. That is the bridge between the VIX and individual-stock implied volatility, which our implied volatility guide covers in detail.
What to watch next for the VIX
The calendar ahead is full of events that tend to move the front end of the volatility curve. Each of these dates is confirmed by two independent sources:
- Friday, November 6, 8:30 AM ET: October jobs report (BLS, Finance Calendar).
- Tuesday, November 10, 8:30 AM ET: October CPI (BLS, Finance Calendar).
- Wednesday, November 18: monthly VIX futures and options expiration (Macroption, SpotGamma). Expirations can create odd moves in VIX derivatives that have nothing to do with fear.
- December 8 to 9: the final FOMC meeting of 2026, with the decision on December 9 (Federal Reserve, FedRateCalc).
- Wednesday, December 16: the December VIX expiration (Macroption, SpotGamma).
If the pattern holds, watch whether VIX9D lifts above the VIX in the sessions before each data release, then how quickly it falls back after. A short-dated bump that fades after the print is event pricing. A bump that sticks, with VIX3M following, is the market repricing risk for longer.
How TapeDash tracks the VIX and the volatility regime
If you want to watch whether the VIX curve is calm, bracing for an event, or inverting, this is what we track. The Macro & Regime page builds a risk-on and risk-off regime score from eight components, two of which are the VIX itself and the VIX term structure, and it shows the VIX next to the 3-month VIX so you can see the curve’s slope at a glance. That page answers the top-down question first: is this a market where dips get bought, or one where hedges get paid?
The Volatility Desk goes one level down, to the options themselves. It shows implied volatility term structure compared with a week and a month ago, the volatility surface and skew, and a realized-volatility cone, so you can see whether options on the S&P 500 or a single stock are rich or cheap relative to how much it is actually moving.
You can open both in the Terminal Preview without an account: Macro & Regime and the Volatility Desk. If you prefer the read after the close, the free TapeDash Daily covers what moved and why each evening, and the first 200 members lock Pro at $99 a month for as long as they stay.
VIX FAQ
Is a high VIX a signal to buy stocks?
Not by itself. Some of the best long-term entry points came with a very high VIX, but so did some of the worst drawdowns, because the VIX can stay high for weeks. A high VIX tells you options are expensive and daily ranges are wide. Whether to buy depends on your time horizon, your sizing and what is causing the fear.
Why does the VIX usually rise when stocks fall?
Because demand for protection is lopsided. Investors hedge long stock portfolios by buying S&P 500 puts, and they buy more of them after the market drops. That demand pushes put prices and implied volatility higher. Rallies rarely create the same scramble, so the VIX tends to drift lower as stocks climb.
Can I invest in the VIX for the long term?
There is no way to hold the VIX itself. Products that track VIX futures tend to lose value over time when the futures curve is in contango, which is most of the time. They can work as short-term hedges, but they are a poor fit for buy-and-hold.
The one idea to keep
The VIX is the price of S&P 500 insurance over the next 30 days, and nothing more. Divide it by 16 to see what a normal day looks like, compare it to the rest of the curve to see whether fear is about this week or this year, and never confuse the index with the products that try to track it. At 17.52 going into today’s Fed decision, the market was paying for an ordinary day. The useful question is never just what the VIX is. It is how fast it is moving, and in which part of the curve.
See it on the tape, not just in the headlines
TapeDash is the research desk for traders and investors: live options flow, dealer positioning, a real-time market scanner and trade alerts graded in public. Memberships open January 1, 2027, and the first 200 members lock Pro at $99 a month for as long as they stay.
Join the waitlistClick through the terminalSee the track recordSources
- Cboe: Volatility Index Methodology, Cboe Volatility Index
- Cboe: VIX Term Structure Data and Charts
- Cboe: Cboe Global Markets Launches 1-Day Volatility Index (April 24, 2023)
- Reuters via Kitco: Cboe launches 1-day cousin of Wall Street's fear gauge
- Macroption: VIX Calculation Step by Step
- Macroption: VIX All-Time Highs and Biggest Spikes
- Charles Schwab: Options Volatility: The VIX, Rule of 16, and Skew
- Option Alpha: Implied Volatility
- Yahoo Finance (Zacks): Stock Market News for Oct 28, 2026
- ad-hoc-news: VIX heads into Wednesday after 4.7 percent drop ahead of Fed
- Bloomberg (via BQ Prime): Stock Market Volatility Tops Financial Crisis With VIX at Record
- CNBC: Wall Street's fear gauge hits highest level ever (March 16, 2020)
- VIX and More: Two new VIX records (October 24, 2008)
- CNN Money: Market fear is back in a big way (February 5, 2018)
- Reuters via Investing.com: Wall Street fear gauge logs record jump (August 5, 2024)
- Fortune: Wall Street's fear gauge spikes to highest level since 2020 (August 5, 2024)
- Bloomberg: VIX Closes at Highest Since 2020 as Stock Slide Accelerates (April 4, 2025)
- Investing.com: Tariffs, turmoil, and the VIX: how April 2025 compares to past crises
- Saxo: Volatility for investors explained
- Eco3min: VIX backwardation, contango and the volatility futures term structure
- MarketsWiki: Cboe VIX
- Investing.com (Vance Harwood): How does VXX's daily roll work?
- Schaeffer's Research: How time decay affects the value of VXX
- Macroption: VIX Expiration Calendar 2026
- SpotGamma: Options and VIX expiration dates
- BLS: 2026 release schedule
- Finance Calendar: US Employment Situation, November 2026
- Finance Calendar: US CPI Report, November 2026
- Federal Reserve: December 2026 calendar
- FedRateCalc: FOMC meeting schedule, December 2026
This article is for educational and informational purposes only. It is not financial, investment, medical or legal advice, and it is not a recommendation to buy or sell any security. Figures come from the sources listed and were checked on the date of publication; markets change quickly. Options trading involves substantial risk of loss.