Oil Price Forecast: Why the EIA Still Sees $100 Brent as Prices Slide
The EIA's November outlook sees Brent near $100 for the rest of 2026 even as oil slid below $90. Why the forecast and the market split, and what to watch.
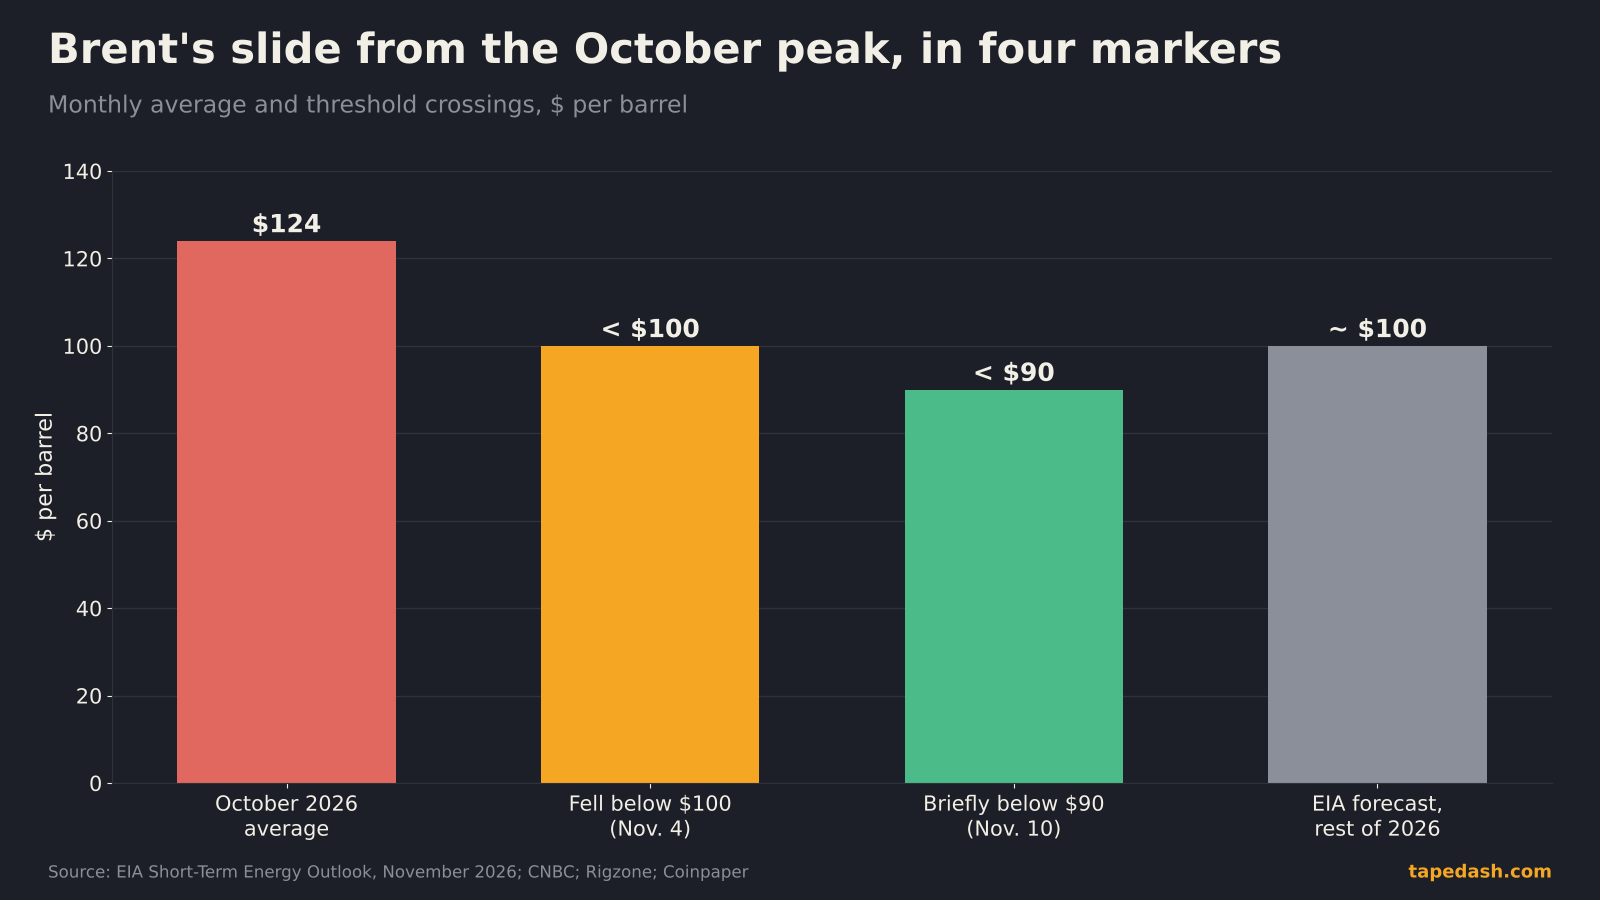
The government’s newest oil price forecast landed on Tuesday with an awkward bit of timing. The Energy Information Administration’s November Short-Term Energy Outlook says Brent crude should stay near $100 a barrel for the rest of 2026 (EIA, Rigzone). The same day, Brent briefly slipped below $90 for the first time since August on hopes for progress with Iran (CNBC, Coinpaper). It has traded in the low-to-mid $90s since.
So who is right? The short answer: they are answering different questions. The EIA forecast is a supply-and-inventory model that locked its inputs on November 5, before this week’s selloff. The futures market is a live vote on headlines. The EIA still thinks the physical market is tight enough to hold prices up through the winter, and it also thinks prices fall hard in 2027 as Middle East barrels come back. The market has simply started pricing the second half of that story sooner.
That gap matters for more than oil traders. It feeds into gasoline and diesel prices, airline and trucking costs, inflation expectations and the Fed. Here is how the forecast is built, where it can be wrong, and how I would use it.
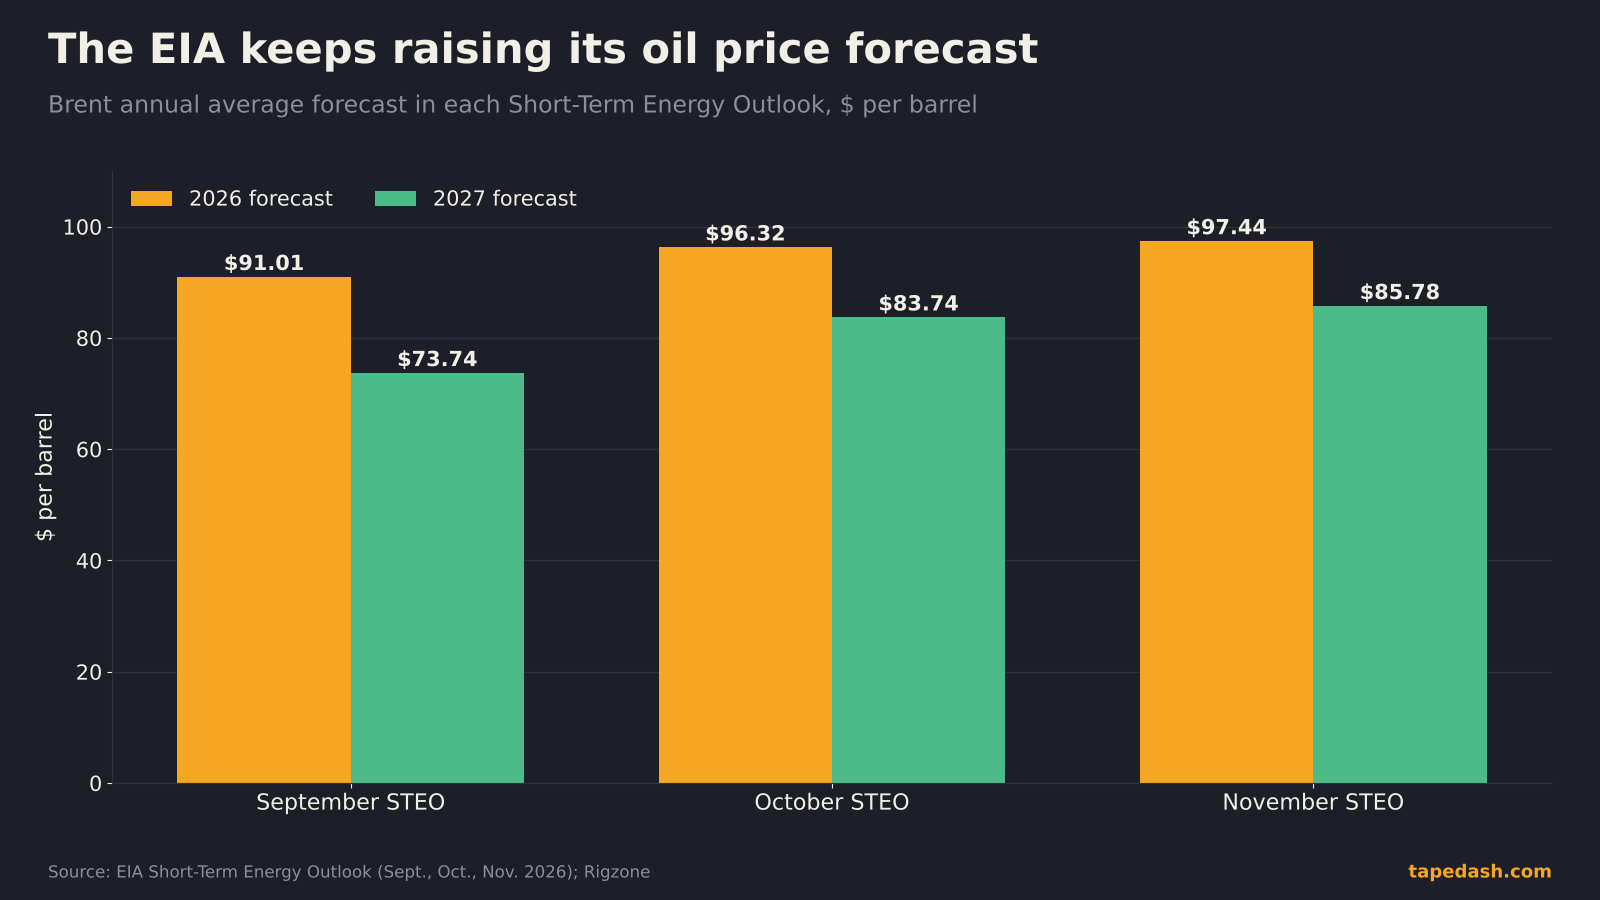
- The EIA’s November outlook raised its Brent forecast again, to $97.44 a barrel for 2026 and $85.78 for 2027, and sees Brent near $100 for the rest of this year.
- Brent briefly fell below $90 on November 10, after averaging $124 in October. The EIA locked its assumptions on November 5, before most of that drop.
- The forecast rests on two numbers: Middle East shut-ins (down from 10.9 million barrels a day in May to 2.5 million in October) and global inventories (a 1.2 million b/d draw in Q3, then builds of 3.5 million b/d in the first half of 2027).
- Diesel is the pressure point for consumers. The EIA now sees diesel averaging $5.03 a gallon in 2027, up from a prior forecast of $4.49.
- Next tests: the OPEC+ meeting on November 29, the weekly EIA inventory reports, and the Fed’s December 9 decision.
What the EIA’s November oil price forecast actually says
The headline is another upward revision. In its November Short-Term Energy Outlook, the EIA put average Brent at $97.44 a barrel for 2026 and $85.78 for 2027 (EIA, Rigzone). A month earlier those numbers were $96.32 and $83.74. In September they were $91.01 and $73.74. Back in July, the agency had 2027 Brent at about $65 (Rigzone, Petroleum News).
That last comparison is the one worth sitting with. In four months the official view of next year’s oil price went up by roughly a third. Nothing about the long-run cost of pumping oil changed in that time. What changed was the agency’s estimate of how long the Middle East disruption would last and how deep a hole it would dig in global inventories.
The quarterly Brent crude forecast
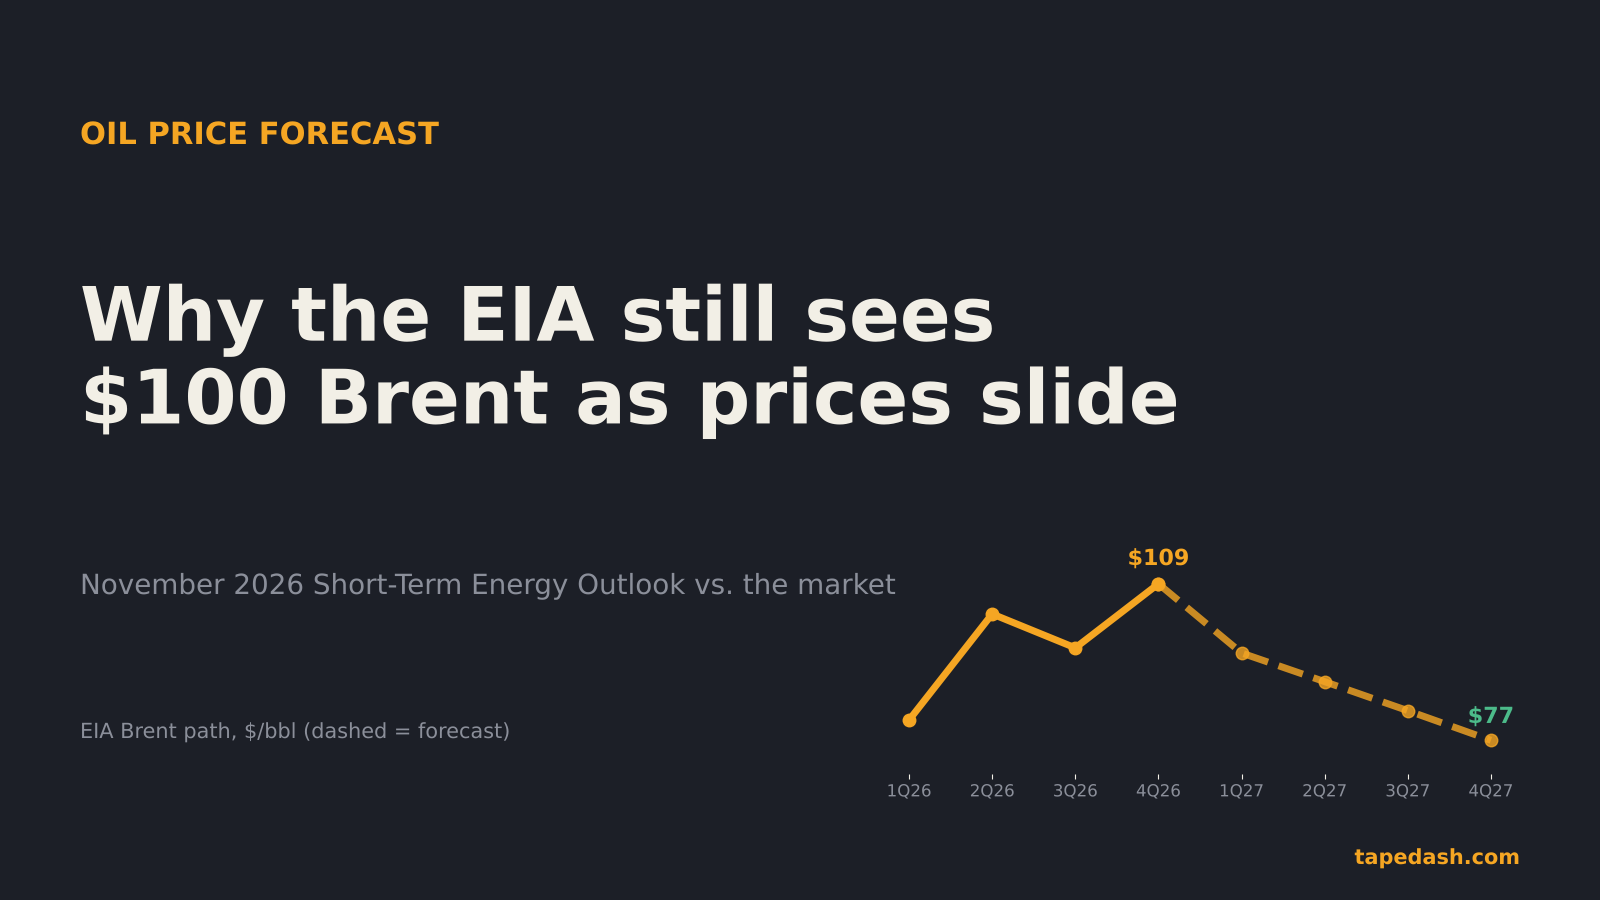
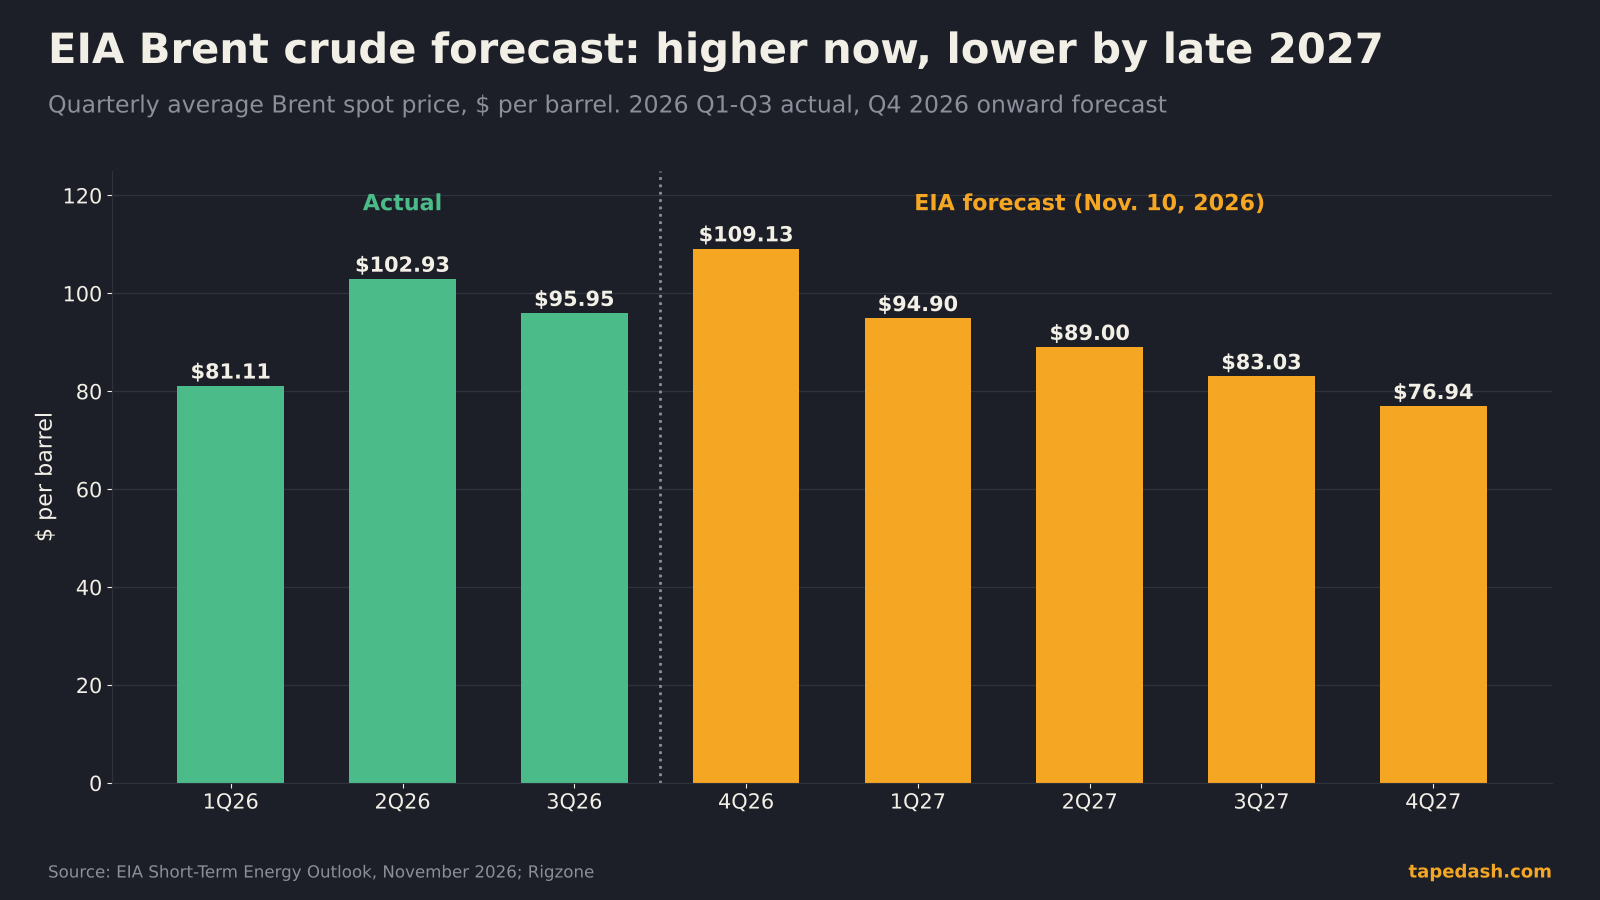
The annual averages hide the shape, and the shape is the useful part. The EIA’s quarterly path has Brent averaging $109.13 in the fourth quarter of 2026, then stepping down to $94.90, $89.00, $83.03 and $76.94 through the four quarters of 2027 (EIA, Rigzone). For context, the first three quarters of 2026 averaged $81.11, $102.93 and $95.95.
That fourth-quarter figure looks high against today’s market, and there is a simple reason. October averaged $124 a barrel, the highest monthly average since July 2022 (EIA, BigGo Finance). A quarterly average that already contains a $124 month will print high even if November and December come in near $100.
Why oil prices fell below $90 while the forecast stayed near $100
The timing problem is real. The EIA finalized the inputs for its November model on November 5 (EIA, Coinpaper). Brent had already dropped below $100 on November 4 (EIA, BigGo Finance), but the leg toward $90 came after the cutoff, driven by expectations that Washington might ease pressure on Tehran and that exports could normalize sooner (Coinpaper, CNBC).
Then Thursday showed how fast that narrative can flip. Comments from Washington that a deal with Iran was not needed pushed Brent higher, because traders read it as extra supply arriving later rather than sooner (Finimize). Brent, which prices seaborne crude, rose. WTI, which is tied more to U.S. pipelines and storage, slipped. Same headline, different barrels.
When I look at a gap like this, I do not treat it as the EIA being wrong and the market being right, or the reverse. I treat it as two different clocks. A futures price can reprice a peace headline in seconds. A balance model has to see the barrels actually move before it changes the inventory math. If the talks produce real flows, the December outlook will come down. If they stall, the market will drift back toward the model.
How the EIA builds an oil price forecast
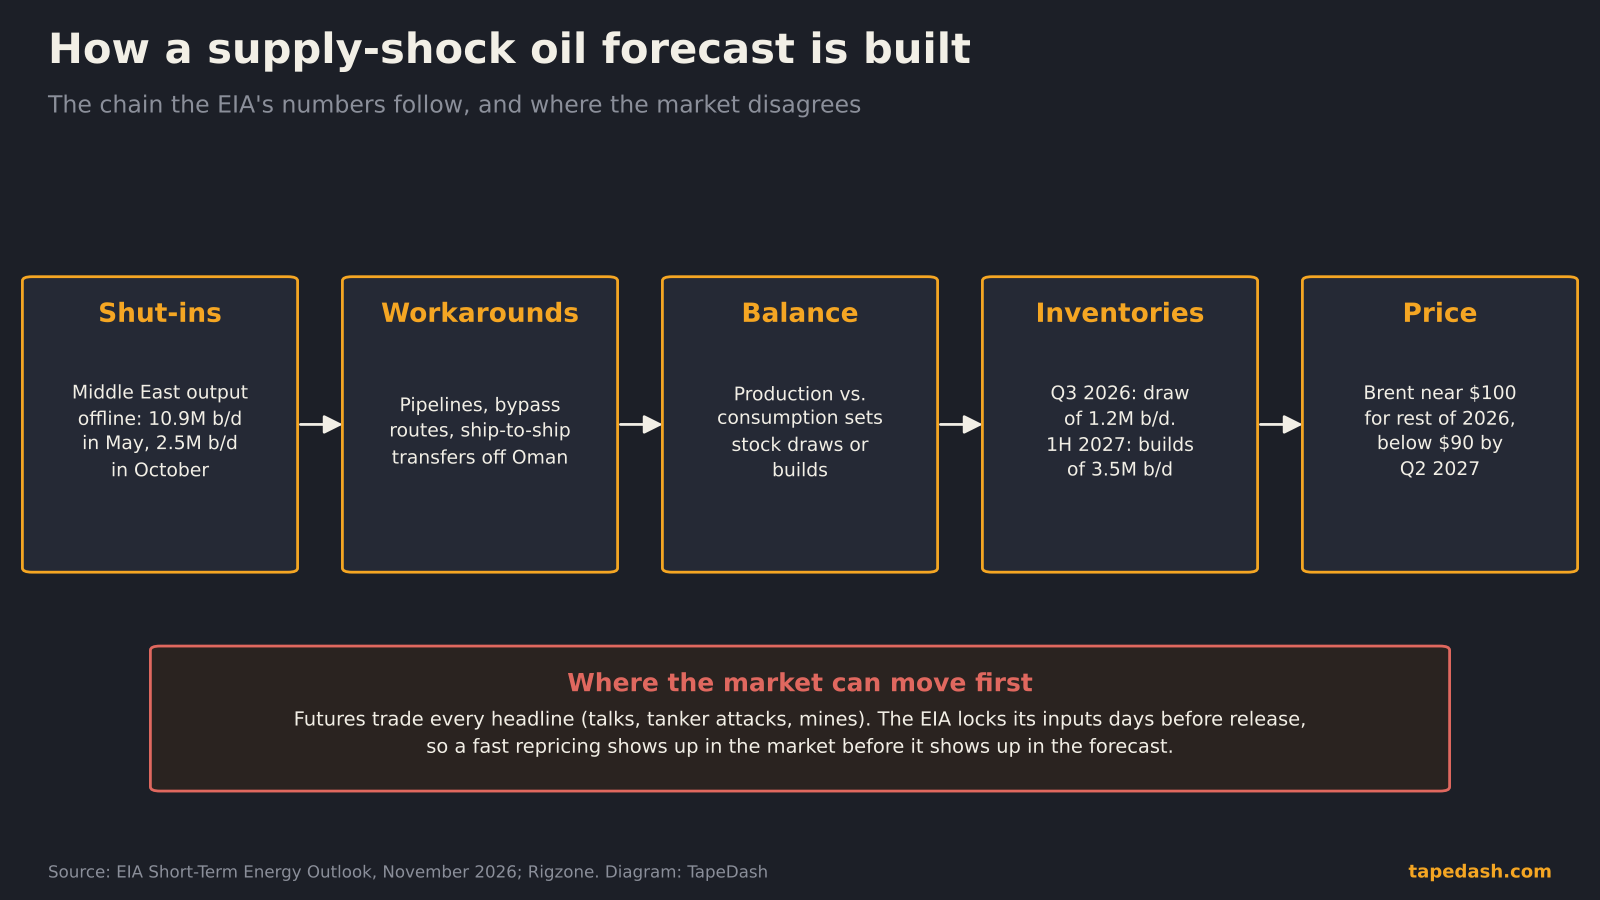
Most people see the price number and skip the plumbing. The plumbing is the forecast. The EIA works from a chain: how much production is offline, how much of it can get around the blockage, what that does to the global supply and demand balance, how that balance shows up in inventories, and finally what price inventories at that level have historically supported.
Step one: shut-ins
Middle East crude shut-ins peaked at 10.9 million barrels a day in May and averaged 2.5 million in October (EIA, Rigzone). The EIA expects that number to stay roughly flat through year-end, with most regional output outside Iran back to pre-conflict levels by the end of the second quarter of 2027. Iranian exports are assumed to stay constrained through the whole forecast.
Step two: workarounds
Barrels get out through pipelines, overland routes and ship-to-ship transfers along Oman’s coast, and the EIA assumes those workarounds slowly chip away at the shut-ins. It also warns, plainly, that flows remain exposed to disruption and that short-term price swings could be larger than the monthly path shows (EIA, Rigzone). Tanker attacks have continued, and rerouting adds cost to every barrel that takes the long way.
Step three: the balance and the inventories
This is the step that decides the price. The EIA estimates global inventories fell by 1.2 million barrels a day in the third quarter, start to rebuild in the fourth, and then build by 3.5 million barrels a day in the first half of 2027 (EIA, Rigzone). A build that size is large. It is the reason the agency has Brent below $90 by the second quarter of 2027.
In the U.S., the picture is tight right now. Commercial crude inventories ended October at 410 million barrels, the lowest end-of-October level since 2014 (EIA, BigGo Finance). Low stocks going into winter are the classic setup for price spikes on any cold snap or refinery outage, and the EIA flags both risks in its report.
Global oil supply and demand in 2027: the surplus that drives the forecast down
The cleanest way to see why the EIA turns bearish next year is to put production next to consumption. The agency estimates global liquids production at 106.3 million barrels a day in 2025, 101.7 million in 2026 and 108.4 million in 2027. Consumption goes 104.4 million, 102.4 million and 104.4 million (EIA, BigGo Finance).
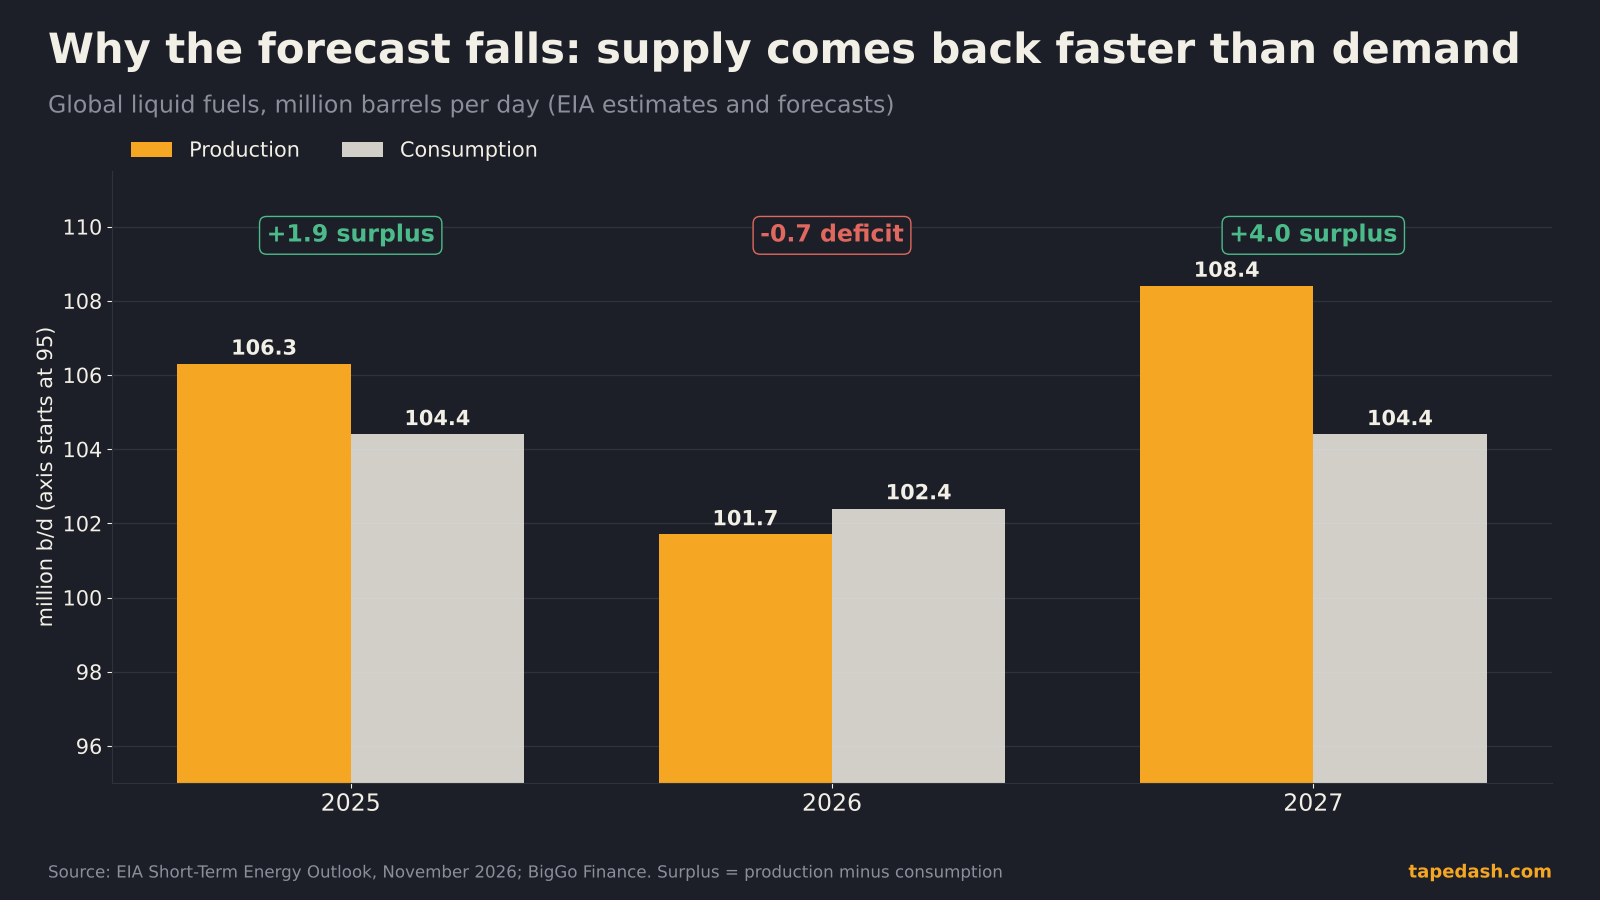
Subtract one from the other and you get the story. 2026 is a small deficit year. 2027 is a surplus of about 4 million barrels a day. Demand is not the driver here: consumption is expected to fall about 2.0 million barrels a day this year and recover by about the same amount next year. Supply is the driver. OPEC liquids output drops from 29.3 million barrels a day in 2025 to 24.5 million this year, then rebounds to 28.4 million in 2027 (EIA, BigGo Finance).
U.S. output adds to it. The EIA sees U.S. crude production rising from 13.7 million barrels a day in 2025 to 13.9 million this year and a record 14.3 million in 2027 (EIA, BigGo Finance). High prices did what high prices do. They pulled more barrels out of the ground, and those barrels arrive right as the Gulf comes back.
Gas and diesel price forecast: what it means at the pump
Retail fuel is where a crude forecast becomes a household number. The EIA sees regular gasoline averaging $3.89 a gallon in 2026 and $3.73 in 2027, after $3.10 in 2025. Diesel is the harder hit: $5.25 this year and $5.03 next year. The 2027 figures were raised from prior forecasts of $3.56 for gasoline and $4.49 for diesel (EIA, BigGo Finance).
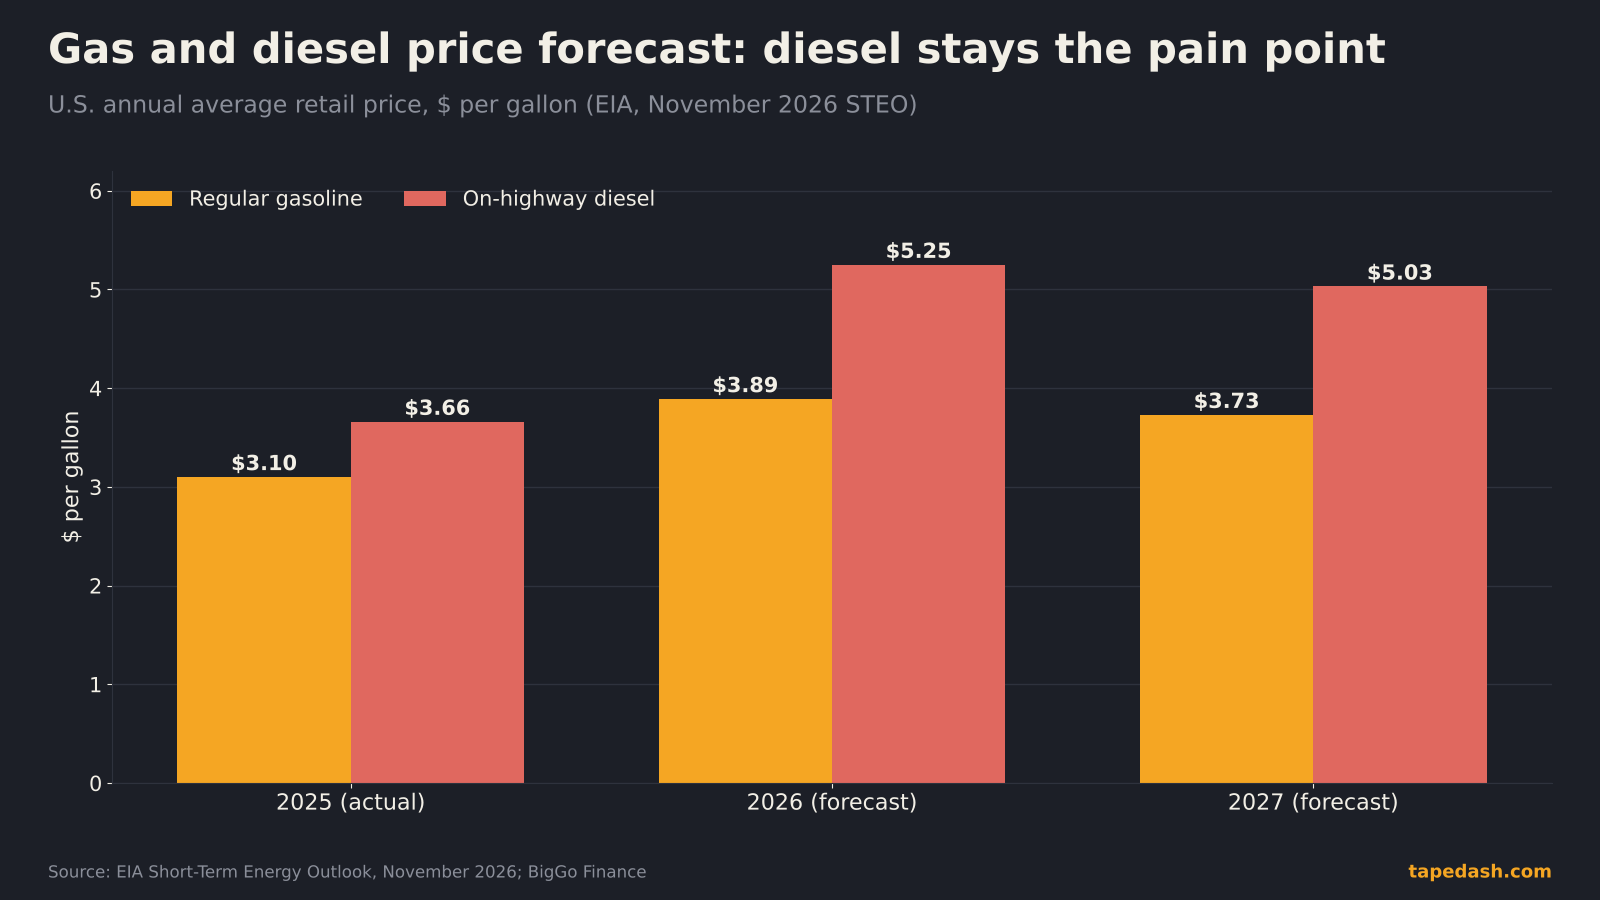
The diesel number deserves more attention than it gets. Diesel moves freight, runs farm equipment and heats homes in the Northeast. When diesel stays above $5, the cost shows up in goods prices with a lag, which is one reason energy keeps creeping into inflation reports long after the crude chart has peaked. We wrote about that channel from the British side when the Bank of England raised rates on energy inflation, and it is the same mechanism here.
Who wins and who loses from this forecast
If the EIA is right about the near term, the winners are the obvious ones: U.S. producers selling into near-$100 Brent with record output, and refiners with access to discounted domestic crude relative to seaborne barrels. The losers are diesel-heavy users such as truckers, airlines (jet fuel trades off the same middle of the barrel) and any business with thin margins and long supply chains.
If the 2027 surplus shows up early, that flips. Producers who hedged at high prices look smart, unhedged ones see cash flow drop, and fuel-sensitive stocks get relief. I would rather watch the inventory data than guess which camp gets paid first.
How to read an oil price forecast like a trader
A forecast is not a price target. It is a set of assumptions with a number at the end. Here is how I read one.
Check the cutoff date first. The EIA says when it finalized inputs. Anything after that date is not in the number. This month that single fact explains most of the gap between the forecast and the screen.
Read the revisions, not the level. Revision after revision since the summer tells you the agency keeps underestimating how long the disruption lasts. That is information about the direction of risk, even if the level is stale.
Find the load-bearing assumption. For this outlook it is the recovery of Middle East output outside Iran by mid-2027. If that slips by a quarter, the 2027 surplus shrinks and the whole staircase shifts up. If it arrives early, the market will front-run it, which is what this week looked like.
Compare the shape to the futures curve. When the market is in steep backwardation (near-month prices above later months), it is telling you the same thing the EIA’s staircase says: tight now, looser later. We walked through how to read that curve in the OPEC+ December output piece. If the curve flattens while the forecast still slopes down, the market is pricing the recovery sooner.
Use it as a scenario map. The table below is how I turn a forecast into trading questions rather than predictions.
| Scenario | What would have to happen | What the EIA path implies | What traders would watch |
|---|---|---|---|
| Forecast holds | Shut-ins stay near October levels through year-end, workarounds grind higher | Brent near $100 into December, then a slow decline in 2027 | Weekly U.S. inventories, tanker attack headlines, diesel cracks |
| Recovery comes early | Talks produce real export flows before spring | The 2027 surplus starts in Q1, prices fall faster than the staircase | Futures curve flattening, inventory builds, OPEC+ quota talk |
| Disruption deepens | New attacks or mine incidents in the shipping lanes | Shut-ins rise again, inventories keep drawing | Front-month spreads, volatility in oil options, airline and trucking stocks |
| Winter shock | A cold snap or refinery outage while stocks are low | Short spikes above the monthly path, especially in diesel | Heating oil futures, Northeast distillate stocks, refinery news |
For a refresher on the basic drivers behind each row, our explainer on what moves oil prices covers OPEC+, inventories and the weekly EIA report.
What to watch next for oil prices
Every Wednesday: the EIA Weekly Petroleum Status Report. This is the fastest read on whether the U.S. side of the inventory story is tightening or loosening. With commercial crude starting from the lowest end-of-October level since 2014, a run of builds would be the first real evidence for the 2027 surplus.
November 29: OPEC+ ministerial meeting. The broader group meets to set 2027 policy, after the core members held December targets steady on November 1 (OPEC, Reuters via Star-Advertiser). A production capacity review is expected to set 2027 baselines (World Oil). If OPEC+ signals it will add barrels into a surplus year, that leans toward the lower end of the EIA path.
Early December: the next Short-Term Energy Outlook. It will be the first EIA forecast with this month’s selloff in its inputs. Watch the fourth-quarter number and whether the mid-2027 recovery assumption moves.
December 9: the Fed decision. Energy is part of why inflation has stayed sticky, and the Fed meets on December 9 (Federal Reserve, FedRateCalc). Lower crude would help the inflation picture. Diesel above $5 would not. We covered how this fed into bond yields in 10-year Treasury yield hits 5% again.
Frequently asked questions
What is the EIA oil price forecast for 2027?
In its November 2026 Short-Term Energy Outlook, the EIA forecast Brent crude averaging $85.78 a barrel in 2027, falling below $90 in the second quarter and to about $77 in the fourth quarter as Middle East production recovers and inventories rebuild.
Why is the EIA forecast higher than current oil prices?
The EIA finalized its inputs on November 5, before Brent’s drop below $90 on November 10. It also models physical inventories, which it says remain tight, while futures react immediately to news about talks and shipping.
Will gas prices go down in 2027?
The EIA expects regular gasoline to average $3.73 a gallon in 2027, down from $3.89 in 2026, but higher than its prior forecast. Diesel stays above $5 a gallon on average in both years.
How to track the oil forecast on TapeDash
If you want to watch whether the market or the model wins this argument, this is what we track. The TapeDash Terminal Preview shows the energy complex next to rates and the dollar, so you can see whether an oil move is a supply story or a macro story. The Live Scanner flags unusual options activity in energy names and fuel-sensitive stocks like airlines, which is often where a shift in oil expectations shows up first.
We also send the free TapeDash Daily, which covers the weekly EIA report, OPEC+ decisions and the data that moves crude in plain language. If you decide to go further, the first 200 members lock Pro at $69.99 a month on their account, even if they cancel and come back later.
The one idea to keep
An oil price forecast is a snapshot of assumptions, and this one was taken just before the market changed its mind. The EIA is telling you oil is tight now and loose in 2027. The market agrees on the direction and is arguing only about timing. Watch the inventories, because whichever side they confirm first is the side that gets paid.
See it on the tape, not just in the headlines
TapeDash is the research desk for traders and investors: live options flow, dealer positioning, a real-time market scanner and trade alerts graded in public. Memberships open Black Friday, November 27, and the first 200 members lock Pro at $69.99 a month on their account, even if they cancel and come back later.
Join the waitlistClick through the terminalSee the track recordSources
- EIA: Short-Term Energy Outlook, November 2026 (released Nov. 10, 2026)
- EIA: Short-Term Energy Outlook overview and release schedule
- Rigzone: EIA Raises 2026, 2027 Oil Price Forecasts Yet Again (Nov. 12, 2026)
- Coinpaper: EIA Sees Oil Near $100 Through 2026 Despite Brent's November Crash
- BigGo Finance: EIA Raises Oil Price Forecast, Brent Expected to Hold Above $100 for Rest of Year
- CNBC: Brent crude briefly dips below $90 for first time since August on Iran hopes (Nov. 10, 2026)
- Finimize: Oil Prices Split After Trump Dismissed an Iran Deal (Nov. 12, 2026)
- Petroleum News: EIA forecasts $100 Brent in fourth quarter
- OPEC: Seven OPEC+ countries reaffirm commitment to market stability (Nov. 1, 2026)
- Reuters via Honolulu Star-Advertiser: OPEC+ keeps December oil output targets steady (Nov. 1, 2026)
- World Oil: OPEC+ subgroup keeps oil production quotas unchanged for December (Nov. 1, 2026)
- Federal Reserve: December 2026 calendar
- FedRateCalc: FOMC meeting schedule, December 2026
This article is for educational and informational purposes only. It is not financial, investment, medical or legal advice, and it is not a recommendation to buy or sell any security. Figures come from the sources listed and were checked on the date of publication; markets change quickly. Options trading involves substantial risk of loss.