What Moves Oil Prices: OPEC+, Inventories and the EIA Report
What moves oil prices, explained: OPEC+ quotas, spare capacity, demand, the weekly EIA inventory report, Brent vs WTI, the futures curve and the dollar.
Oil prices move on four things: physical supply, physical demand, the inventories that sit between the two, and money (the dollar, the shape of the futures curve and how much risk traders want to carry). Supply and demand set the direction. Inventories tell you, every Wednesday, which side is winning. Money decides how hard the price swings when the news hits.
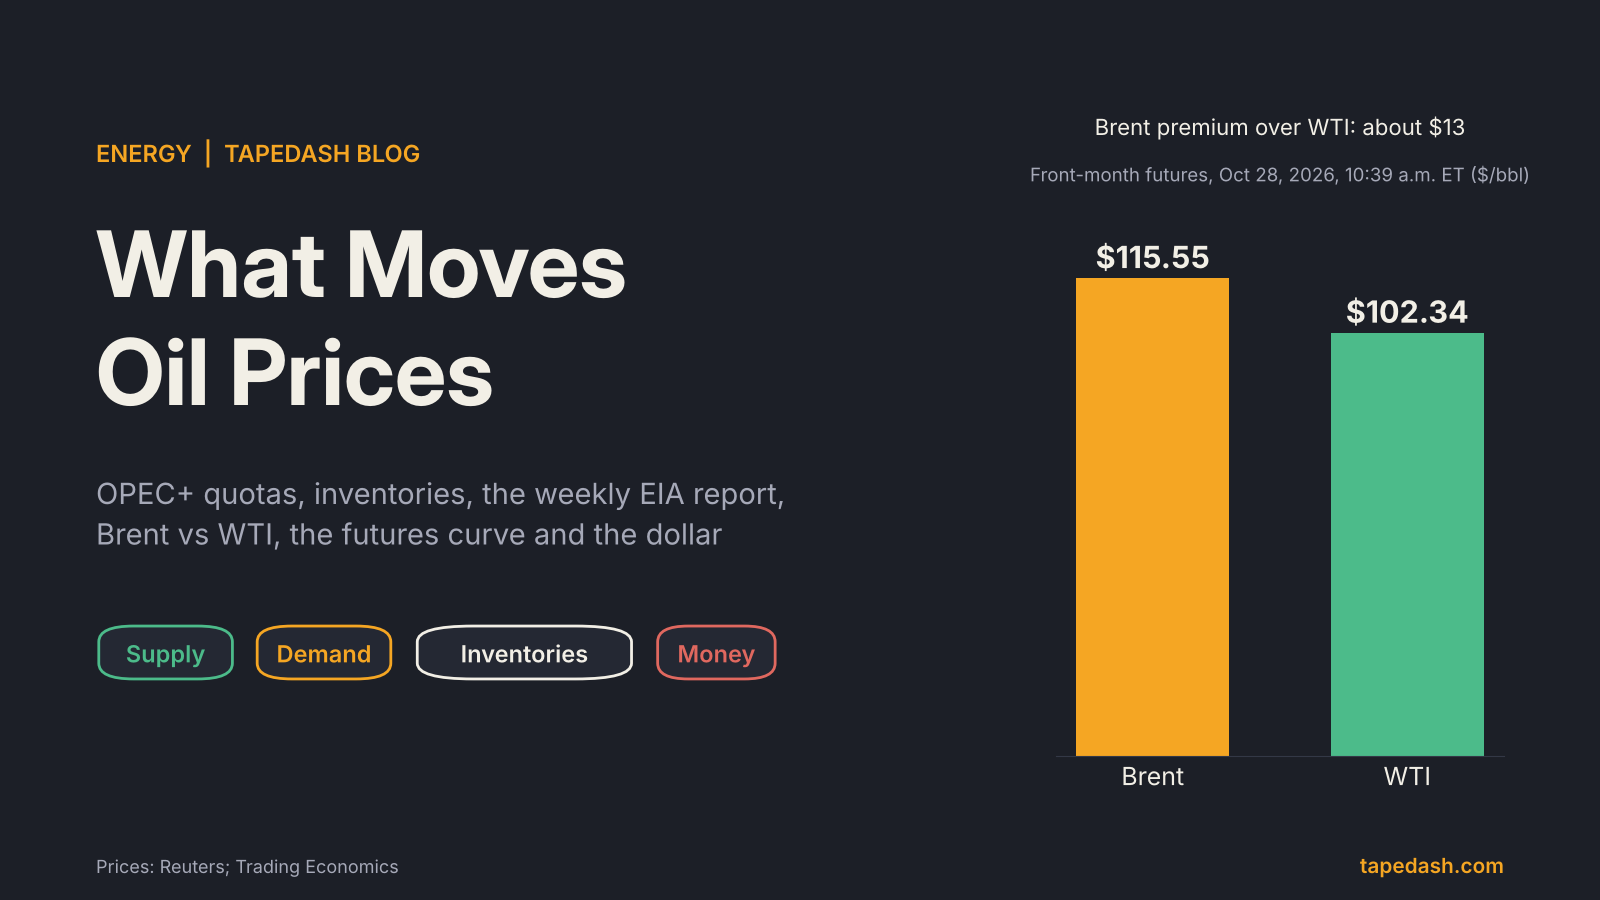
This week shows all four at once. Brent futures traded around $115 a barrel on Wednesday morning, with WTI around $102, according to Reuters and Trading Economics. The same morning, the Energy Information Administration reported a 1.9 million barrel drop in US crude stocks when analysts had expected a small build. And OPEC+ meets again on Sunday, November 1, with most of its core producers still pumping below their targets because of the war-related disruption to Gulf shipping.
This guide explains each force, shows you how to read the weekly EIA report line by line, and covers Brent vs WTI, contango and backwardation, and what to watch over the next few weeks.
- Four forces move oil prices: supply (OPEC+, spare capacity, US shale, outages), demand (China, driving season, diesel, jet fuel), inventories, and money (the dollar, the futures curve, positioning).
- The EIA Weekly Petroleum Status Report comes out Wednesdays at 10:30 a.m. ET. The surprise versus expectations matters more than the headline number. This week crude fell 1.9 million barrels against an expected build.
- OPEC+ quotas only matter if members can and will produce them. The core seven held November targets at 31.01 million barrels per day and meet again November 1.
- Brent and WTI usually trade a few dollars apart. This week the gap is about $13, a sign of stress in seaborne crude.
- A steeply backwardated curve means the market is paying up for barrels now. Watch the spreads, not just the front-month price.
Where oil prices stand this week
Some context before the mechanics, because 2026 has been an unusual year for crude.
The conflict involving Iran that began on February 28 led to the effective closure of the Strait of Hormuz, the EIA noted, and Gulf producers that depend on the strait had to shut in output. Gulf News dated the start of the war to late February as well. Saudi Arabia and the UAE rerouted part of their exports through pipelines to the Red Sea and the Gulf of Oman. On top of that, the UAE announced in late April that it would leave OPEC and OPEC+ effective May 1, according to the EIA and Enerdata, which took one of the group’s larger producers out of the quota system.
Fast forward to this week. Brent crossed roughly $117 to $118 last week before easing, according to Business Standard and MUFG Research, and bounced back above $115 on Wednesday. The swings this month have come from headlines about the Iran talks, attacks on Saudi energy infrastructure, and reports that renewed military action is under consideration if diplomacy fails. Physical stress has eased somewhat as Gulf flows recovered, but traders are still paying a large premium for barrels delivered soon.
That is the backdrop. Now the parts that apply in any year.
What moves oil prices: the four forces
The EIA’s own framework for what drives crude oil prices lists seven factors: spot prices, non-OPEC supply, OPEC supply, the supply and demand balance including inventories, financial markets, and demand in both developed and emerging economies. I find it easier to group them into four buckets, because that is how the information actually arrives on the desk.
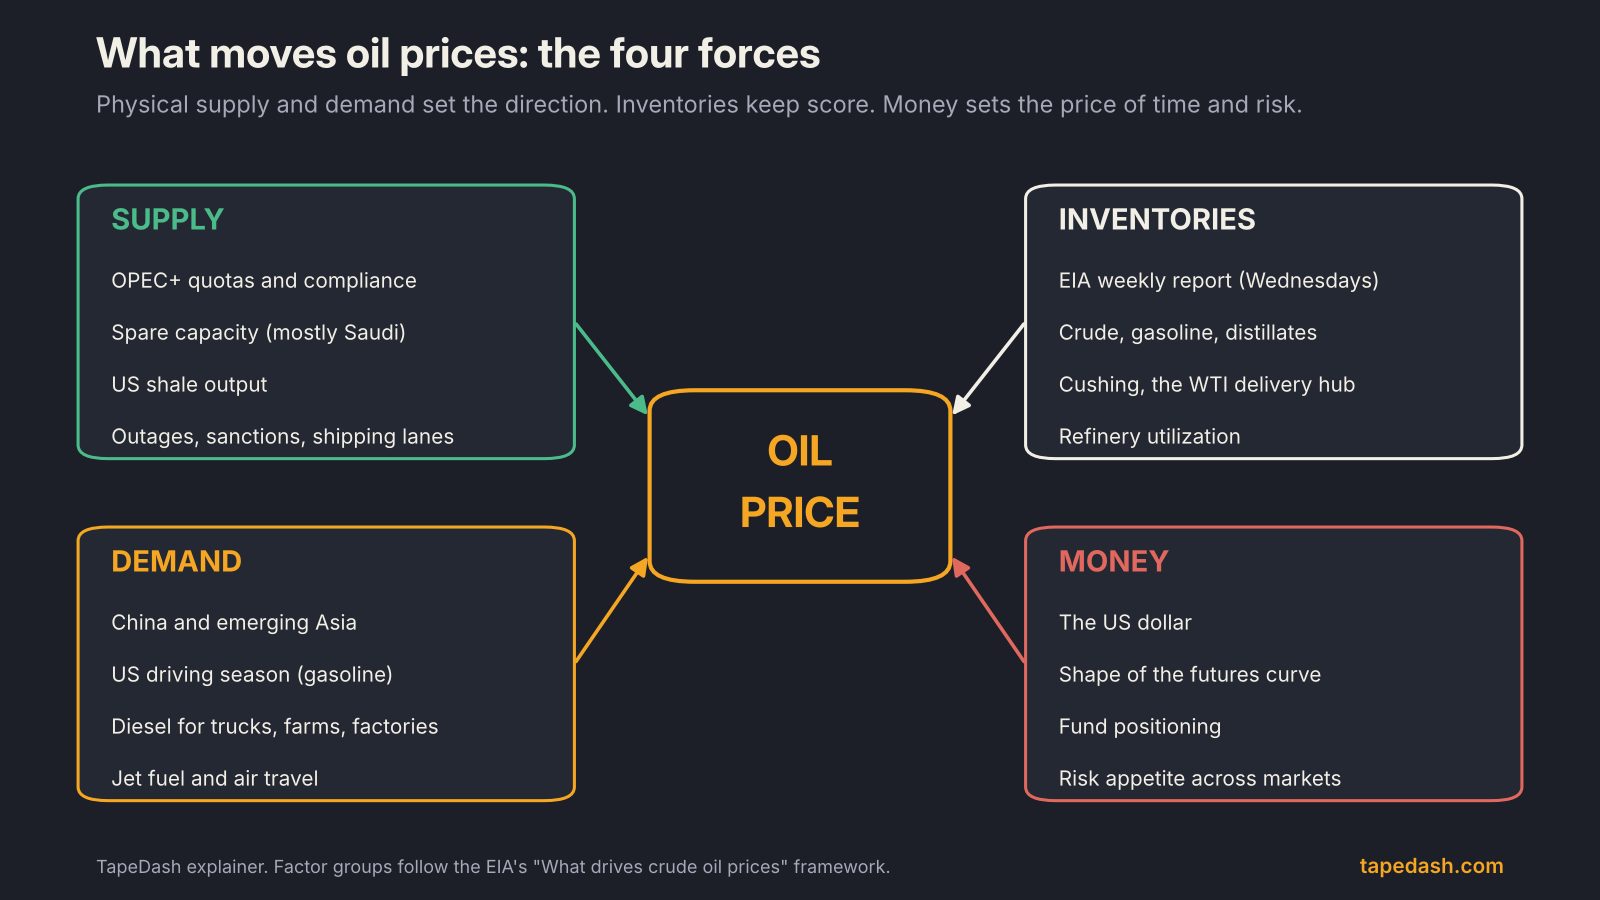
Supply news shows up as OPEC+ statements, outage headlines and production data. Demand shows up slowly, through monthly agency reports and the weekly “product supplied” lines. Inventories arrive every Wednesday. Money is always on: the dollar, the futures spreads and fund positioning move every minute the market is open.
Supply: OPEC+ quotas, spare capacity and US shale
How OPEC+ quotas work
OPEC+ sets production targets for its members, and the market reads every monthly meeting as a signal about how much oil is coming. Since the UAE’s exit, the decisions that matter come from seven core members: Saudi Arabia, Russia, Iraq, Kuwait, Kazakhstan, Algeria and Oman.
On October 4, those seven agreed to keep November production at September’s required levels, per the OPEC press release. The country targets add up to 31.01 million barrels per day, as published by Nairametrics, Interfax and Gulf News.
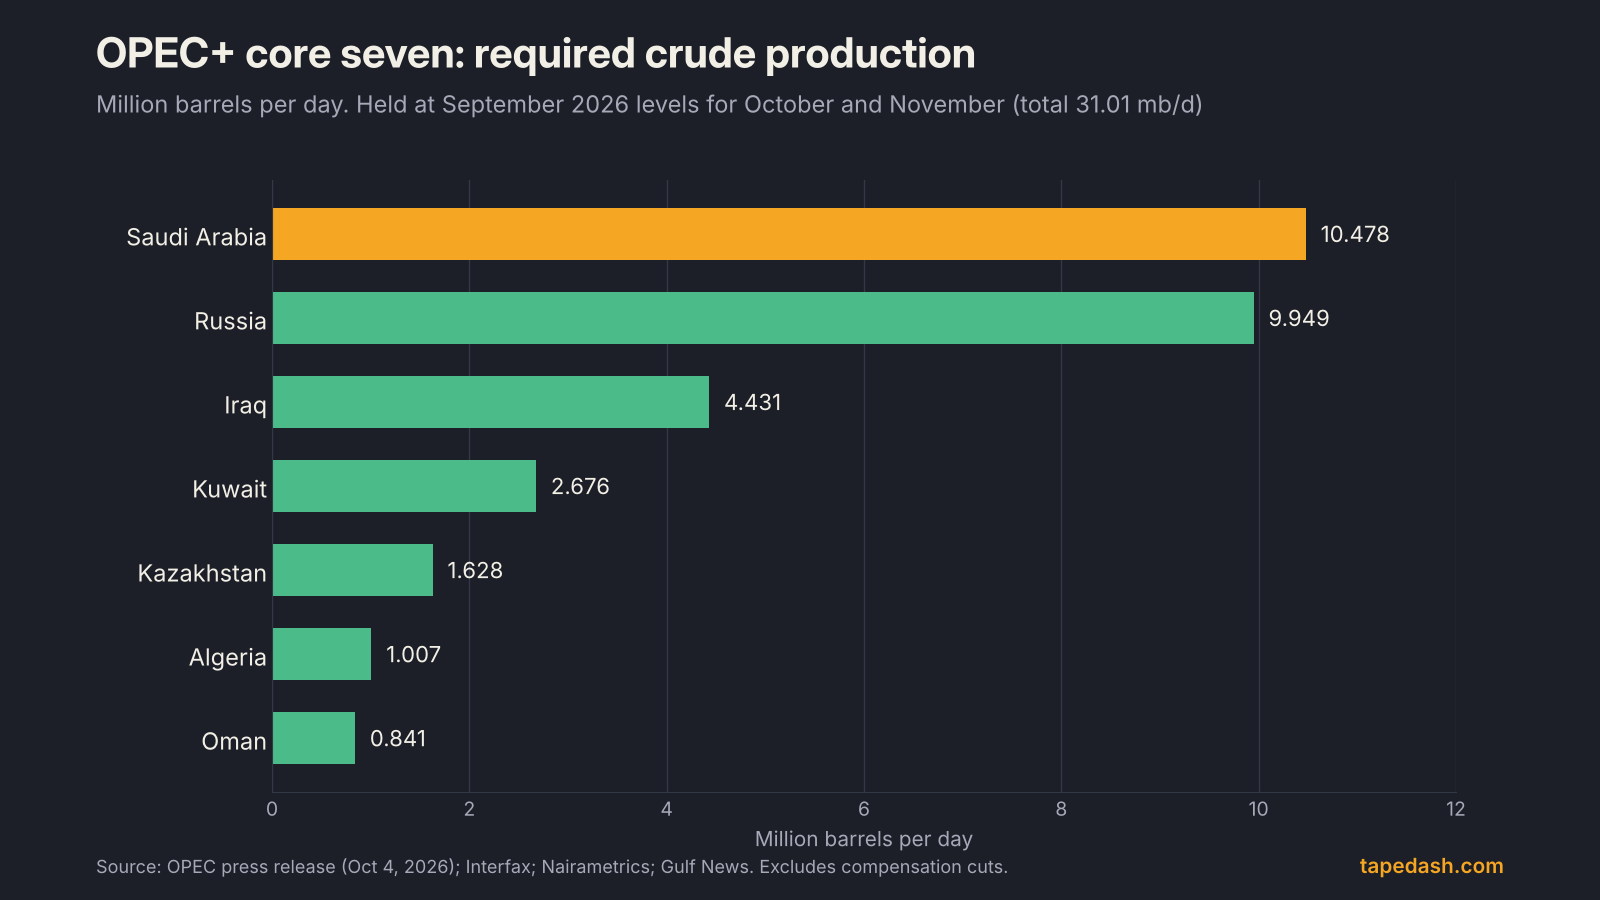
Here is the part most explainers skip. A quota is a ceiling, not a production number. Reuters reported this week that most OPEC+ members are still pumping well below their targets, according to Global Banking & Finance Review, and Gulf News cited a UBS analyst making the same point. When quotas are above what members can actually ship, a “hold steady” decision tells you very little about supply. What moves the price is whether barrels can physically reach the market.
Why spare capacity matters
Spare capacity is the production a country could bring online quickly but chooses not to. It is the oil market’s shock absorber. When a supplier goes offline, the first question traders ask is who can replace those barrels and how fast. For most of the last two decades, the answer has been Saudi Arabia, which holds a large share of OPEC+ spare capacity.
The problem in 2026 is that spare capacity in the Gulf is only useful if it can be exported. Barrels that cannot get through a shipping lane are not spare in any practical sense. That is why pipeline capacity that bypasses Hormuz has been as important to the price as quota decisions.
US shale: the swing producer with a lag
The United States is the world’s largest crude producer, and shale drillers respond to price. The response is slow, though. Higher prices lead to more rigs, which lead to more wells, which lead to more output months later. In the short run, US supply is close to fixed. Over a year or two, a high price tends to fix itself by pulling in more American barrels.
Demand: China, seasonal driving and jet fuel
Demand moves more slowly than supply, but it sets the long trend. The main pieces:
China and emerging Asia. China is the world’s largest crude importer, so its refinery runs, import quotas and stockpiling decisions shift the global balance. Weak Chinese data tends to pressure Brent more than WTI, because Brent is the price Asian buyers reference.
The US driving season. Gasoline demand in the US peaks between Memorial Day and Labor Day. Refiners build gasoline stocks in spring and draw them down in summer. A gasoline build in late October, like this week’s, is less alarming than one in June.
Diesel and jet fuel. Diesel moves trucks, farm equipment and factories, so it tracks the real economy closely. Jet fuel tracks air travel. Both are “middle distillates” and show up together in the EIA report.
This year demand has been falling, not rising. In its October Oil Market Report, the IEA forecast 2026 world demand at 102.4 million barrels per day, down 2.6 million from 2025, while supply falls 5.8 million barrels per day to 100.7 million, as summarized by Nine145 and Global Trading Outlook. Diesel accounts for about a quarter of the demand decline.
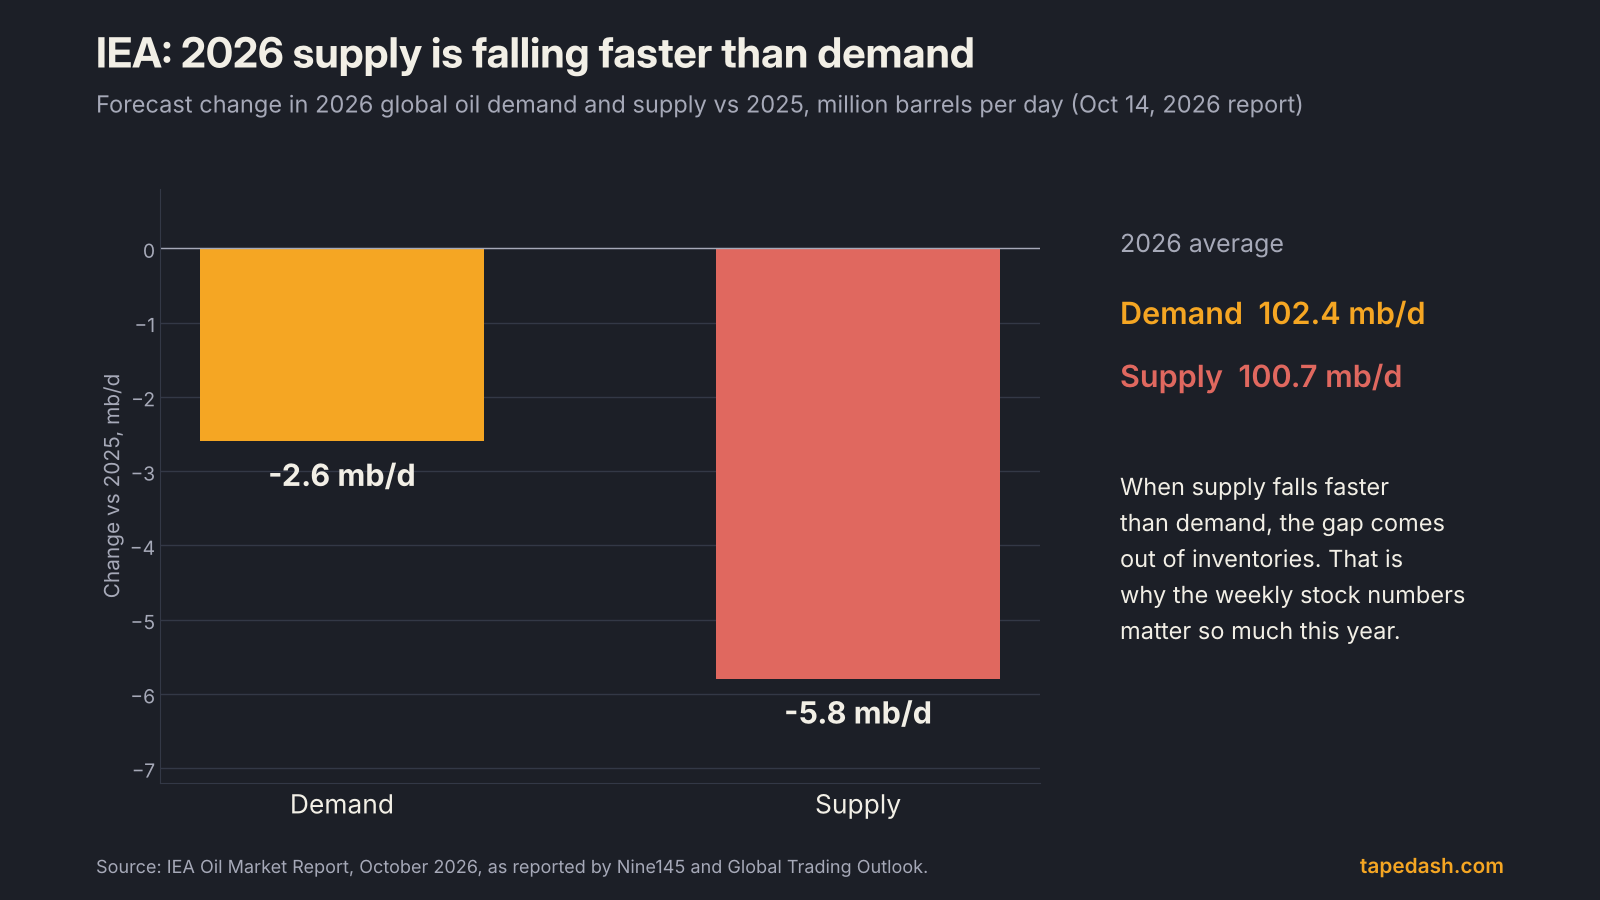
High prices destroy demand, eventually. People drive less, airlines trim schedules, factories switch fuels where they can. That is the slow brake on any oil spike, and it is already showing up in the agency forecasts.
Inventories: how to read the weekly EIA report
If supply and demand are the story, inventories are the scoreboard. When the world produces more than it uses, the extra goes into tanks. When it uses more than it produces, tanks drain. Traders watch inventories because they are the only weekly, hard-number check on a balance that is otherwise estimated.
When it comes out
The EIA’s Weekly Petroleum Status Report is released on Wednesdays at 10:30 a.m. ET, covering the week that ended the previous Friday. Holiday weeks shift it by a day. The American Petroleum Institute publishes its own survey on Tuesday afternoons at 4:30 p.m. ET, a day earlier (StoneX, ForexLive). StoneX notes that EIA surveys are mandatory while the API’s are voluntary, which is why most traders treat the API as a preview and the EIA as the number that counts.
What this week’s report showed
For the week ended October 23, the EIA said:
- Commercial crude stocks fell 1.9 million barrels to 410.6 million, against a Reuters poll expecting a 15,000 barrel build (Reuters, Oil & Gas Journal).
- Gasoline stocks rose 3.9 million barrels, against an expected draw of about 0.9 million.
- Distillate stocks fell 1.5 million barrels, a bigger drop than the 0.9 million expected.
- Cushing, Oklahoma, stocks fell 624,000 barrels (InvestingLive).
- Refinery utilization slipped 0.6 percentage points to 92.8%.
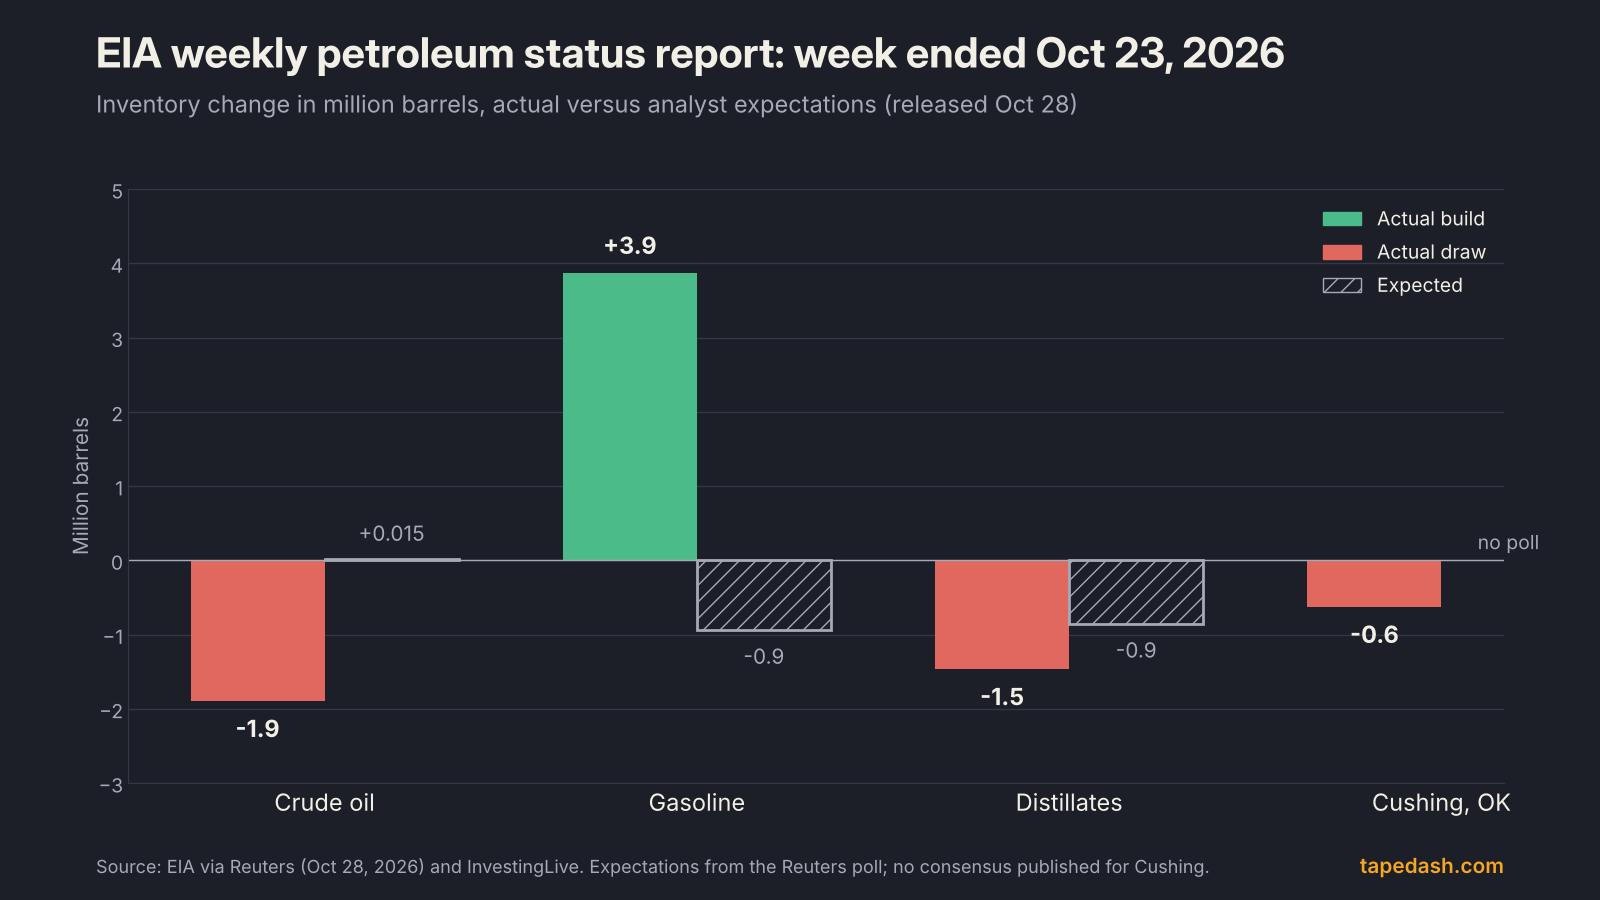
Futures held their gains after the release, with Brent near $115.55 and WTI near $102.34 shortly after 10:30 a.m., per Reuters.
How to read each line
Here is how I read the report, in the order I look at it.
| Line item | What it measures | Reads bullish for price when | Reads bearish when |
|---|---|---|---|
| Commercial crude stocks | Crude held in US tanks, excluding the strategic reserve | Draw bigger than expected | Build bigger than expected |
| Cushing, Oklahoma | Stocks at the WTI delivery hub | Falling toward low levels | Rising fast, especially near contract expiry |
| Gasoline stocks | Finished gasoline and blending components | Draw in driving season | Build when a draw was expected |
| Distillate stocks | Diesel and heating oil | Draw heading into winter | Build that signals weak trucking and industry |
| Refinery utilization | Share of refining capacity in use | High runs pull crude out of storage | Falling runs leave more crude in tanks |
| Product supplied | Proxy for US demand | Rising, above seasonal norms | Falling, below seasonal norms |
| Net imports and exports | Crude flows across the border | Exports surge, pulling barrels abroad | Imports surge, adding to stocks |
Three habits make the report more useful.
Compare to expectations, not to zero. A 1 million barrel draw is bearish if the market expected 4 million. The price reacts to the surprise.
Read crude and products together. A crude draw paired with a big product build can just mean refiners turned crude into gasoline that nobody is buying. That is not a bullish signal for the whole complex.
Watch Cushing separately. WTI futures are physically delivered at Cushing (tastytrade, CME Group), so its stock level can move the front-month WTI contract more than the national total. The extreme example is April 20, 2020, when the expiring May WTI contract settled below minus $37 a barrel because storage at Cushing was nearly full, as documented by the Congressional Research Service and Reuters. Sellers had to pay buyers to take delivery.
Brent vs WTI: why there are two oil prices
When someone says “oil,” they usually mean one of two benchmarks.
WTI (West Texas Intermediate) is US light sweet crude, traded on CME’s NYMEX. One contract covers 1,000 barrels and is physically delivered at Cushing (CME Group, tastytrade). It reflects inland US supply and demand.
Brent is North Sea crude, traded on ICE in London. Because it is waterborne and close to global shipping routes, it serves as the reference price for most of the world’s traded crude, including much of what flows to Asia and Europe.
The two usually trade a few dollars apart, with Brent on top. This week the gap is about $13 (Brent near $115.6, WTI near $102.3 per Reuters, and similar levels on Trading Economics). CMB News attributed the widening earlier this month to Atlantic Basin shipping constraints and US export bottlenecks that keep cheaper American crude from fully reaching tight overseas markets.
A wide Brent-WTI spread tells you the stress is in the seaborne market, not in US tanks. It also matters for stocks. US refiners that buy WTI-linked crude and sell products priced off global markets tend to benefit when the spread widens, while companies selling into WTI pricing see less of the rally.
The futures curve: contango and backwardation
The oil price you see quoted is the front-month futures contract. But there is a contract for every month for years out, and the shape of that curve says more about the physical market than the headline price.
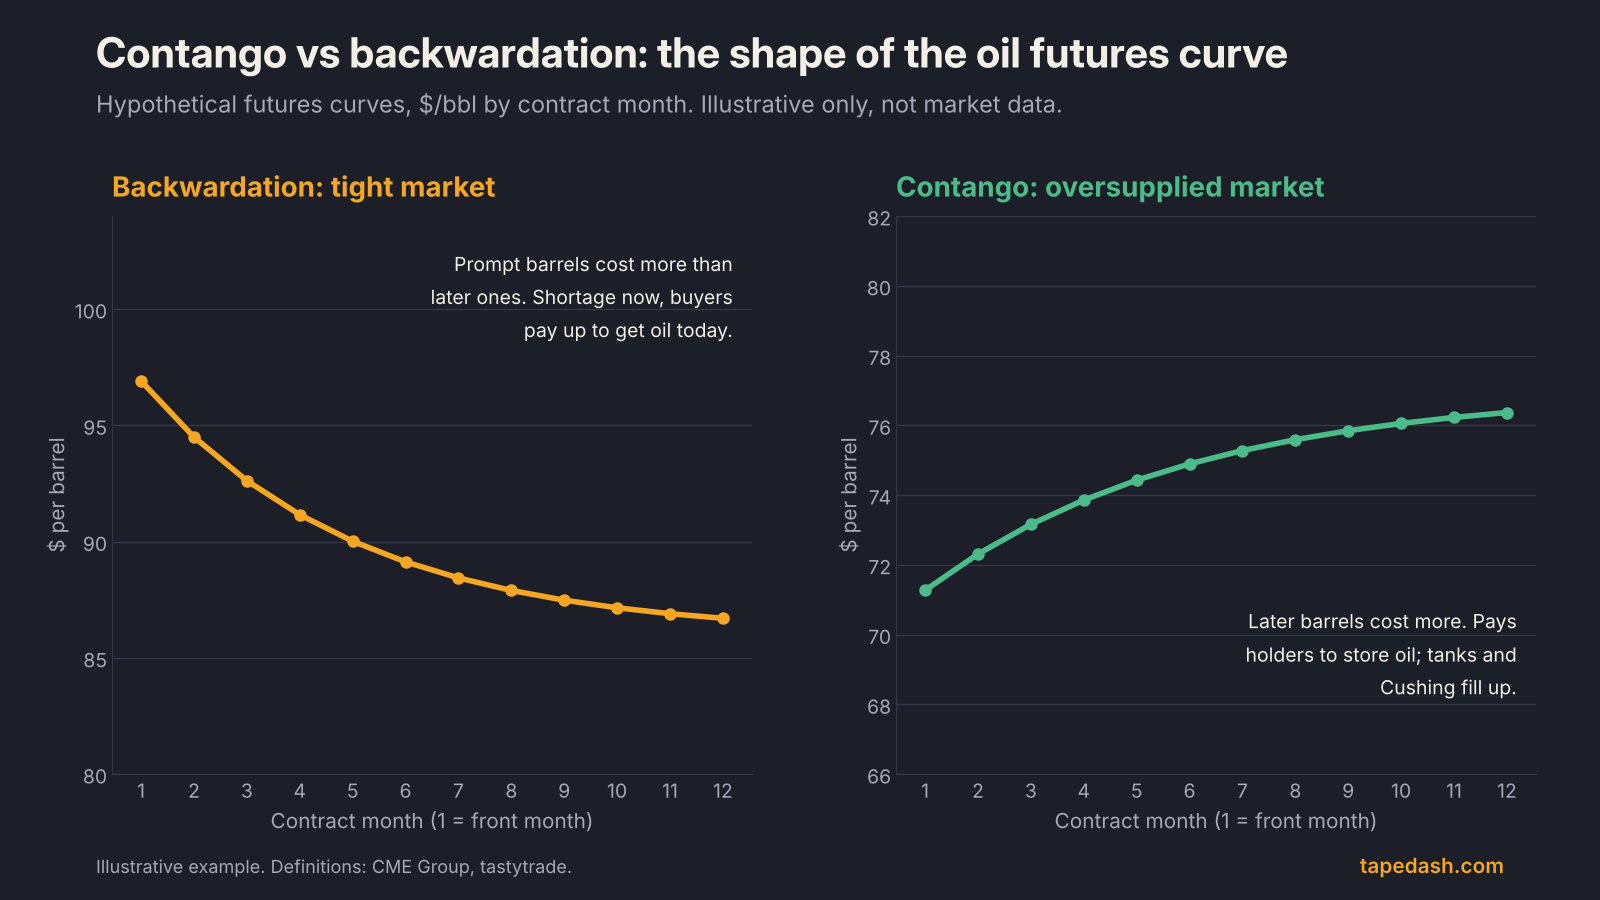
Backwardation means near-term contracts cost more than later ones. Buyers are paying a premium for oil now, which happens when supply is tight. tastytrade describes it as near-term prices exceeding later-dated prices, often because of a physical shortage.
Contango is the reverse. Later contracts cost more, roughly by the cost of storing, insuring and financing a barrel. It shows up when the market is oversupplied, and it pays traders to fill tanks.
Right now the curve is in steep backwardation. MUFG Research described the Brent prompt spread as near the top of its history going back to 1990, and CMB News noted earlier this month that the long-dated contracts sit far below the front month. Put plainly, the market is pricing a severe shortage today and a much calmer market in a few years.
For traders, the spread between the first and second contract is often a cleaner signal than the price itself. A front-month rally with spreads narrowing suggests the physical tightness is easing even as headlines push the price up. A rally with spreads widening says the shortage is real.
The dollar and money flows
Oil is priced in US dollars worldwide. When the dollar strengthens, a barrel costs more in euros, yen and rupees, which tends to cool demand at the margin. When the dollar weakens, the opposite happens. The relationship is loose and breaks down during supply shocks like this one, but in calmer years it is one of the more reliable background forces.
Money also moves oil through positioning. Hedge funds and commodity trading advisers pile into trends and unwind them quickly, which can exaggerate moves in both directions. Interest rates feed in too, through the cost of carrying inventory. If you trade oil around macro events, it helps to know what the dollar and rates are doing, and our guide to reading the CPI report covers how energy prices feed back into inflation data.
What to watch next
Here are the dated events on the calendar.
- Sunday, November 1: The seven core OPEC+ members meet online to decide December production levels. Reuters reported that they are likely to keep targets unchanged, with no final decision yet (Global Banking & Finance Review, OPEC, Gulf News). A surprise in either direction would matter more than usual, since the market expects a hold.
- Wednesday, November 4, 10:30 a.m. ET: The next EIA Weekly Petroleum Status Report, covering the week ending October 30 (EIA schedule, EIA calendar). The API’s preview lands the afternoon before.
- The OPEC+ capacity review: OPEC+ needs to finish a review of members’ production capacity before setting 2027 baselines, and Reuters and Gulf News both reported that output changes are unlikely before next year. Any word on how the cuts will be unwound in 2027 would reshape the longer-dated part of the curve.
- Iran talks and Gulf flows: Every headline about diplomacy, shipping through Hormuz or attacks on energy infrastructure moves the front of the curve. Watch the prompt spreads to see whether the physical market agrees with the headline.
If you want to frame how big a move the options market expects in energy stocks around these dates, our guide to implied volatility and the expected move walks through the math.
How to track oil and energy stocks in TapeDash
If you want to watch whether an oil move is carrying through to equities, this is what we track. Most stock traders do not trade crude futures directly. They express the view through the Energy Select Sector SPDR (XLE) or individual producers, refiners and service names. In the Terminal Preview you can pull up XLE and the large energy names next to each other and see whether the sector is confirming the move in crude or lagging it. A Brent rally with XLE flat often means equity investors expect the spike to fade, which lines up with what a steeply backwardated curve is saying.
The Live Scanner is where we look for unusual options activity in energy names on EIA Wednesdays and around OPEC+ weekends: large call or put prints, unusual volume against open interest, and short-dated positioning ahead of a known event. Our guide to reading options flow explains how to tell a hedge from a directional bet. If you prefer the summary after the close, the free TapeDash Daily covers what moved and why each evening.
Oil prices FAQ
What is the biggest factor that moves oil prices?
Over months, the balance between supply and demand, shown in inventories. Over days, it is usually supply news: OPEC+ decisions, outages, and anything that affects shipping. In 2026 the dominant factor has been disrupted Gulf exports, which pushed supply down faster than demand fell.
What time does the EIA oil inventory report come out?
The Weekly Petroleum Status Report is released at 10:30 a.m. ET on Wednesdays, with a one-day delay in some holiday weeks. The American Petroleum Institute’s report comes out the day before, on Tuesday at 4:30 p.m. ET.
Why is Brent more expensive than WTI?
Brent is waterborne crude priced near global shipping lanes, so it carries the cost and risk of seaborne supply. WTI is priced at an inland US hub. The spread normally runs a few dollars, and it widens when the stress is overseas, as it is now.
The one idea to keep
The front-month oil price is the loudest number in the market and the least informative on its own. Read it next to three others: the inventory surprise on Wednesday, the spread between the first and second futures contracts, and whether OPEC+ members can actually produce what their quotas allow. When all three point the same way, the move in crude usually has legs. When they disagree, the headline price is often the one that gives way.
See it on the tape, not just in the headlines
TapeDash is the research desk for traders and investors: live options flow, dealer positioning, a real-time market scanner and trade alerts graded in public. Memberships open January 1, 2027, and the first 200 members lock Pro at $99 a month for as long as they stay.
Join the waitlistClick through the terminalSee the track recordSources
- Reuters via BOE Report: US crude stocks and distillate inventories fall, gasoline stocks rise, the EIA says (Oct 28, 2026)
- Oil & Gas Journal: EIA: US crude oil inventories down 1.9 million bbl (Oct 28, 2026)
- InvestingLive: Weekly oil inventory data shows a drawdown of 1.892M vs expectations of a 0.015M build
- Trading Economics: Brent crude oil price and news (Oct 28, 2026)
- Business Standard: Brent holds atop $110 as geopolitical risk overrides easing physical stress (Oct 28, 2026)
- MUFG Research: Commodities update, October 26, 2026
- OPEC press release, 4 October 2026
- Nairametrics: OPEC+ keeps November oil production unchanged at 31.01 million bpd
- Interfax: OPEC+ seven keep production levels for October
- Gulf News: OPEC+ keeps November oil output targets unchanged as supply remains disrupted
- Reuters via Global Banking & Finance Review: OPEC+ likely to keep December output targets steady (Oct 27, 2026)
- EIA Today in Energy: The UAE's exit from OPEC
- Enerdata: OPEC+ approves 188 kb/d output hike amid UAE departure
- IEA: Oil Market Report, October 2026
- Nine145: IEA Oil Market Report October 2026 summary
- Global Trading Outlook: IEA cuts 2026 oil demand to 102.4 mb/d as diesel stays scarce
- EIA: Weekly Petroleum Status Report release schedule
- EIA: Release calendar
- EIA: What drives crude oil prices
- StoneX: EIA vs API weekly crude oil inventory reports
- CME Group: WTI product overview
- tastytrade: How to trade oil futures
- CMB News: Crude oil rally steepens backwardation as Brent-WTI spread widens
- Congressional Research Service: Crude Oil Futures Prices Turn Negative
- Dawn (Reuters): Oil crashes, ends negative for the first time in history
- ForexLive: API inventory data due at 4:30 p.m. ET
This article is for educational and informational purposes only. It is not financial, investment, medical or legal advice, and it is not a recommendation to buy or sell any security. Figures come from the sources listed and were checked on the date of publication; markets change quickly. Options trading involves substantial risk of loss.