Bank of England Rate Hike to 4%: Why Energy Forced Its Hand
The Bank of England raised rates to 4%, its first hike since 2023. Why energy prices forced it, what markets now price, and what to watch into December.
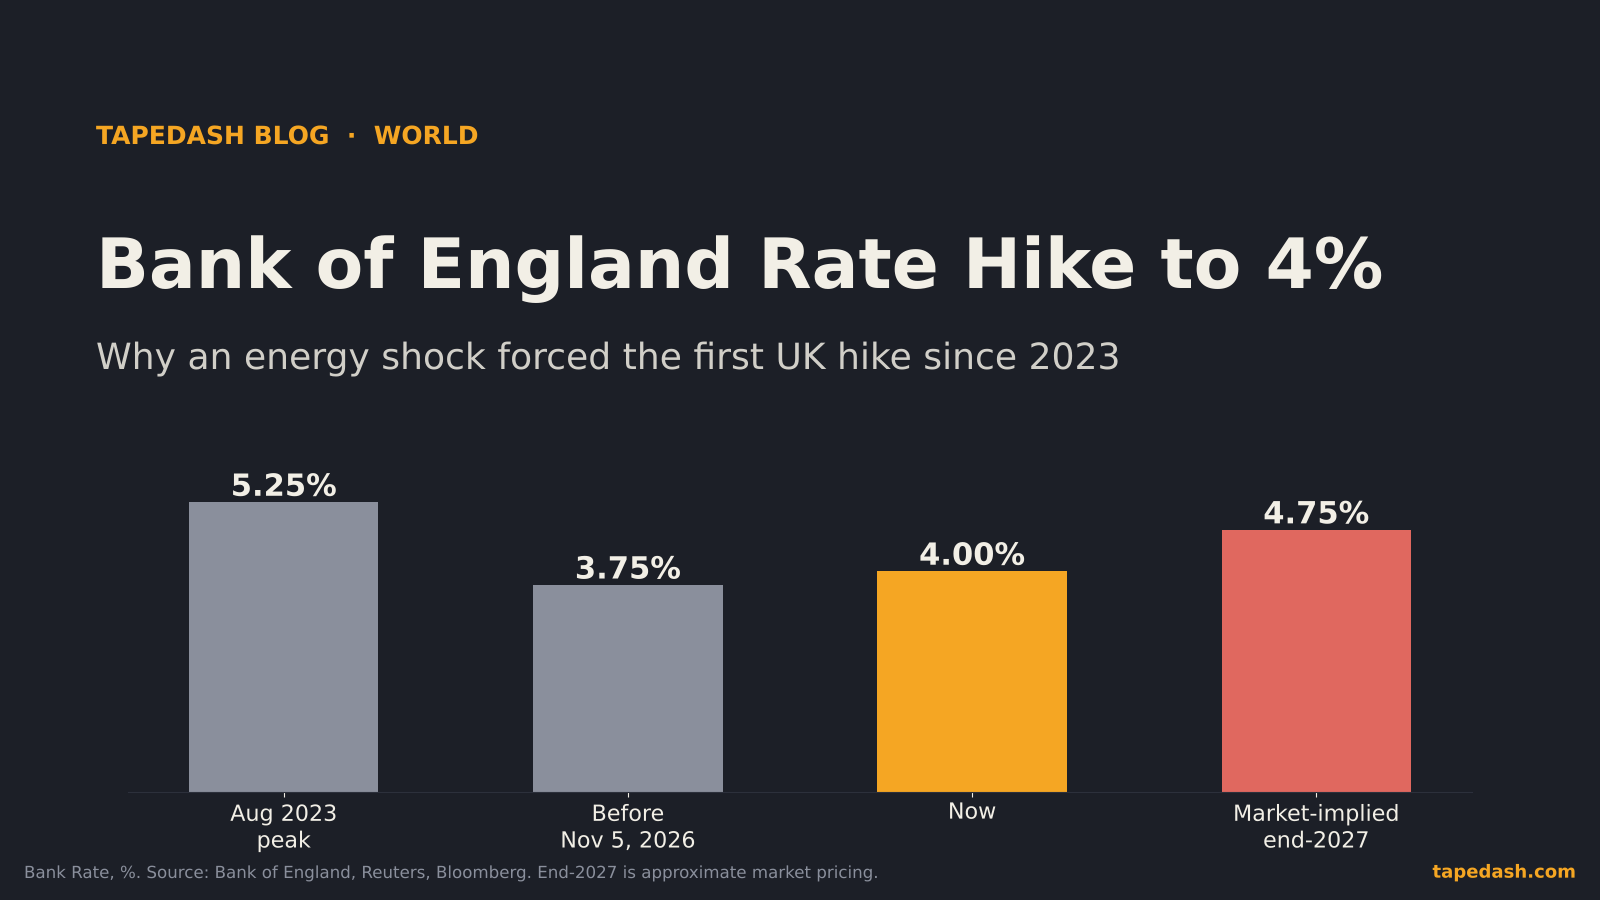
On Thursday the Bank of England raised Bank Rate by a quarter point, from 3.75% to 4%. It was the first UK rate hike since August 2023, and the vote was 8-1, with the one dissenter, Catherine Mann, wanting a half point instead (Bank of England, Reuters). Nobody on the committee voted to hold.
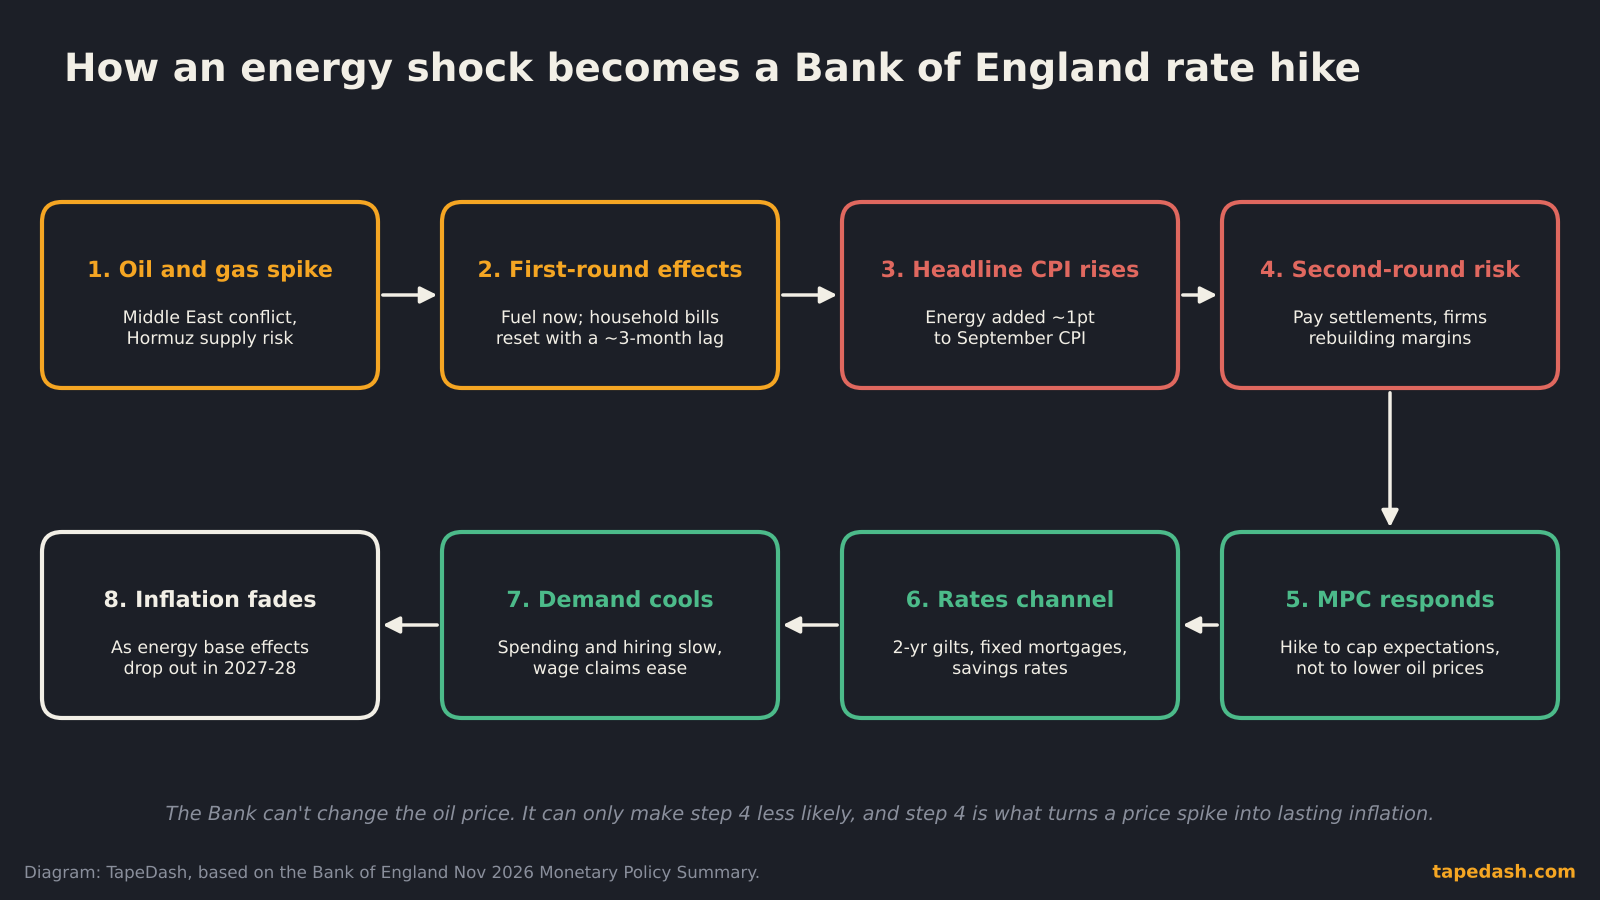
The short answer to why the Bank of England raised rates is energy. Oil and gas prices jumped after the Middle East conflict, UK inflation climbed to 3.5% in September, and the Bank now expects it to peak at about 5% in the second quarter of 2027 (CNBC, Bloomberg via Yahoo Finance). The hike is not meant to bring oil down. It is meant to stop a one-off price jump from turning into a wage-and-price spiral.
The longer answer matters more for traders, because the interesting part of this decision is the gap between what the Bank said and what the market priced afterward. Governor Andrew Bailey said the move should not be read as the first in a long run of hikes. The UK rates market priced roughly three more anyway. That gap is where the trade lives for the next six weeks.
- The Bank of England raised Bank Rate to 4% on Nov 5, 2026, its first hike since August 2023, by an 8-1 vote. The dissenter wanted 4.25%.
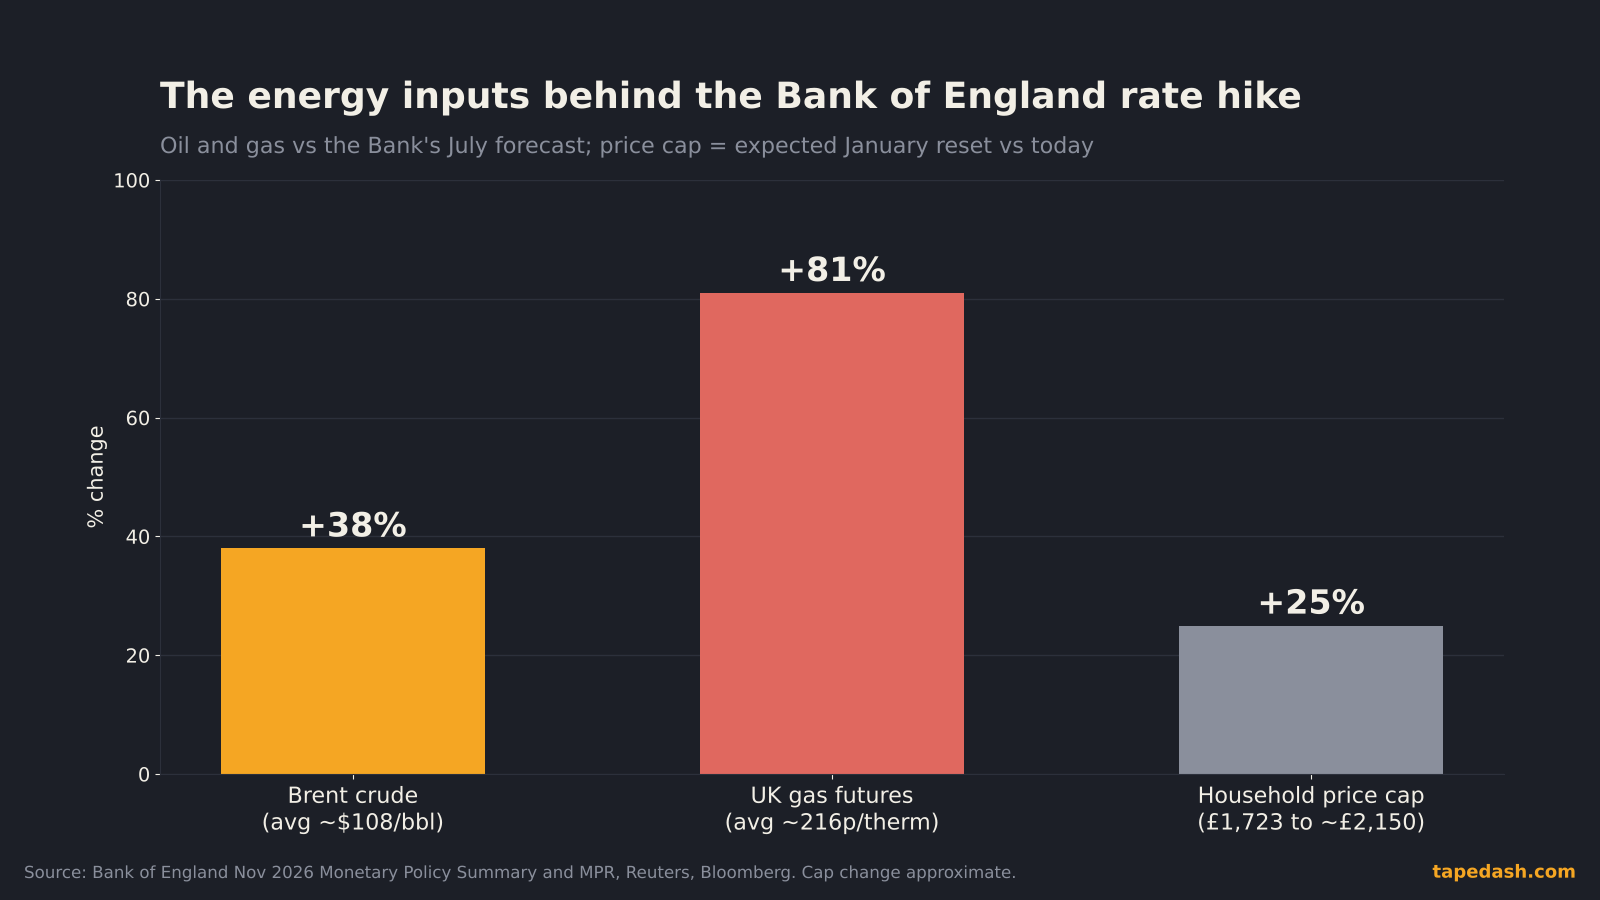
- The driver is energy: Brent averaged about $108 and UK gas about 216p a therm before the meeting, up 38% and 81% from the Bank’s July assumptions.
- The Bank sees CPI peaking near 5% in Q2 2027 and back at 2% around Q3 2028. Its adverse scenario puts the peak at 6.2%.
- Markets price roughly a 50% chance of another hike on Dec 17 and close to three more by end-2027. Many economists expect one at most.
- The swing factor is second-round effects, especially the 2027 pay round. Watch UK CPI on Nov 18 and the January energy price cap.
Why did the Bank of England raise interest rates?
The Bank laid out its reasoning plainly in the November Monetary Policy Summary. In the 15 working days to Oct 27, Brent crude averaged about $108 a barrel and UK front-month gas averaged about 216 pence per therm. Those were 38% and 81% above the levels the Bank assumed in its July report (Martin Cid Magazine reports the same figures). Energy alone added about one percentage point to September’s 3.5% CPI print, mostly through motor fuel.
That is the first-round effect, and central banks usually try to look through it. A spike in the oil price raises the price level once. If nothing else changes, the inflation rate falls back on its own a year later when the spike drops out of the year-over-year comparison. Raising rates does not produce more oil.
So why hike? Three reasons came through in the minutes.
The first is that UK activity has been stronger than the Bank expected. It raised its GDP growth forecasts to 1.6% for 2026 and 1.3% for 2027 (Reuters, Bloomberg via Yahoo Finance). An economy with some momentum gives firms more room to pass on costs.
The second is that the labour market has stopped loosening. Unemployment fell to 4.7% in the three months to August (AJ Bell, Bank of England MPR), and several members described underlying pay growth as no longer falling. When pay growth stalls around 3.5% and energy then pushes headline inflation toward 5%, the next round of wage demands is the risk.
The third is that policy is less restrictive than it was. At 3.75%, with inflation heading toward 5%, the real policy rate was falling as prices rose. Doing nothing was, in effect, an easing. Several members said the stance was still restrictive, but less clearly so.
This was not a surprise, and the vote tells you why
The hike had been building for months. At the September meeting, three of nine members (Mann, Huw Pill and Megan Greene) already voted to raise rates while the majority held at 3.75% (Martin Cid Magazine, Reuters). By Thursday the debate had moved from “whether” to “how much.” Swati Dhingra and Alan Taylor, two members who had resisted hiking, voted for it, but both said they want firmer evidence of second-round effects before backing more. Taylor called it a “one-for-now” insurance move in the minutes.
When I read a central bank vote, I care less about the headline split than about which way the marginal members are leaning. Here the hawks are saying more is coming (Pill and Deputy Governor Clare Lombardelli both pointed to a likely case for another near-term hike) and the doves are saying “maybe, show me.” That leaves the Governor as the swing vote, and Bailey tied his next move to one thing: real progress toward settling the Middle East conflict.
How energy prices feed UK inflation
The UK is unusually exposed to gas prices, because so much of its heating and power runs on it. The channel to household bills runs through Ofgem’s energy price cap, which resets each quarter based on past wholesale prices. The current cap sits at £1,723 a year for a typical household (Be Clever With Your Cash, Bank of England MPR). The Bank expects it to rise to about £2,150 in the first quarter of 2027, and Bloomberg reported a forecast rise of about 25% in January.
That lag is why the inflation peak is still ahead. Petrol showed up in CPI almost immediately. Household gas and electricity bills show up when the cap resets. Bailey made the point directly: even if oil stayed where it is now, there is a lot of inflation already in the pipeline.
The Bank’s staff now see CPI at about 4.5% in early 2027 and close to 5% by the second quarter, with the quarterly average peaking at 4.9% (Bank of England MPR, Bloomberg via Yahoo Finance). Inflation returns to the 2% target around the third quarter of 2028 under the central case (Reuters, TMGM).
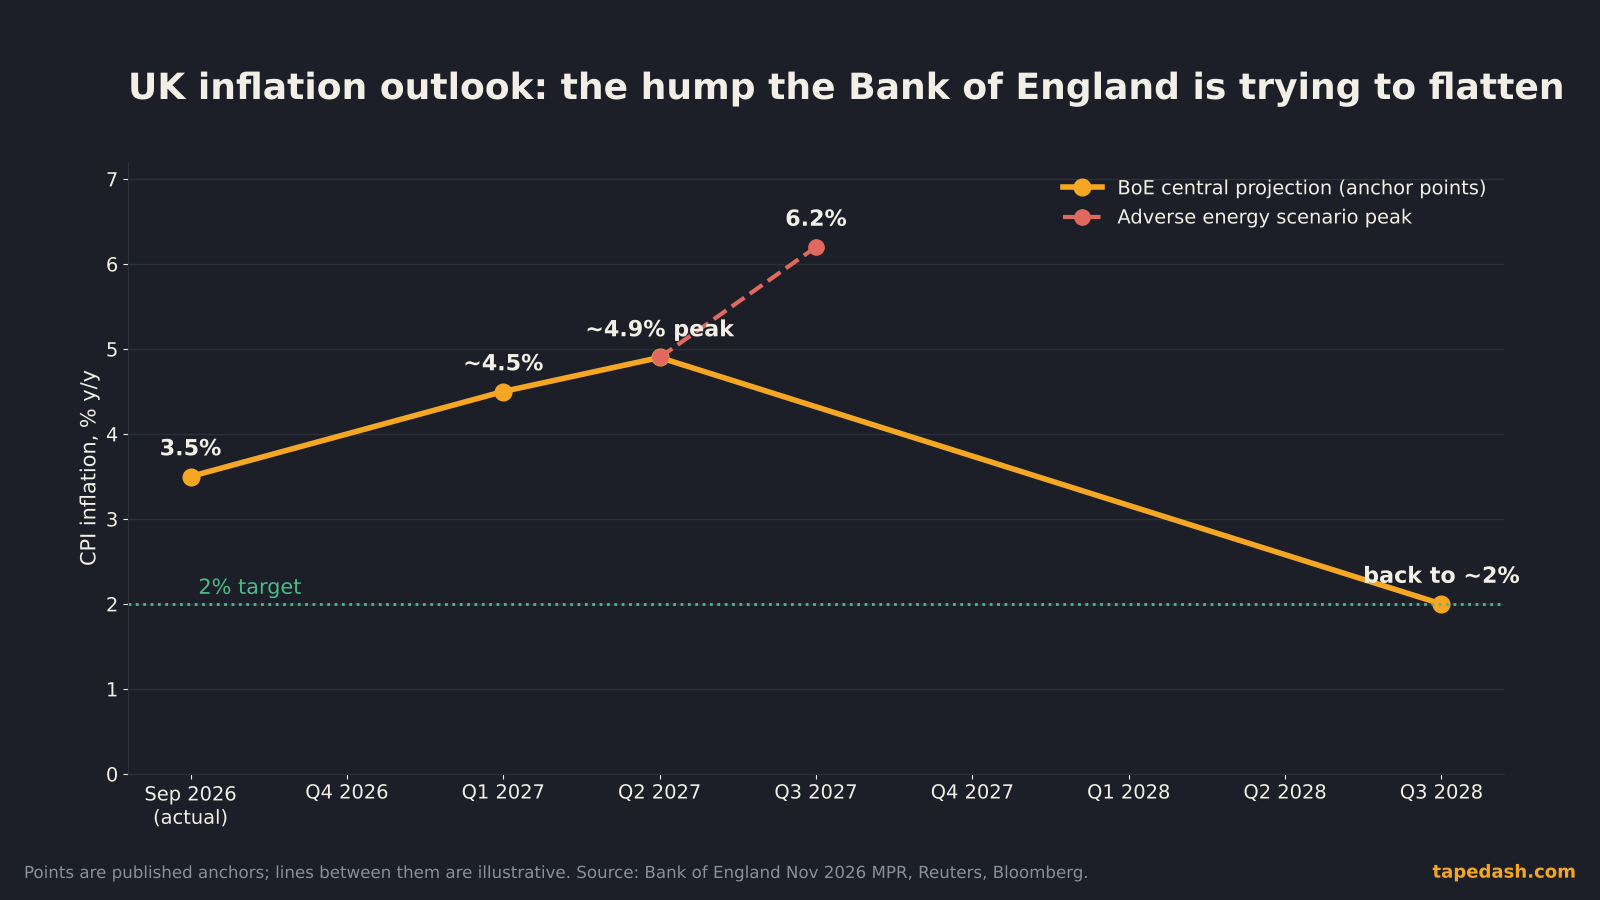
Bank of England scenarios: central, adverse and weaker demand
The November report leaned hard on scenarios instead of a single forecast, which is the honest approach when the main input is a war-driven commodity price. Here is how the three cases line up, based on the Monetary Policy Report and coverage from Reuters and Bloomberg.
| Scenario | What happens to energy | Inflation path | What it implies for Bank Rate |
|---|---|---|---|
| Central | Energy stays high, no new spike | Peaks near 5% in Q2 2027, back to 2% around Q3 2028 | Some further tightening; Bailey says “not on a pre-set path” |
| Adverse | Energy spikes again and stays high, second-round effects take hold | Reaches 6.2% in Q3 2027 | Materially tighter policy than the central case |
| Weaker demand | Household spending pulls back, price pressure fades | Falls well below target later in the forecast | Looser policy later, possibly cuts |
The table shows you the Bank’s real problem. The policy answer is wildly different depending on which world shows up, and the deciding variable is outside its control. That is why the committee keeps repeating that policy is not on a pre-set path. It’s also why the market can’t settle on a number.
What the rate hike did to gilts and sterling
The market reaction was quieter than the headlines. The two-year gilt yield, the part of the curve most tied to the Bank’s next few moves, rose about 3 basis points to 4.77% on the day (Reuters via AOL, Bloomberg via Yahoo Finance). Sterling popped on the decision and then gave most of it back, ending the day around $1.347 against the dollar.
The bigger change was in what traders now expect. The odds of a December hike moved up to roughly 50/50, according to Saxo’s Neil Wilson, and the market added to the tightening it expects by the end of 2027 (Reuters via AOL). Bloomberg’s coverage also put December at roughly a coin flip and described the curve as close to pricing three more quarter-point hikes by end-2027.
Why sterling shrugged off a hawkish hike
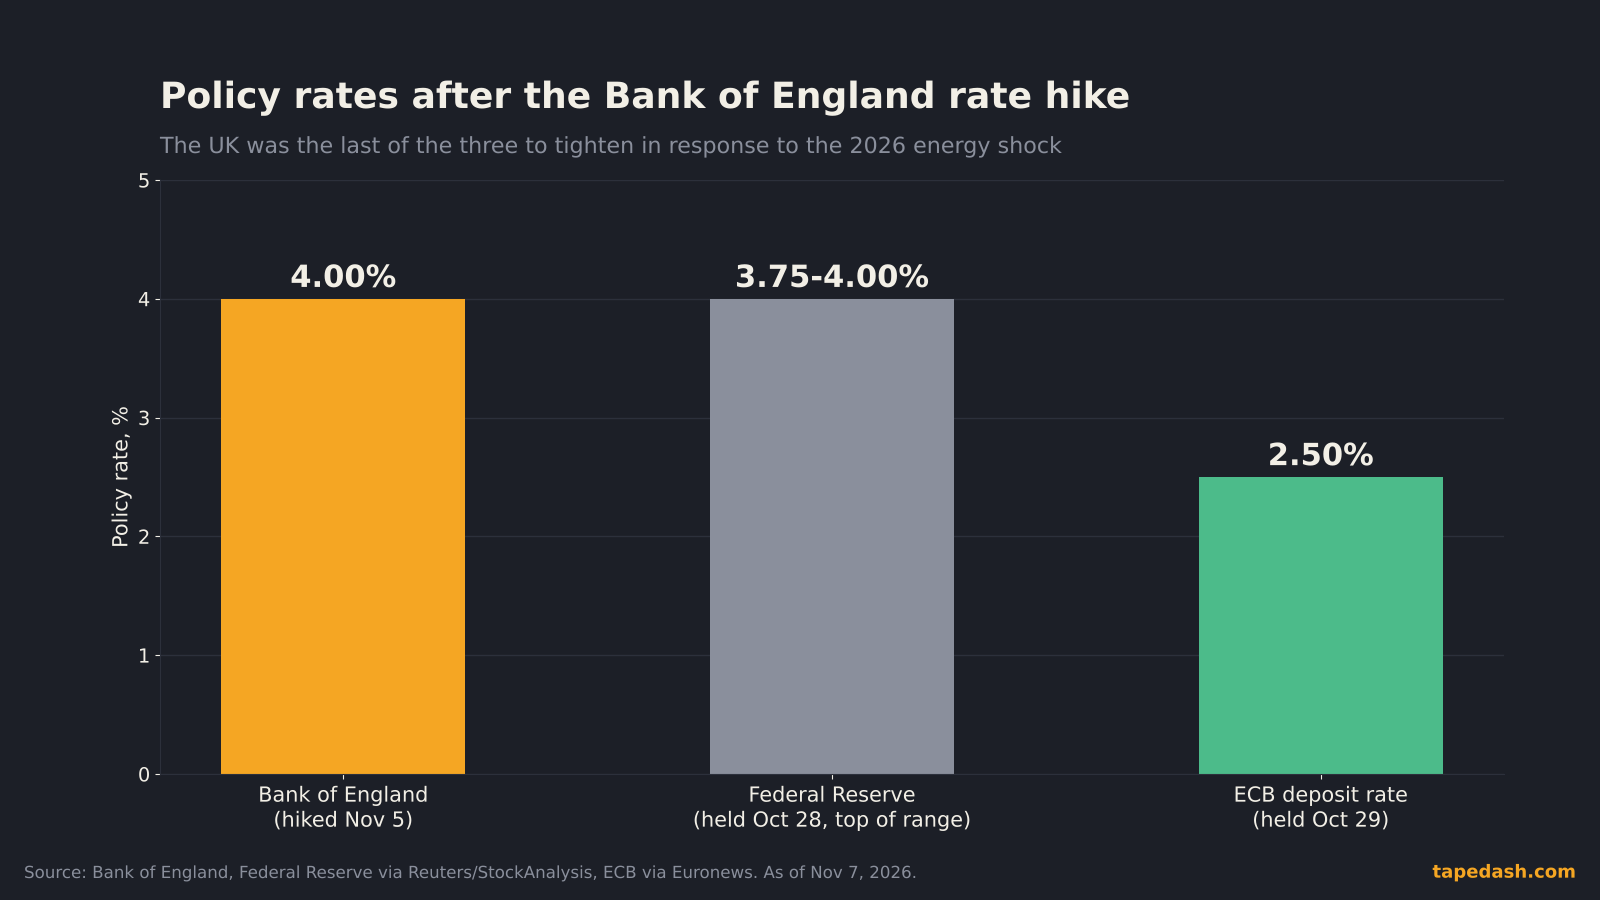
A hike usually supports a currency, so the flat pound looks odd until you remember that FX trades on relative surprises, not absolute moves. The hike was almost fully priced before Thursday. The forward path was already steep. And the other big central banks have been tightening too: the Federal Reserve held at 3.75% to 4% on Oct 28 while signaling it is not done (StockAnalysis, Nation Thailand), and the ECB has raised its deposit rate twice this year, to 2.5% (Euronews, Martin Cid Magazine). The UK was late to the party, not alone at it.
There is a second reason. A central bank hiking into an energy shock is raising rates on an economy whose households are about to take a real-income hit. The Bank expects average household income from work, after tax and inflation, to fall in both 2026 and 2027 (Reuters). FX traders know that “hiking because of inflation you didn’t create” is a weaker currency story than “hiking because the economy is running hot.”
Market pricing vs the Bank: how to read the gap
This is the section I’d bookmark, because the same pattern shows up around every central bank turning point.
After Thursday, the UK curve implies Bank Rate around 4.75% by the end of 2027. The Bank’s own survey of market participants, taken before the meeting, had the median at 4.25% by February. Economists are split. Schroders’ David Rees expects a peak at 4.25%, and BlackRock’s Vivek Paul sees room for only one more hike over the next year, while others expect more in the first half of 2027 (Reuters via AOL).
Bailey himself explained part of the gap. Market pricing, he said, reflects the tail risk of another sharp energy spike, while economists forecast the single most likely path (Reuters). The Bank’s report makes a similar point: part of the slope in the forward curve is risk premium, not a pure forecast.
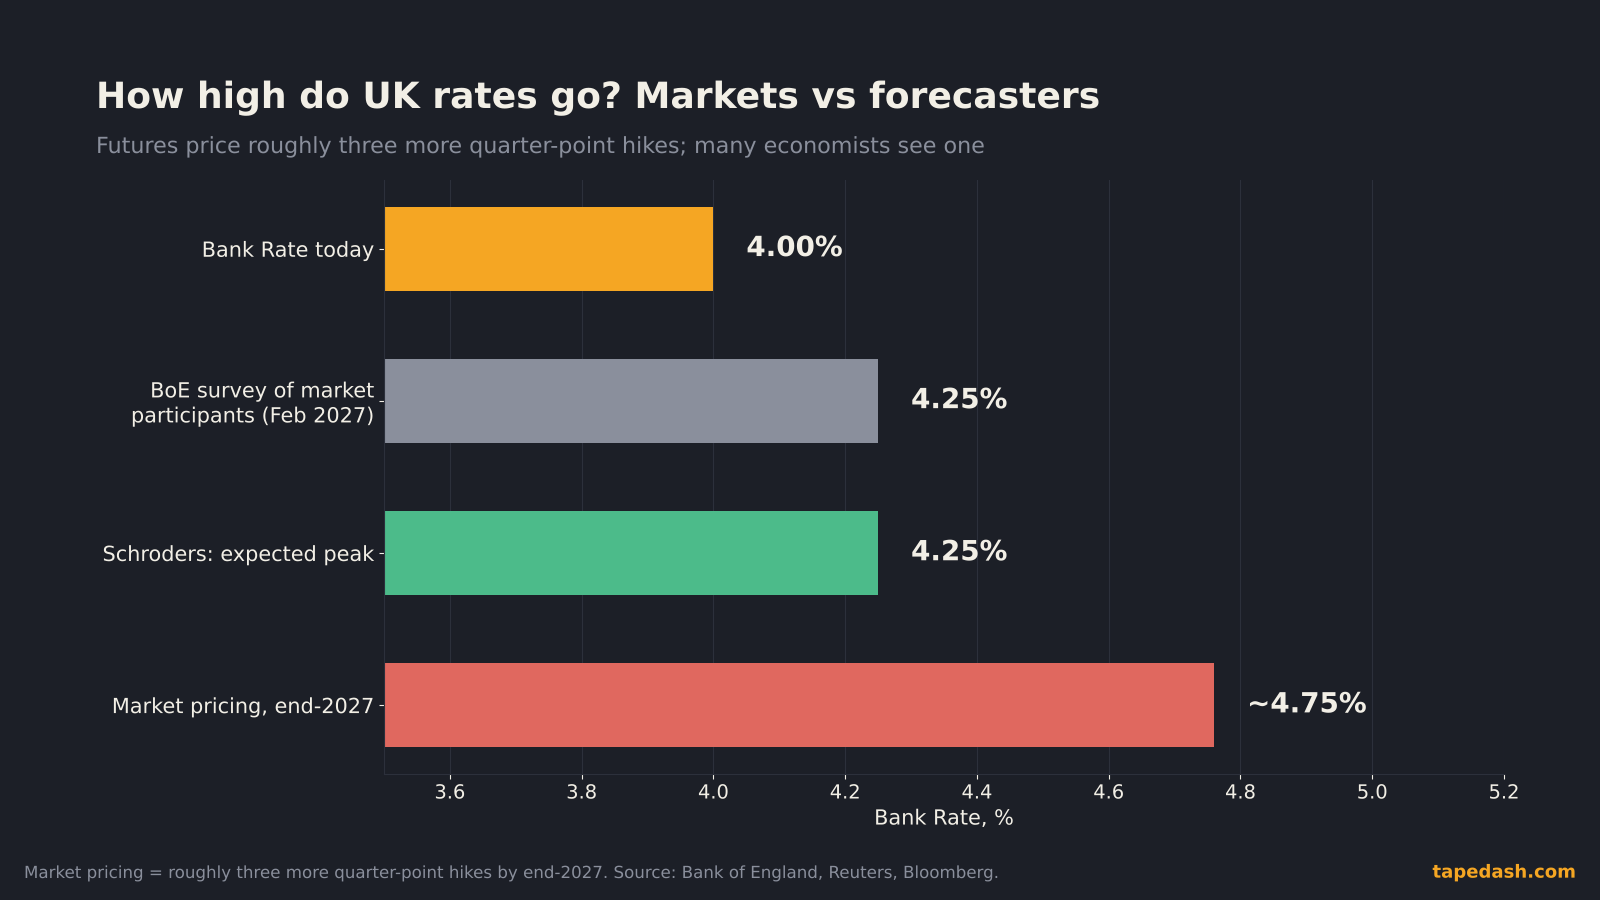
Here’s how I read a gap like this in practice.
First, separate the expected path from the insurance. A forward curve is a probability-weighted average. If there is a 70% chance the Bank stops at 4.25% and a 30% chance an oil spike forces it to 5.5%, the curve lands near 4.6% even though neither outcome is likely to look like 4.6%. When economists and the market disagree by half a point, they often agree on the base case and disagree on how much to pay for the tail.
Second, watch which way the gap closes. If energy prices ease and the tail fades, the front end can rally hard without the Bank doing anything. That’s the scenario where two-year gilts are the trade. If energy flares again, the market is already partly positioned, so the move is smaller than you’d expect from the headline.
Third, trust the short end over the long end for policy reads. The two-year yield reacts to the next few meetings. The ten-year carries term premium, fiscal supply and global rates, so it is a noisier signal of what the Bank will do. We wrote more on why the front end and back end tell different stories in The Yield Curve Explained, and the same logic for reading futures-implied odds is in How to Read CME FedWatch. UK traders use SONIA futures for the same job.
Who wins and who loses from higher UK rates
Mortgage borrowers on trackers and variable rates feel it first. As a rough illustration, a quarter-point rise on a £200,000, 25-year repayment mortgage adds about £30 a month. Fixed-rate borrowers are insulated until they refinance, but the minutes noted that benchmark two-year fixes had already risen, and new mortgage approvals have been falling (Martin Cid Magazine). Housebuilders and estate-agency stocks tend to trade on that approvals data, not on the rate decision itself.
UK banks are the usual beneficiaries of higher rates through net interest margin, as long as credit quality holds. The catch this time is the real-income squeeze. If households are paying more for energy and more on their mortgage at the same time, the rising-rates tailwind can be offset by higher impairments later in the cycle.
Savers get a little more, though not much in real terms while inflation is heading toward 5%.
For equity traders, the FTSE 100 rose on the day of the decision (Reuters via AOL). That makes sense when you look at its makeup. The index is heavy in energy, miners and big multinational earners that report in dollars. An oil shock that hurts UK households can help the UK’s largest listed companies. Domestically focused mid-caps are the more direct read on what higher rates do to the UK consumer. We covered how the oil side of this works in What Moves Oil Prices and the supply risk in OPEC+ December Output Hold: Why Hormuz Matters More Than Quotas.
What to watch next: Bank of England dates and data
The calendar into the next decision is short and specific.
Nov 18: UK CPI for October. The ONS publishes October inflation on Wednesday, Nov 18 (Forex Fundamentals lists the same date). The headline matters less than services inflation, which the Bank says has been flat since spring. A services print that starts climbing would be the first hard sign of second-round effects.
Late November: the January energy price cap. Ofgem sets the cap for January to March before the end of November. A reset near the Bank’s assumption of about £2,150 is already in the forecast. A bigger number adds to the case for December.
Ongoing: oil and gas prices. This is the variable Bailey tied his next move to. A credible step toward settling the Middle East conflict that pulls Brent and UK gas lower would make December a hold. A new flare-up probably makes it a hike.
Dec 17: the next Bank of England decision. The decision and minutes are published together (Bank of England, Martin Cid Magazine). Watch the vote split as much as the decision. If Dhingra or Taylor move toward a second hike, the market will take the path higher. If someone votes to hold, the curve will flatten fast.
Early 2027: the pay round. The Bank named 2027 pay settlements as the key test of second-round effects. Settlement surveys in January and February matter more for the spring meetings than any single CPI print.
How to track the Bank of England rate hike theme on TapeDash
If you want to watch whether the energy-driven hiking cycle spreads, this is what we track. The TapeDash Terminal Preview pulls the macro calendar, rates and FX into one screen, so you can see how a UK CPI surprise on Nov 18 shows up in the dollar, Treasury yields and US-listed energy names in the same window. A central bank turn rarely stays inside one country’s market for long.
For the equity side, the Live Scanner flags unusual options flow and volume in the names most exposed to this story: oil majors, refiners, UK-exposed ADRs and the banks. When positioning shifts ahead of a decision like Dec 17, it often shows up in short-dated options before it shows up in the price. If you’d rather get the read once a day, the free TapeDash Daily covers the overnight session, including European central bank moves, before the US open.
FAQ: the Bank of England rate hike
What is the Bank of England interest rate now?
Bank Rate is 4%, after the Bank of England raised it by 0.25 percentage points on Nov 5, 2026. It had been 3.75% before that decision.
When was the last Bank of England rate hike before this one?
August 2023, when the Bank raised Bank Rate to 5.25% (Bank of England, J.P. Morgan Asset Management). It then cut rates through 2024 and 2025 before reversing course this month.
Will the Bank of England raise rates again in December?
Markets put it at roughly even odds. Bailey said a further rise is likely unless there is real progress on the Middle East conflict, and several members expect more tightening. The October CPI report, the January energy cap and oil prices will decide it.
The one thing to remember
The Bank of England did not hike because the UK economy is overheating. It hiked to keep an energy shock from becoming a wage shock. Every data point between now and Dec 17 should be read through that one question: is there evidence of second-round effects, or not? The market has already priced a good chunk of the answer being yes. If the evidence says no, the front end of the gilt curve is where the surprise will show up first.
See it on the tape, not just in the headlines
TapeDash is the research desk for traders and investors: live options flow, dealer positioning, a real-time market scanner and trade alerts graded in public. Memberships open Black Friday, November 27, and the first 200 members lock Pro at $69.99 a month on their account, even if they cancel and come back later.
Join the waitlistClick through the terminalSee the track recordSources
- Bank of England: Bank Rate increased to 4%, November 2026 Monetary Policy Summary and Minutes (Nov 5, 2026)
- Bank of England: Monetary Policy Report, November 2026 (Nov 5, 2026)
- Reuters via Investing.com: Bank of England raises rates for first time since 2023, warns more likely (Nov 5, 2026)
- Reuters via AOL: Bank of England delivers first rate hike in three years, gilt yields rise (Nov 5, 2026)
- Bloomberg via Yahoo Finance: Bank of England hikes rates with inflation headed to 4.9% (Nov 5, 2026)
- CNBC: Bank of England hikes interest rate for the first time since Iran war, warns inflation will near 5% (Nov 5, 2026)
- Martin Cid Magazine: Bank of England raises rates to 4%, its first hike since 2023, as energy bites (Nov 5, 2026)
- TMGM: Daily Financial Breakfast, BoE raises rate to 4% (Nov 6, 2026)
- Euronews: ECB hikes rates to 2.5% as energy shock pushes eurozone inflation higher (Sep 10, 2026)
- StockAnalysis: Fed holds rates steady at 3.75% to 4.00% (Oct 28, 2026)
- Nation Thailand: US Fed holds rates at 3.75% to 4% after October 28 vote (Oct 29, 2026)
- AJ Bell: UK jobless rate in surprise fall to 4.7% in three months to August (Oct 20, 2026)
- Be Clever With Your Cash: Energy price cap rises to £1,723 from October 2026
- ONS: Consumer price inflation, UK, October 2026 release page
- Forex Fundamentals: UK CPI release, Nov 18, 2026
- Bank of England: Bank Rate increased to 5.25%, August 2023
- J.P. Morgan Asset Management: BoE slows the pace of hikes with rates rising to 5.25%
This article is for educational and informational purposes only. It is not financial, investment, medical or legal advice, and it is not a recommendation to buy or sell any security. Figures come from the sources listed and were checked on the date of publication; markets change quickly. Options trading involves substantial risk of loss.