China Economy Slowdown: Why Exports Boom While Shoppers Stall
China's October data missed across the board. Retail sales grew 0.4% while exports jumped 35%. What the two-speed economy means for markets and stimulus.
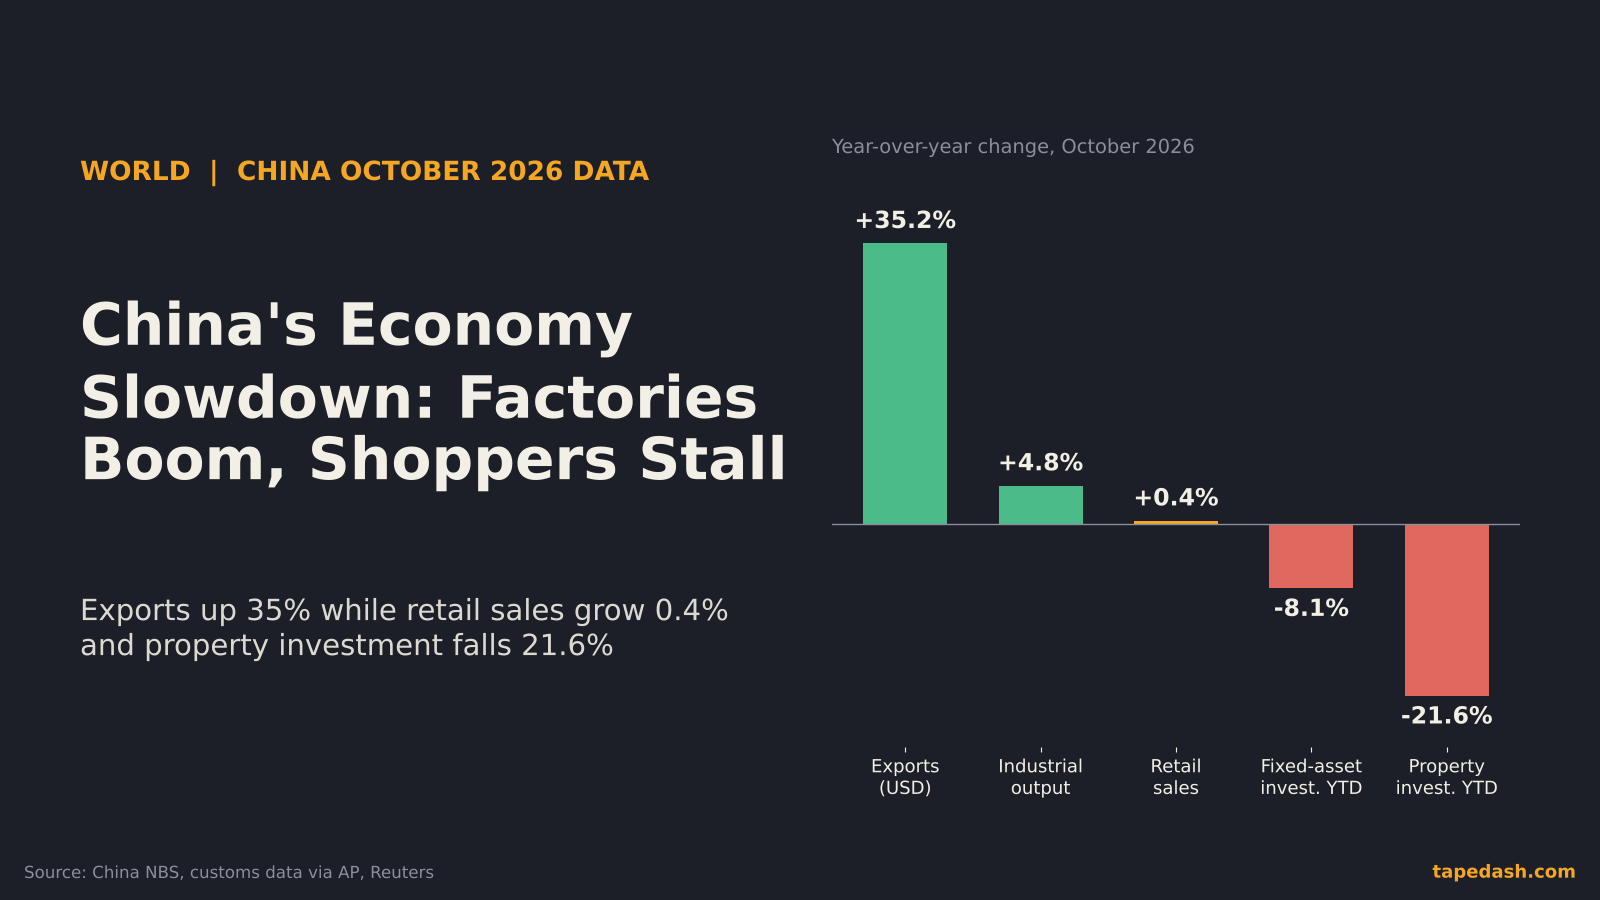
China’s economy slowed again in October, and it did so in a very particular shape. Data released Monday by the National Bureau of Statistics showed industrial output up 4.8% from a year earlier and retail sales up just 0.4%, both short of the Reuters poll forecasts of 5.3% and 0.8% (Finwire/Reuters, Investinglive). Fixed-asset investment fell 8.1% for January through October, worse than the 7.2% drop through September and worse than the 7.0% decline economists expected (Finwire/Reuters, Pomegra).
Now put that next to the trade numbers from a week earlier. China’s exports rose 35.2% in dollar terms in October and imports rose 41.6%, and the trade surplus for the first ten months of the year already tops $1 trillion (AP via KSAT, Kaohoon). So the short answer to “is China’s economy slowing?” is yes, but only half of it. The half that sells to the world, especially chips and electronics, is running hot. The half that depends on Chinese households and Chinese property is still sinking.
That split is the most useful way to read the China economy slowdown right now, and it matters well beyond Shanghai. It shapes copper and iron ore, the Australian dollar, the price of the goods the rest of the world imports, and the odds of a trade fight. Here is how I break it down, what the mechanism is, and what we will be watching into December.
- China’s October data missed forecasts on industrial output (4.8%), retail sales (0.4%) and fixed-asset investment (down 8.1% year to date).
- Exports rose 35.2% in dollar terms and the ten-month trade surplus passed $1 trillion. The economy is running on two very different engines.
- Property investment fell 21.6% and new construction starts fell 24.4% through October. The housing slump is still the main drag on household spending.
- Factory-gate prices rose 5.7% while consumer prices rose 0.7%, a gap that points to margin pressure in the middle of the supply chain.
- Watch the November loan prime rate fixing, the November PMIs, year-end policy meetings and the trade truce that runs to January.
China October 2026 data: what missed and by how much
Start with the scorecard, because the pattern of the misses tells you more than any single number.
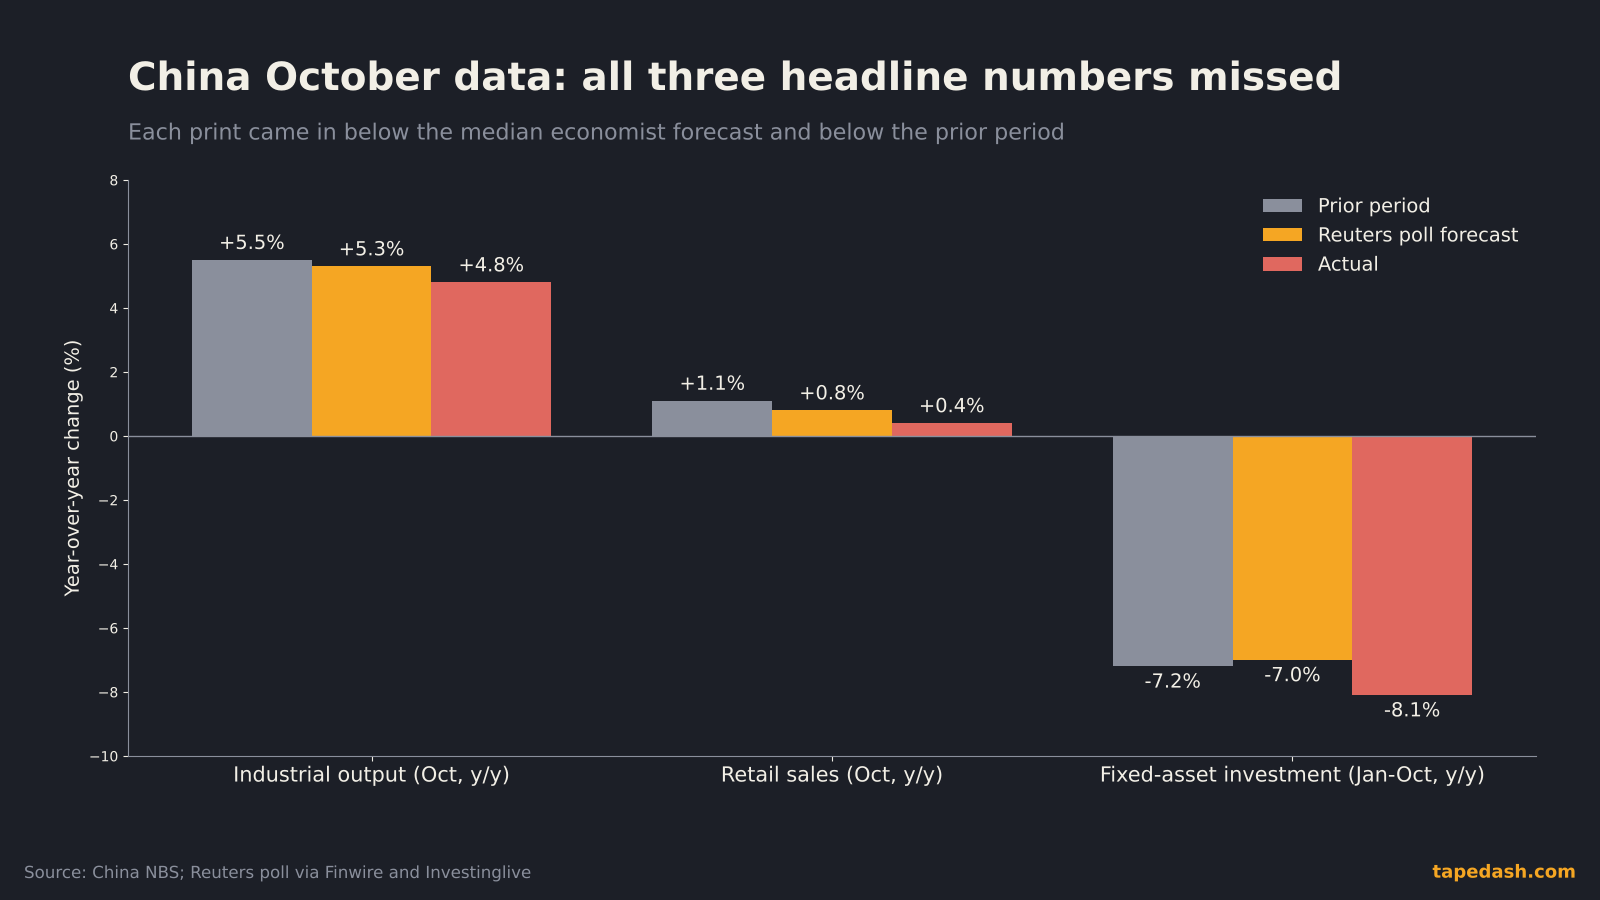
Industrial output slowed to 4.8% from 5.5% in September (People’s Daily, Swarajya). That is still a decent number by global standards, and the year-to-date pace held at 5.3% (Global Times, Investinglive). Factories have been the strongest part of China’s economy all year, and one soft month does not change that.
Retail sales are the problem. Growth of 0.4% is close to flat in nominal terms, down from 1.1% in September (People’s Daily, Swarajya). October includes the week-long National Day holiday, which normally gives spending a lift, so a number this low is worse than it looks. Year to date, retail sales are up 1.0% (Global Times, Investinglive).
The one line that improved was jobs. The surveyed urban unemployment rate dipped to 5.1% from 5.2% (People’s Daily, IndexBox). That is worth noting, though a stable jobless rate alongside nearly flat spending tells you households are earning and choosing to hold on to the money.
Where consumers are still spending
The retail split is revealing. For January through October, sales of services rose 4.9% while sales of goods rose only 0.9% (Global Times, IndexBox). Chinese consumers are still paying for travel, dining and experiences. They are not buying stuff, and “stuff” (appliances, furniture, cars, building materials) is exactly what a healthy housing market usually pulls along with it.
Why is China’s economy slowing? Follow the property market
If you only remember one chart about China, make it the one that shows property. Real estate development investment fell 21.6% in the first ten months of 2026 (Global Times, Investinglive). New construction starts fell 24.4% (Pomegra, Investinglive). The downturn is now in its fifth year.
Home prices are still falling, though more slowly. New home prices fell again in October, and the annual decline was the smallest in almost a year (WHTC/Reuters, Rallies.ai). Shanghai was the only one of the biggest cities where both new and resale prices rose month over month and year over year. “Falling more slowly” is an improvement. It is not a recovery, and Chinese families feel the level of their home value, not the second derivative.
This is why property drives everything else. In China, a large share of household wealth sits in apartments. When that wealth shrinks for five straight years, people save more, borrow less and put off the big purchases. Local governments, which used to fund a lot of their spending by selling land to developers, have less money for infrastructure. Infrastructure investment fell 5.1% through October (IndexBox, Investinglive).
The investment number is the one that should worry people
Fixed-asset investment is down 8.1% this year, and even stripping out real estate it is down 5.1% (IndexBox, Global Times). Private investment fell 11.4% (Global Times, Investinglive), and manufacturing investment is down 2.9% (Global Times, IndexBox). That last figure is interesting. Factories are producing flat out and exporting record amounts, yet companies are cutting spending on new capacity. That reads like businesses that already have more than enough capacity and do not trust domestic demand enough to build more.
The two-speed economy: exports vs retail sales
Here is the full picture in one chart.
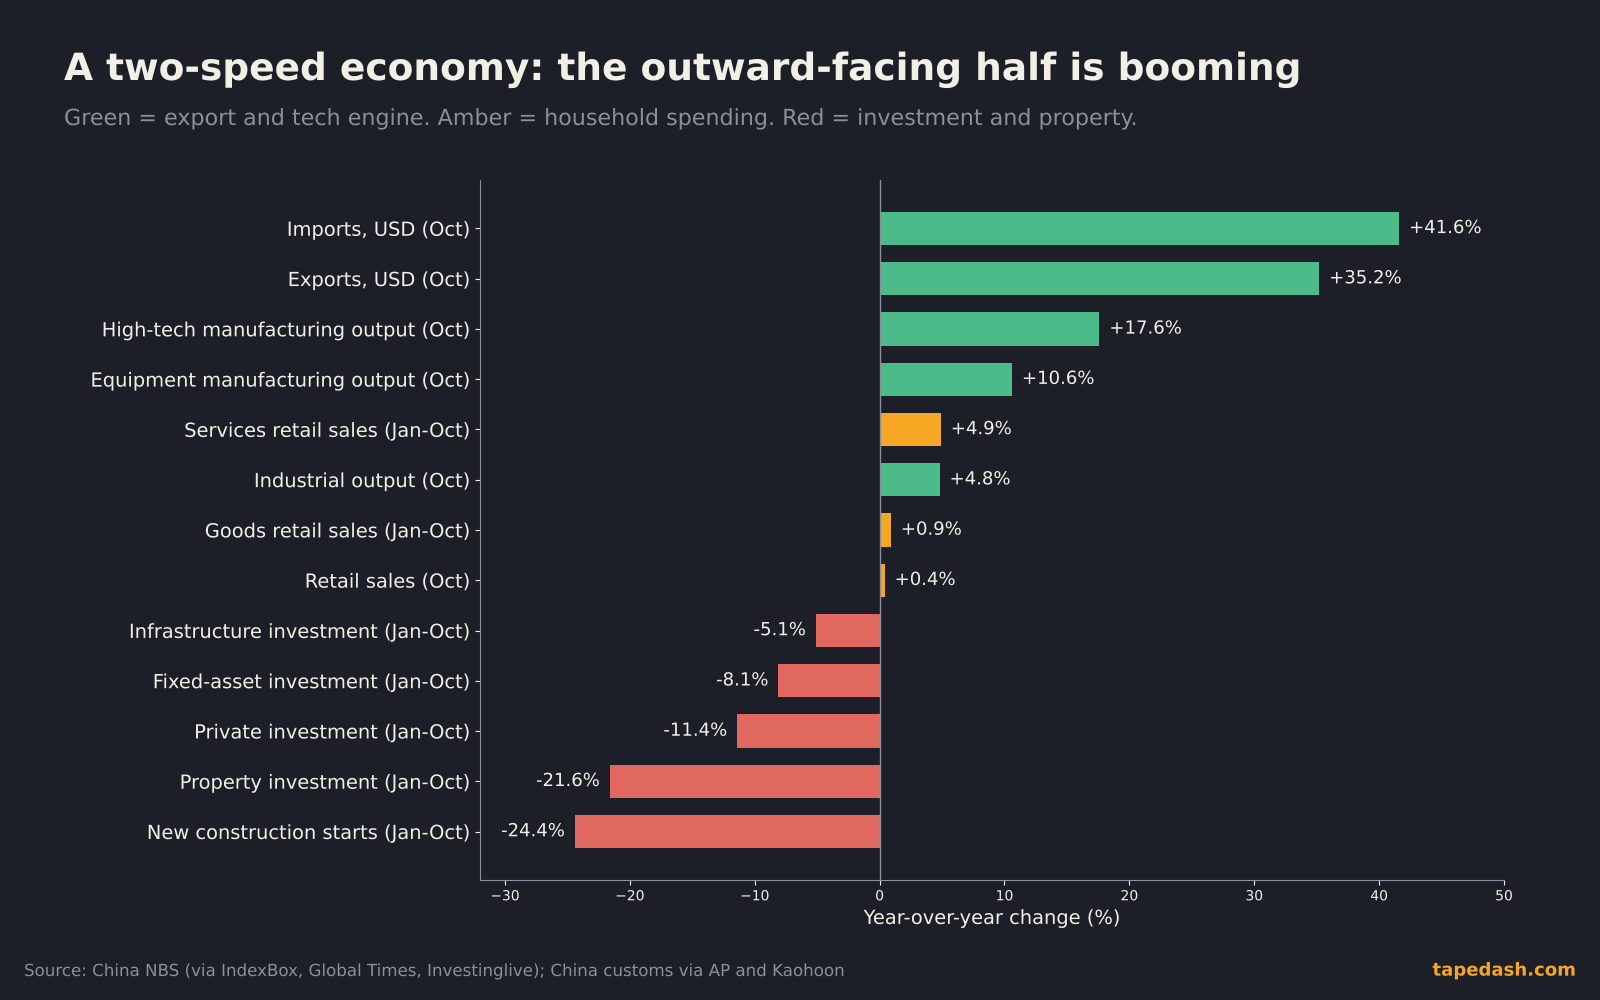
The outward-facing engine is extraordinary. High-tech manufacturing output rose 17.6% in October and equipment manufacturing rose 10.6% (IndexBox, Global Times). Semiconductor exports more than doubled in value from a year earlier (AP via KSAT, Kaohoon). Exports to the United States rose about 33% from a low base that followed last year’s tariffs (AP via KSAT, Kaohoon).
A lot of that is the global AI build-out. Data centers need servers, power equipment, cables, cooling and memory, and Chinese factories make large chunks of the hardware chain. I wrote about how AI capex flows through to chip stocks last month, and China’s customs data is the other end of that same pipe.
The obvious risk is concentration. Dave Chia of Moody’s Analytics told AP that if the AI boom cools, lower chip and electronics prices would hit China’s exports hard. So the part of China that is working is tied to the same theme that has been wobbling on Wall Street. On Monday the Nasdaq slid as tech selling deepened ahead of Nvidia’s results later this week (Stock Titan, The Motley Fool). If you hold a view on AI hardware demand, you are also holding a view on China’s growth engine, whether you meant to or not.
How weak home demand becomes a global export wave
The mechanism is worth drawing out, because it explains why the trade surplus keeps getting bigger even as China’s own economy feels weak.
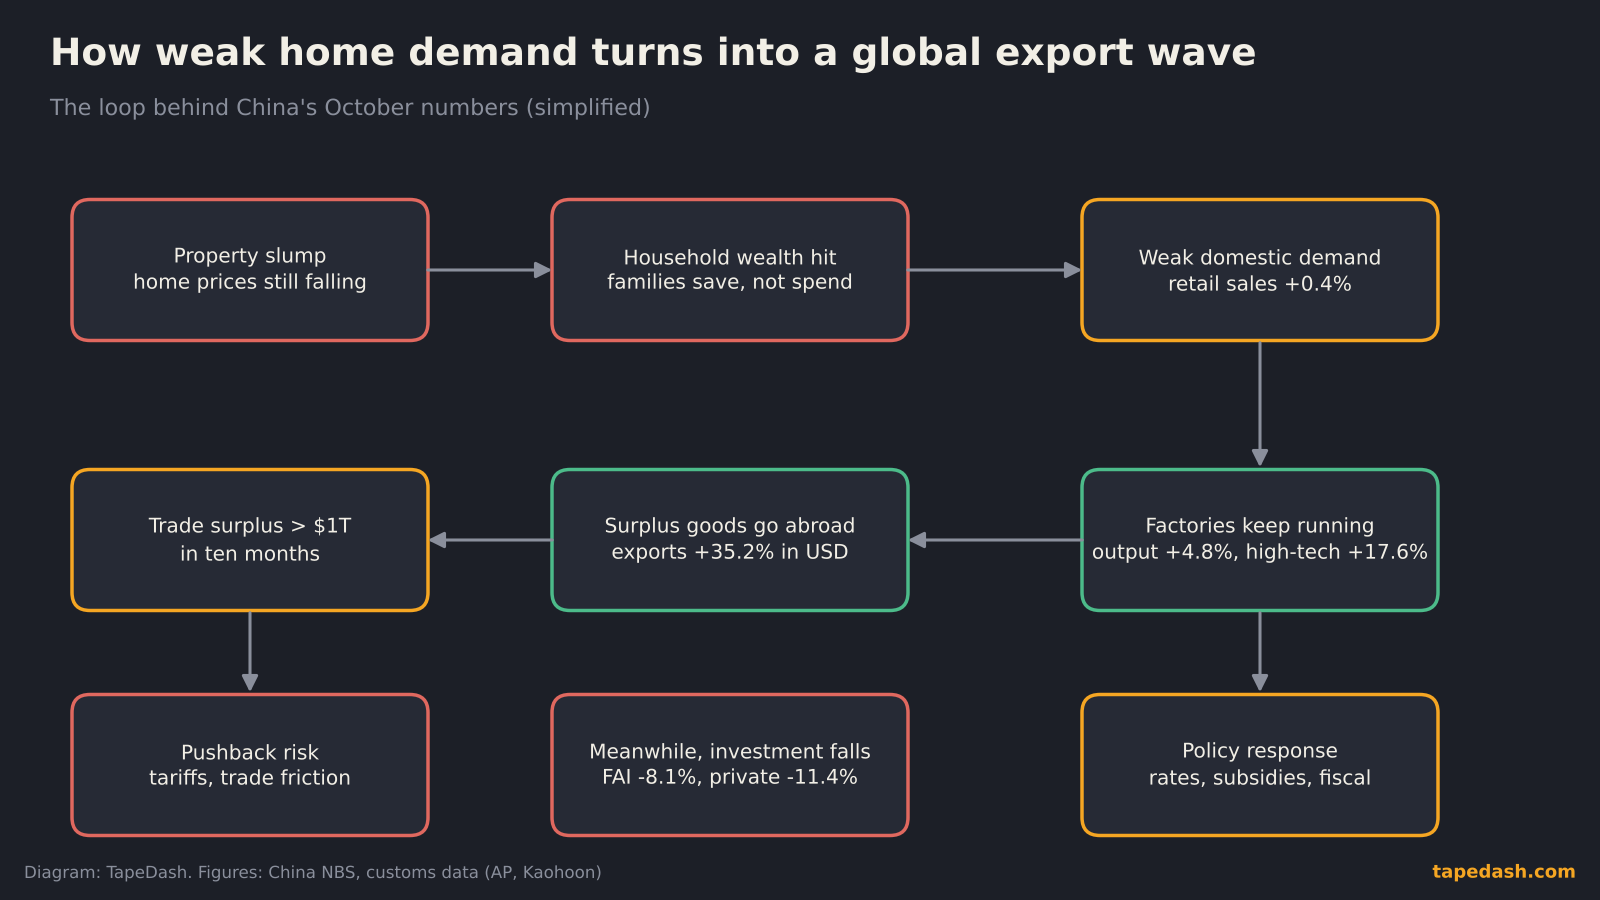
Step by step: the property slump drains household wealth. Households save instead of spend. Factories, many of them backed by local governments that want the jobs and the tax base, keep running. Output that cannot be sold at home gets sold abroad, often at aggressive prices. The trade surplus grows, and that eventually invites pushback from trading partners.
Alicia García-Herrero of Natixis put the conclusion bluntly to AP: “The situation is not sustainable.” Her argument, paraphrased, is that overcapacity, high savings and weak domestic demand together keep pushing China toward heavy exporting. You do not have to agree on the timing to see the direction. A surplus of this size is a political and economic pressure point, and the current trade truce runs only to January (AP via KSAT).
The surplus did narrow a bit in October, to $105.3 billion, because imports jumped (AP via KSAT, Kaohoon). Part of that import jump is the cost of energy, which leads to the price story.
China PPI vs CPI: what the inflation gap tells you
China’s producer price index rose 5.7% from a year earlier in October, up from 5.0% in September, while consumer prices rose just 0.7% (Xinhua, IndexBox). Food prices are falling. Energy is the driver at the factory gate, led by coal mining and oil and gas extraction, according to the statistics bureau’s breakdown reported by Xinhua.
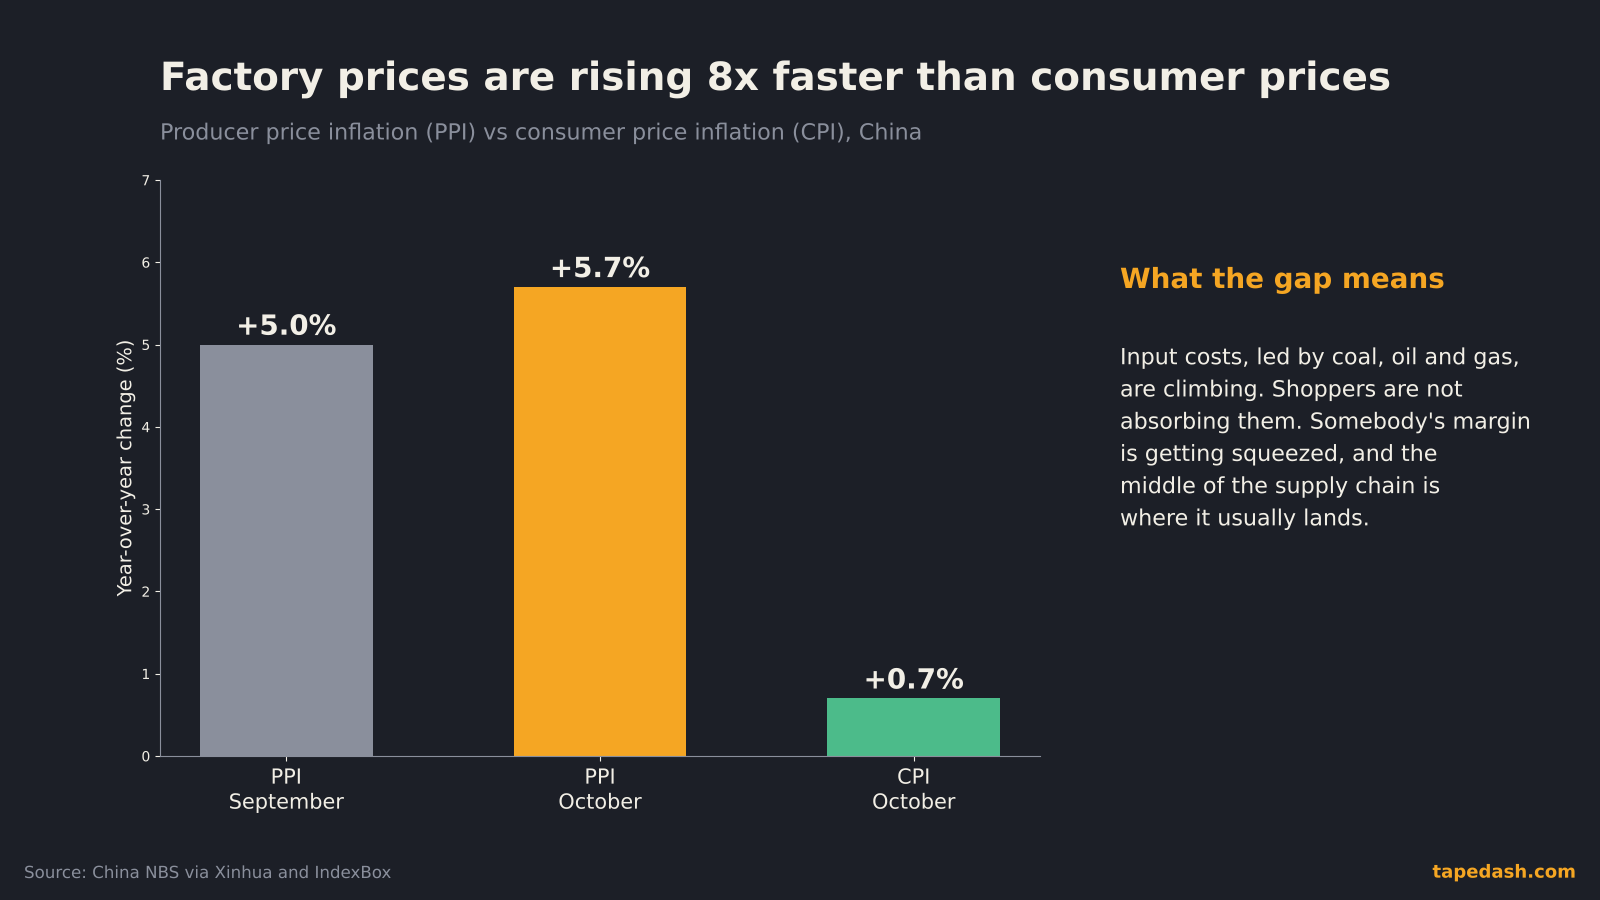
For years the worry about China was deflation: too much supply chasing too little demand, pushing prices down everywhere. The 2026 version is stranger. Input costs are rising because of energy, but households still have no appetite to absorb higher prices. That squeezes the companies in the middle, the processors and assemblers who buy coal, fuel and chemicals and sell to price-sensitive buyers at home and abroad.
For markets outside China, the export side matters most. If Chinese manufacturers start passing higher costs into export prices, that adds a small upward push to goods inflation in the countries that buy from them. It is one reason I keep an eye on China’s PPI next to the U.S. producer price data. They are not the same thing, but they rhyme. If the energy-driven part fades, as it would if oil keeps sliding, China’s PPI would cool fast and the old deflation worry would come back.
How to read China’s monthly data like a trader
China’s monthly data dump comes out around the middle of each month, usually a few days after the trade and inflation releases. Here is the order I read it in, and why.
1. Retail sales first, and the split between goods and services. This is the cleanest read on household confidence. A rise in services with flat goods means people are still living their lives but not committing to big purchases. Goods spending turning up would be the first real sign that the property drag is easing.
2. Property investment and new starts next. Developers start projects when they believe they can sell them. New starts falling faster than total property investment, as they are now, says the pipeline is still shrinking.
3. Fixed-asset investment, then the private share. Headline investment is shaped by government projects. Private investment shows what businesses actually believe. A gap of more than three points between the two, as we have today, says the private sector is more pessimistic than Beijing.
4. Industrial output last, and in context. Output can stay strong for reasons that are not healthy, such as producing for export at thin margins. Pair it with the trade data and PPI before you call it good news.
5. The market reaction tells you what was priced. On Monday the offshore yuan barely moved after the release, which Investinglive read as a sign that traders had already expected weak numbers (Investinglive). Iron ore, copper and the Australian dollar came under some pressure (Pomegra). When a miss gets a shrug, the next surprise that matters is usually a policy one.
Here is how the data lines up against what a real domestic recovery would need to look like.
| Indicator | October 2026 reading | What a domestic recovery would need |
|---|---|---|
| Retail sales (y/y) | +0.4% | Sustained growth well above inflation, led by goods |
| Industrial output (y/y) | +4.8% | Steady, with less dependence on exports |
| Fixed-asset investment (Jan-Oct) | -8.1% | Decline narrowing for several months |
| Private investment (Jan-Oct) | -11.4% | Closing the gap with the headline figure |
| Property investment (Jan-Oct) | -21.6% | Smaller declines and rising new starts |
| Urban unemployment | 5.1% | Stable or lower, which it already is |
| Exports in USD (y/y) | +35.2% | Less important as domestic demand takes over |
| CPI vs PPI (y/y) | +0.7% vs +5.7% | A narrower gap, with CPI firming on demand rather than costs |
Only one of those rows, unemployment, is where it needs to be.
China stimulus 2026: what Beijing could do next
Beijing’s growth target for 2026 is 4.5% to 5% (AP via KSAT, Swarajya), and the strong export run makes that reachable. That cuts both ways. A government that is hitting its headline target has less urgency to do something dramatic for consumers.
On the monetary side, the People’s Bank of China has held its benchmark loan prime rates steady for 17 straight months, with the one-year rate at 3.0% and the five-year rate at 3.5% as of the October fixing (Investinglive, New Straits Times). The central bank has leaned on liquidity operations and targeted tools rather than headline cuts. Housing support so far has focused on mortgage interest subsidies for eligible first-time buyers and rules to stop developers from selling homes before they are finished (WHTC/Reuters).
I think about the next few months as four scenarios. They are not predictions. They are a map of what each path would look like and which markets would tell you first.
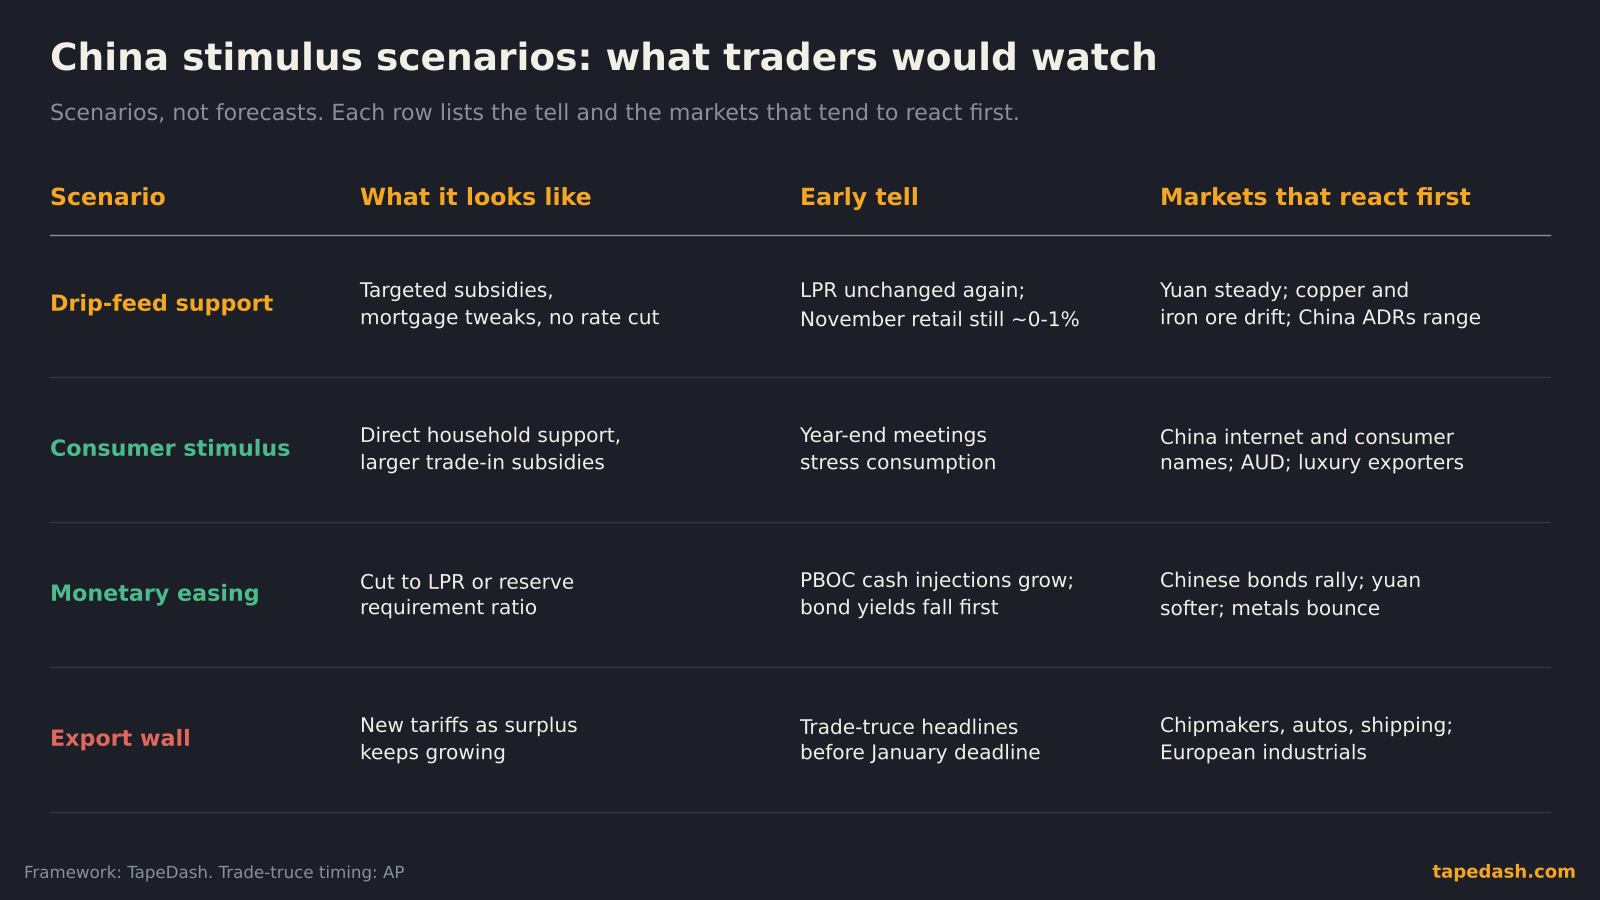
Drip-feed support is the status quo: targeted subsidies, mortgage tweaks, liquidity injections, no big rate cut. If that continues, expect China-linked assets to keep trading in ranges, with commodities drifting on each data miss.
Consumer stimulus would mean money aimed at households directly, through larger trade-in subsidies, social spending or cash support. The tell would be the language from year-end economic planning meetings. If “boosting consumption” moves to the top of the list with real money attached, traders would look at Chinese consumer and internet names and at commodity currencies.
Monetary easing would show up as a cut to the loan prime rate or to banks’ reserve requirements. Chinese government bonds usually move first, and the yuan would likely soften.
An export wall is the risk scenario: a trading partner, or several, responding to the surplus with new tariffs. Chipmakers, autos and shipping would carry that risk first. Trade-truce headlines into January are the thing to watch here.
What to watch next on China
The November loan prime rate fixing, later this week. Another hold would be the 18th in a row. A cut would be the clearest sign that Beijing has shifted gears after these numbers.
Nvidia’s earnings this week. Not a Chinese release, but the AI hardware cycle is now the main engine of China’s export growth. A strong outlook supports the green bars in the chart above. A disappointing one puts them at risk.
China’s official November PMIs at the end of the month. These are the first read on November factory activity. A manufacturing PMI above the 50 line that separates expansion from contraction would say the October dip in output was temporary.
November trade, inflation and activity data in December. The November retail print will cover the full Singles Day shopping period. A second near-zero reading would make the case for consumer stimulus much harder for Beijing to ignore.
Year-end economic planning meetings in December. These set the tone for 2027. Watch for the order of priorities and whether household support comes with numbers attached.
The trade truce deadline in January. With the ten-month surplus above $1 trillion, the surplus itself is now a negotiating issue.
For the yen side of Asia, where a different set of risks is building, my explainer on the yen carry trade covers why Japan can shake global markets in a way China’s data usually does not.
How to track China’s economy with TapeDash
If you want to watch whether this two-speed story resolves toward a domestic recovery or a deeper export dependence, this is what we track. The Macro Regime view puts growth, inflation and rates signals in one place, so a shift in commodity currencies, metals and yields after a China release shows up next to the U.S. data it interacts with. It is the quickest way to see whether a China miss is getting a shrug or a real repricing.
For the market side, ETF Flows shows where money is moving in China and emerging market funds, copper and metals ETFs and semiconductor ETFs. Persistent inflows into China funds after weak data would tell you investors are betting on stimulus. Outflows would tell you they are giving up on it. You can see both, along with options flow on the same tickers, in the Terminal Preview.
If you would rather get the short version each morning, the free TapeDash Daily covers releases like this one in a few lines, with what moved and what is next.
FAQ
Is China’s economy in a recession?
No. Industrial output is still growing near 5% and exports are surging. The weakness is concentrated in household spending, property and investment. Nominal retail growth of 0.4% is close to flat, which is why the data feels recessionary for Chinese consumers even though headline growth is positive.
Why are China’s exports so strong if its economy is weak?
Weak demand at home is part of the reason. Factories keep producing, and output that cannot be sold domestically is sold abroad. Demand for AI-related hardware, chips and autos has added to that. Semiconductor exports more than doubled from a year earlier in October.
What does China’s slowdown mean for U.S. stocks?
The direct effects run through commodities, multinational companies with big China sales, and the AI hardware chain. The indirect effect is prices: China’s export prices influence goods inflation in the countries that buy from it, and a trade dispute over the surplus would hit semiconductors, autos and shipping first.
The one thing to remember
China is not one economy right now. It is two, moving in opposite directions: an export and technology engine growing at double-digit rates, and a household and property economy that has barely grown in years. The headline number blends them into something that looks fine. The details say the domestic half still needs help, and the market will move when Beijing finally decides how much help to give.
See it on the tape, not just in the headlines
TapeDash is a market research and data analytics platform for traders and investors: live options flow, dealer positioning, a real-time market scanner, stock ratings, and macro and earnings data in one terminal. Memberships open Black Friday, November 27, and the first 200 members lock Pro at $69.99 a month on their account, even if they cancel and come back later.
Join the waitlistClick through the terminalSee the track recordSources
- Finwire (Reuters): China's factory output, retail sales growth slow in October (Nov 16, 2026)
- Investinglive: China's October data shows the economy losing momentum on retail sales and industry output (Nov 16, 2026)
- People's Daily: China's economy remains broadly stable in October (Nov 16, 2026)
- Global Times: Chinese economy maintains stable growth in October (Nov 16, 2026)
- IndexBox: China October 2026 economic data, industrial output up 4.8% (Nov 16, 2026)
- Swarajya: October data reveals China's economic momentum weakening (Nov 16, 2026)
- Pomegra: China's October 2026 data miss deepens demand worries (Nov 16, 2026)
- WHTC (Reuters): China's new home prices fall again in October, slowest annual decline in almost a year (Nov 15, 2026)
- Rallies.ai: China's new home prices fall again in October (Nov 15, 2026)
- AP via KSAT: China's trade surplus surpasses $1 trillion for a 2nd straight year, as exports surge 35% (Nov 10, 2026)
- Kaohoon International: China's exports grow 35% in October as AI and technology demand fuels shipments (Nov 10, 2026)
- Xinhua: China's consumer prices maintain mild recovery in October (Nov 9, 2026)
- Investinglive: China holds loan prime rates steady, 1-year LPR at 3.0%, 5-year at 3.5% (Oct 2026)
- New Straits Times: China leaves loan rates steady for 17th consecutive month (Oct 2026)
- Stock Titan: Stock market today live, November 16, 2026 (Nov 16, 2026)
- The Motley Fool: Stock market today, Nov. 16 (Nov 16, 2026)
This article is for educational and informational purposes only. It is not financial, investment, medical or legal advice, and it is not a recommendation to buy or sell any security. Figures come from the sources listed and were checked on the date of publication; markets change quickly. Options trading involves substantial risk of loss.