Housing Starts Jump, Permits Sink: What October's Split Signals
Housing starts rose 9.9% in October while building permits fell to the lowest since May 2020. Why the two split and what it means for builders and 2027.
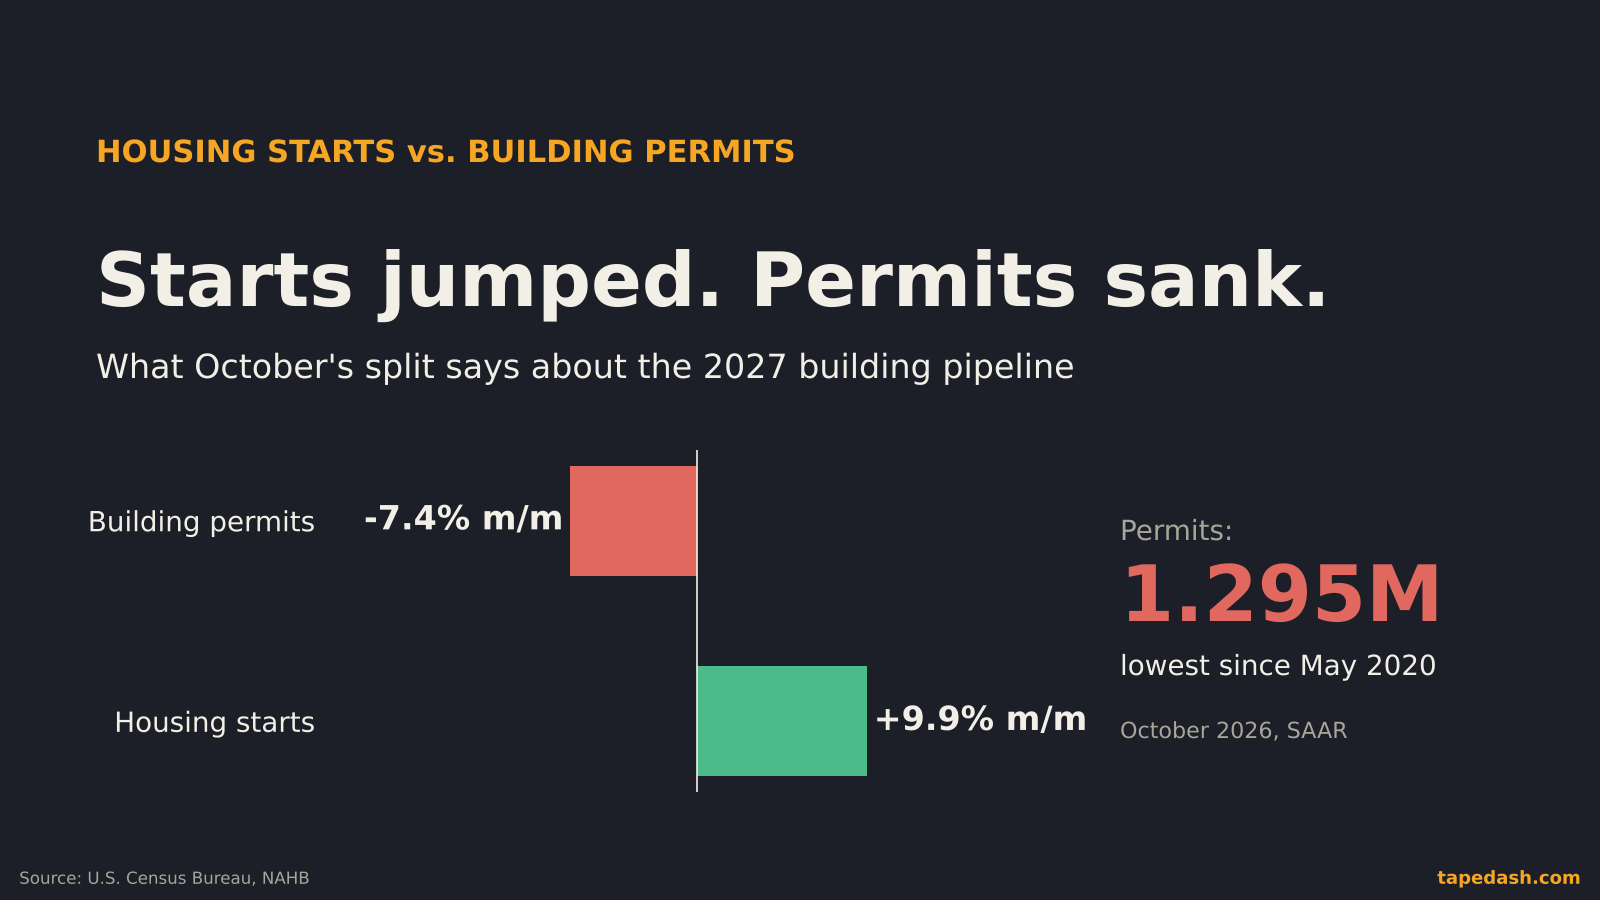
Housing starts jumped 9.9% in October to a seasonally adjusted annual rate of 1.309 million, the Census Bureau said Wednesday morning. On the same page, building permits fell 7.4% to 1.295 million, the lowest pace since May 2020 (Census Bureau, United States Real Estate Investor, Trading Economics). One number says builders got busier. The other says they are planning to get a lot less busy.
When the two disagree, I trust permits. A start means a foundation went in this month, often on a project that was approved months ago. A permit is a builder deciding, today, to spend money on a house or an apartment building that does not exist yet. October’s permit number is the more honest read on what builders think demand looks like next spring, and it is weak.
So what do October’s housing starts and building permits mean? The starts jump was mostly apartments and is within the margin of error. The permit drop was broad, led by single-family homes, and lines up with builder confidence at a 14-year low, mortgage rates above 7% and price cuts at a post-Covid high. Below is how I read each piece, what it means for homebuilders and the Fed, and the dates that will confirm or kill the story.
- October housing starts rose 9.9% to a 1.309 million annual rate, but the gain was led by 5+ unit apartment buildings (up 25.5%) and Census says the monthly change is not statistically significant.
- Building permits fell 7.4% to 1.295 million, the lowest since May 2020. Single-family permits dropped 8.7% to 772,000, down 12.9% from a year ago.
- Builder confidence (NAHB/Wells Fargo HMI) fell to 25 in November, the lowest since April 2012, with 46% of builders cutting prices and 68% using incentives.
- Mortgage demand is still falling: the MBA 30-year contract rate rose to 7.35% and purchase applications were 18% below a year ago.
- Watch October new home sales on Nov. 25, the Fed’s Dec. 8-9 meeting, and November starts and permits on Dec. 17.
October housing starts: what the 9.9% jump really was
The headline gain is real in the sense that it is what Census measured. It is less real in the sense that matters for a trader or anyone trying to read the economy.
Start with the mix. Single-family starts rose 4.0% from September to an 864,000 annual rate. Starts in buildings with five or more units jumped 25.5% to 433,000 (Census Bureau, WRE News). Apartment starts are lumpy by nature. A handful of large projects breaking ground in the same month can swing the national number by tens of thousands of units, and it says little about the month after.
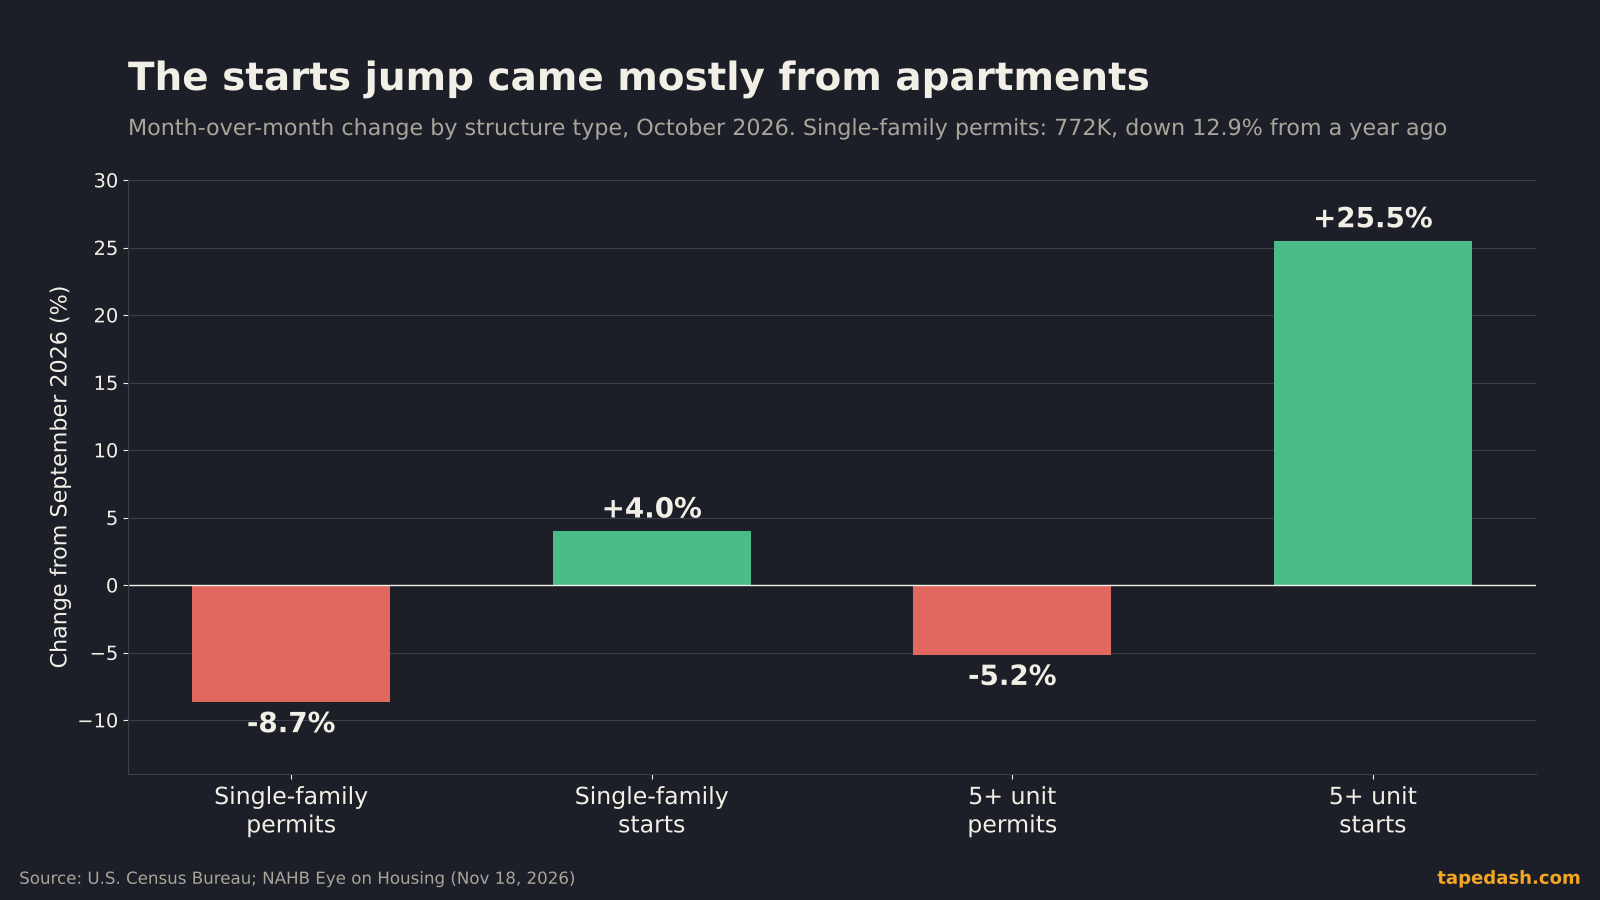
Then the error bars. Census publishes a 90% confidence interval with every number, and for October’s total starts the monthly change came with a range of roughly plus or minus 17 percentage points (WRE News, United States Real Estate Investor). In plain English, Census cannot say with confidence that starts rose at all. The single-family and apartment monthly changes were not statistically significant either (Census Bureau).
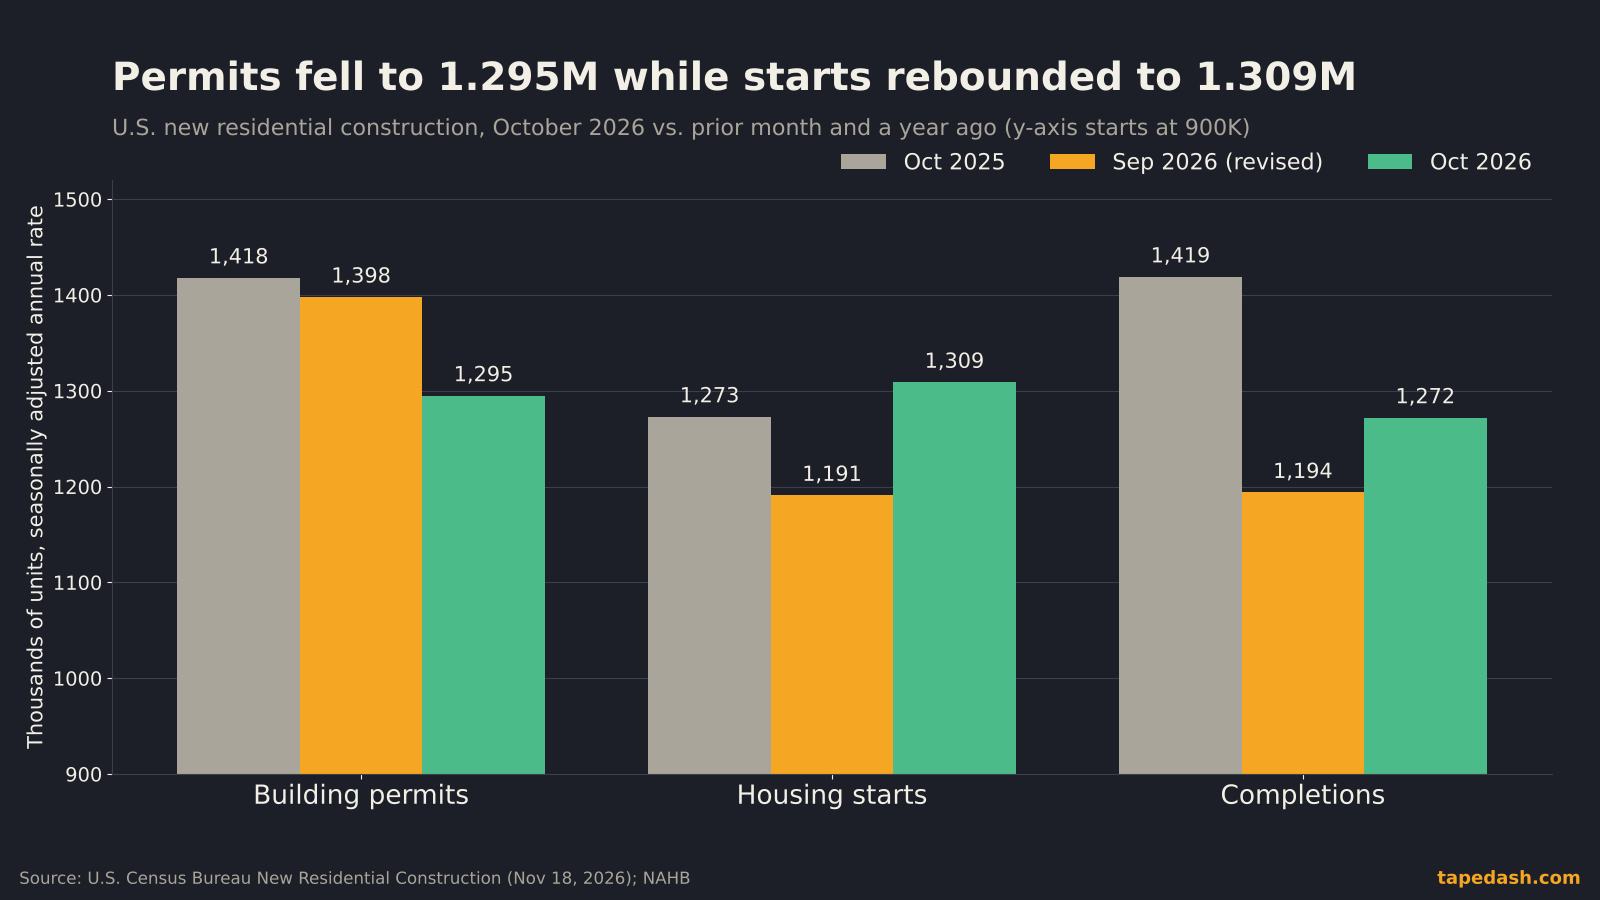
Third, the comparison base was soft. September starts were revised to 1.191 million, a low starting point that makes any normal month look like a rebound. Against October 2025, total starts were up only 2.8%, and single-family starts were down 3.2% (Census Bureau, NAHB Eye on Housing).
None of this means the report was fake good news. It means the starts line is telling you about decisions builders made earlier in the year, filtered through a noisy survey. For the forward view you need the permit line.
Why building permits fell to the lowest since 2020
Permits dropped 7.4% from September and 8.7% from a year earlier, to 1.295 million (Census Bureau, HousingWire). That is the lowest monthly pace since May 2020, when much of the country was in lockdown (Trading Economics, United States Real Estate Investor).
The single-family piece is the one I care about most. Single-family permits fell 8.7% in the month to a 772,000 rate and are down 12.9% from October 2025 (Census Bureau, NAHB Eye on Housing). Single-family homes are where the big public builders make their money, and they are far less lumpy than apartments. A double-digit yearly decline there is a decision, not a statistical accident.
What builders are reacting to
You do not need to guess why. The builders told us the day before. The NAHB/Wells Fargo Housing Market Index fell 4 points to 25 in November, its lowest reading since April 2012 (NAHB, HousingWire). Every component fell. Current sales conditions dropped to 28, expectations for the next six months to 30, and prospective buyer traffic to 16.
NAHB’s chief economist, Robert Dietz, put the cause in one line: “Mortgage rates above 7%, softer consumer confidence and an uncertain economic outlook are holding buyers back” (NAHB). NAHB’s write-up on the starts report also points to financing and material costs and ongoing labor shortages (NAHB Eye on Housing).
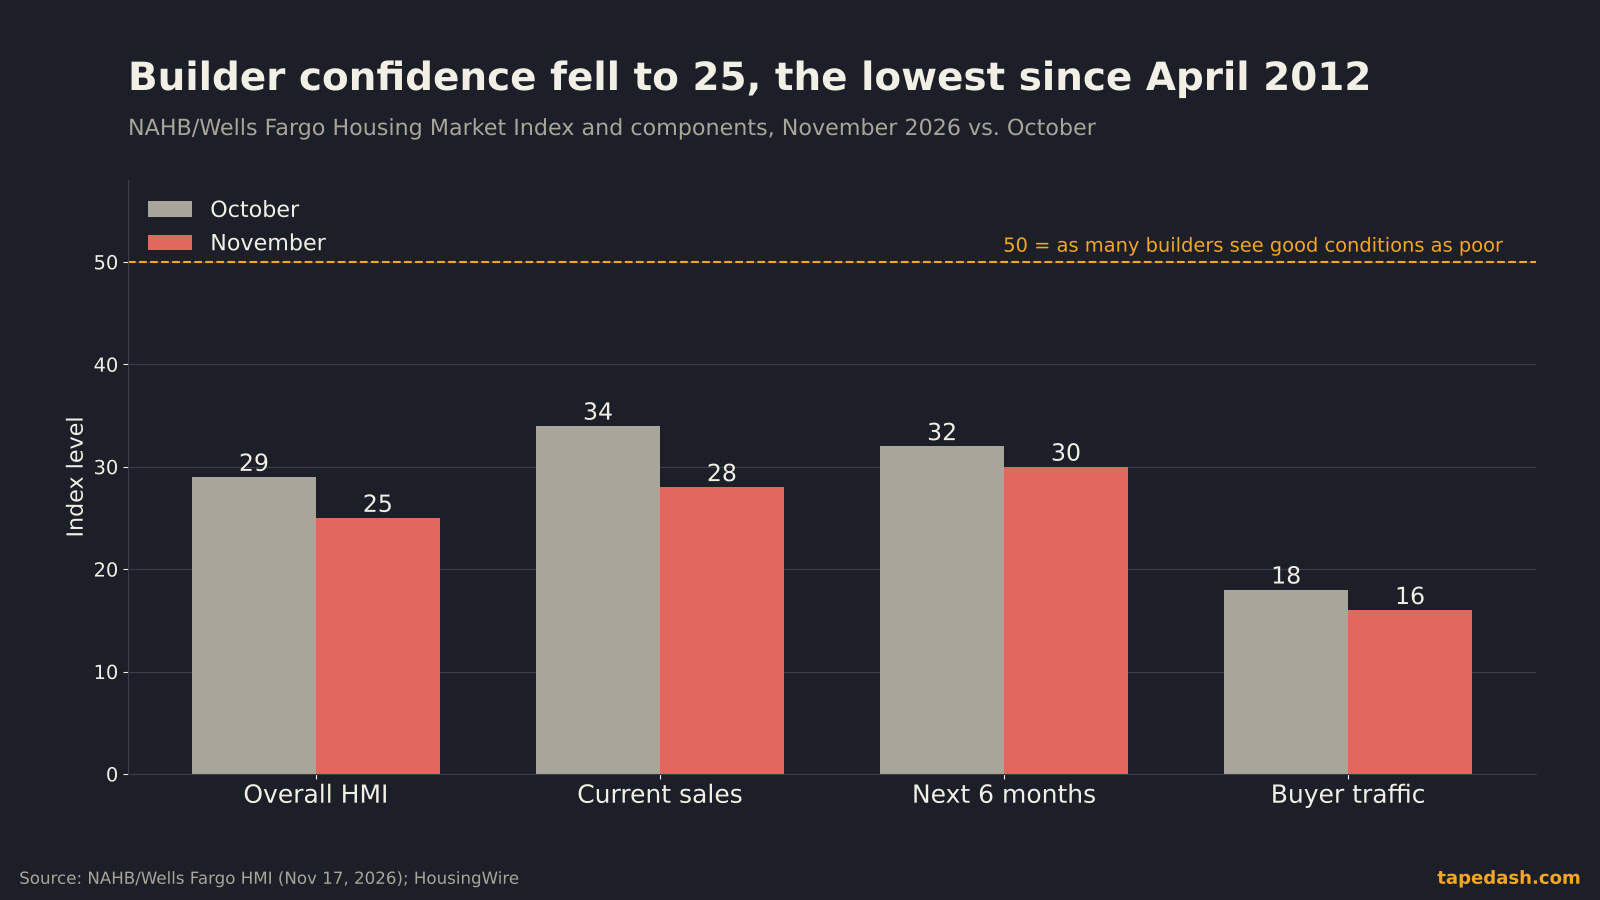
The buyer traffic number deserves a second look. A reading of 16 means only a small minority of builders describe traffic in their communities as high, and it is the weakest of the three components by a wide margin. If you run a homebuilder and the foot traffic in your sales offices is that thin, you do not pull new permits. You sell what you have.
How builders are holding up sales: price cuts and incentives
That is exactly what they are doing. In the November survey, 46% of builders said they cut prices, the highest share since Covid began. The average cut held at 6% for the eighth month in a row. And 68% used some kind of sales incentive, also a post-Covid high, with that share at 60% or more for 20 straight months (NAHB, HousingWire).
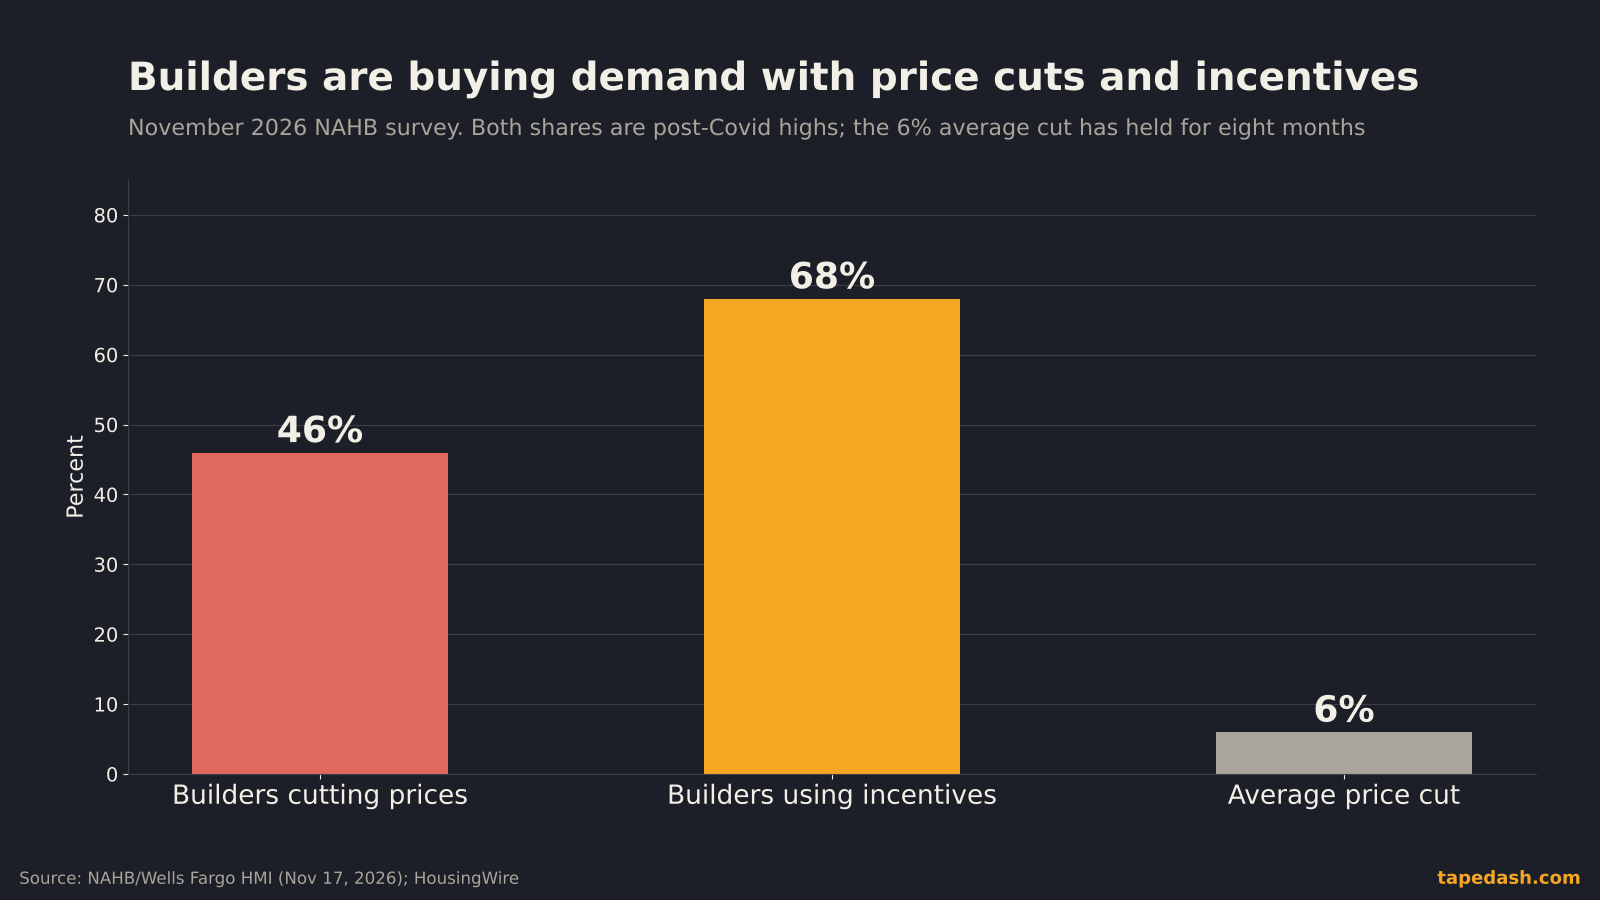
The most common incentive at the big builders is a mortgage rate buydown: the builder pays the lender up front so the buyer gets a lower rate for some or all of the loan. It works. It is also expensive, and it gets more expensive every time market rates rise, because the gap the builder has to cover gets wider. That is the link between the bond market and builder margins that I think a lot of people miss.
New home inventory shows why builders are leaning on this tool. September new home sales ran at a 676,000 annual pace, down 5.3% from a year earlier, with 8.4 months of supply and 111,000 completed homes sitting unsold (Census Bureau, Real Estate News). Finished homes that have not sold cost a builder money every month they sit. The rational response is to discount them and slow the start of new ones. October’s permits are that second half showing up in the data.
How mortgage rates connect to housing starts
Here is the chain in its simplest form. Treasury yields move, mortgage rates follow, buyer payments change, buyer traffic responds, builders adjust incentives and then permits, and starts follow a few weeks to a few months later. Completions and sales sit at the far end.
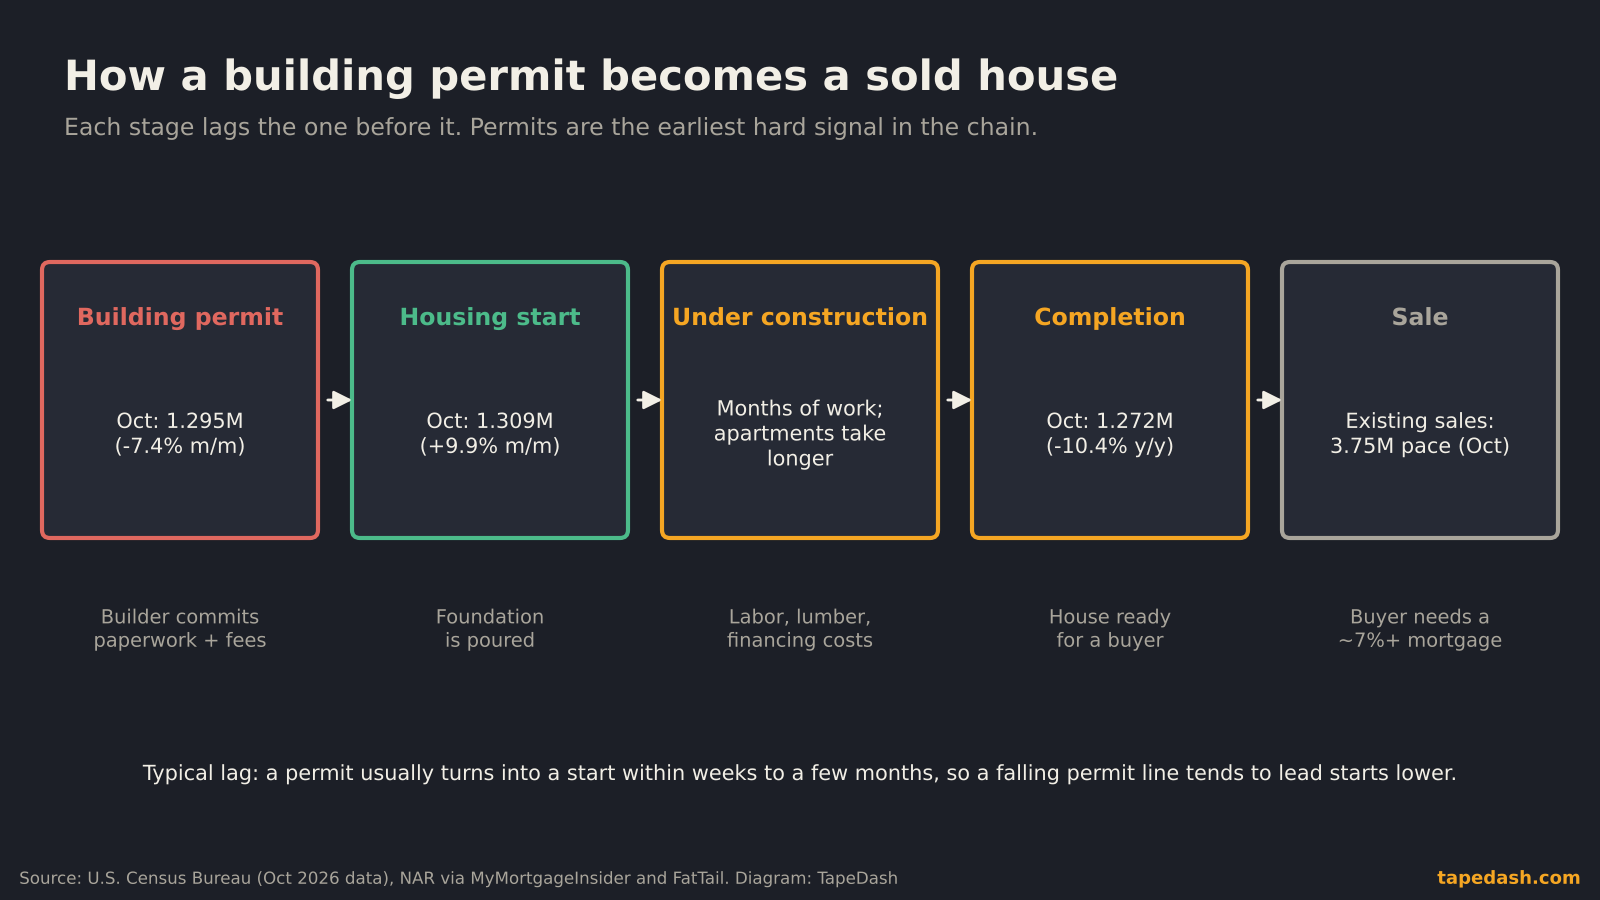
Right now the front of that chain is not helping. The Mortgage Bankers Association’s average 30-year contract rate rose to 7.35% in the week ended Nov. 13, from 7.21% the week before. Total applications fell 2.3%, purchase applications were 18% below the same week a year ago, and refinance applications were down 54% from a year ago (WRE News, Calculated Risk).
And the bond market is the reason rates are not coming down. The 10-year Treasury yield has been holding above 5% this week (24/7 Wall St., WRE News), and I covered why in what the hot CPI changed for the 10-year Treasury yield. Mortgage rates key off the 10-year plus a spread. With the 10-year where it is, a 30-year loan near 7% to 7.5% is roughly what you would expect.
The existing-home market confirms the buyer side of the story. Existing-home sales fell 5.5% in October to a 3.75 million annual pace, the slowest since August 2010, while inventory rose 4.6% from a year earlier to 1.59 million homes and months of supply climbed to 5.1 (MyMortgageInsider, FatTail). More resale homes on the market is more competition for builders, at the exact moment their own traffic is drying up.
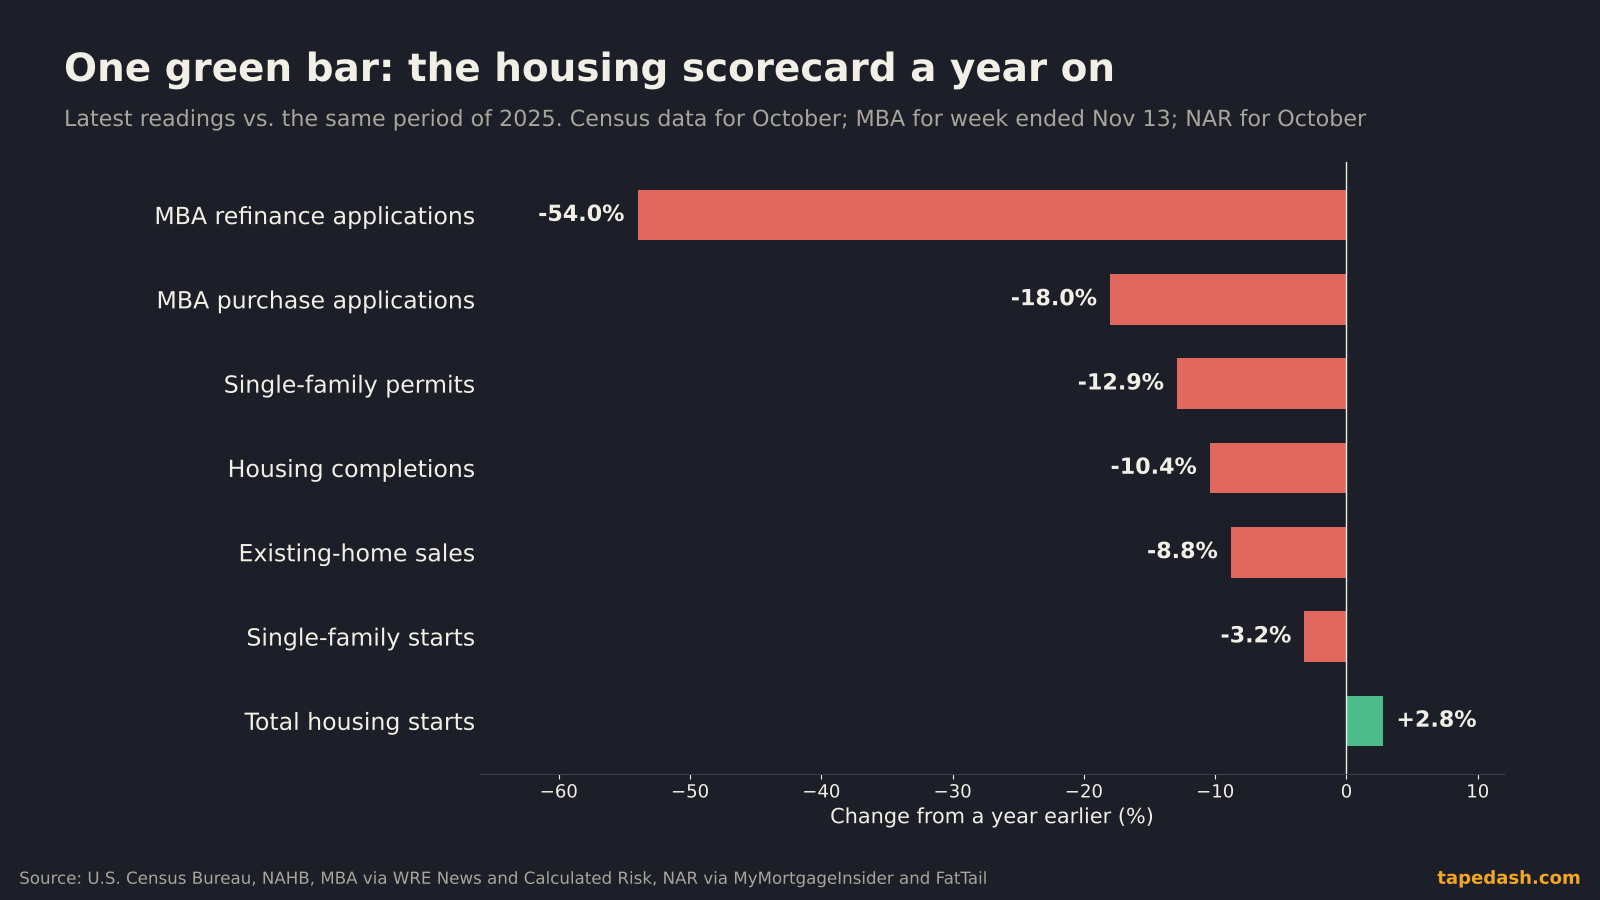
October housing data compared: a year ago, last month, now
| Measure (annual rate) | Oct 2025 | Sep 2026 | Oct 2026 | Change vs. a year ago |
|---|---|---|---|---|
| Total building permits | 1,418,000 | 1,398,000 | 1,295,000 | -8.7% |
| Single-family permits | 886,000 | 846,000 | 772,000 | -12.9% |
| Total housing starts | 1,273,000 | 1,191,000 | 1,309,000 | +2.8% |
| Single-family starts | 893,000 | 831,000 | 864,000 | -3.2% |
| 5+ unit starts | 355,000 | 345,000 | 433,000 | +22.0% |
| Total completions | 1,419,000 | 1,194,000 | 1,272,000 | -10.4% |
Source: Census Bureau, with single-family and total figures also reported by NAHB and United States Real Estate Investor.
How to read the housing starts report like a trader
I treat this report the way I treat the jobs report: the headline gets the first five minutes of trading, and the details decide the rest of the day. Here is the order I read it in.
Permits first, starts second
Permits lead starts, they are less noisy, and they reflect decisions being made now. If permits and starts disagree, the permit direction usually wins over the next few months.
Single-family before multifamily
Single-family is where the publicly traded homebuilders live and where mortgage rates bite hardest. Apartment starts depend on developer financing and can move 20% or more in a month on a few big projects. When I see a big total move, I check whether single-family moved with it.
Check the confidence interval
Census prints the margin of error next to every number. If the interval includes zero, the month’s change is not statistically significant. October’s starts jump was one of those. I would not build a view on it.
Read it next to the NAHB index and mortgage applications
The NAHB index comes out a day or two before starts and tells you how builders feel. MBA applications come out every Wednesday and tell you what buyers are doing. When all three point the same direction, as they do now, the signal is much stronger than any one alone.
Look at year-over-year, not just month-over-month
Monthly housing numbers get revised a lot. The September starts figure was revised this month. Year-over-year changes wash out some of that noise and show you the trend. On a yearly basis, single-family construction is shrinking.
What October’s housing data means for homebuilder stocks and the Fed
For homebuilders, the useful frame is volume versus margin. Falling permits mean lower volume next year. Price cuts and rate buydowns mean lower margin per house today. Builders can usually live with one of those for a while. Both at once is the harder setup. The scenarios I am working through:
If mortgage rates ease (because the 10-year pulls back from above 5%), the cost of buydowns falls, traffic can improve, and permits could stabilize by spring. In that case traders will watch whether builder guidance in December points to margins stabilizing.
If rates stay above 7%, the pattern from October likely continues: more incentives, fewer permits, and starts drifting toward the permit line. Builder earnings would then carry the margin pressure into early 2027.
If the Fed hikes and long rates rise further, the pressure on both volume and margin increases, and the housing data becomes part of the case for how much tightening the economy can absorb.
On the Fed, the policy rate is 3.75% to 4.00% after the October hold, and the next meeting is Dec. 8-9 (24/7 Wall St., FatTail). Futures markets treat a December hike as the strong base case, which I walked through in the October jobs report and Fed hike odds. Housing is the most rate-sensitive part of the economy, and it is clearly slowing. That will not stop a Fed focused on inflation, but it is the kind of data that shapes how many more hikes come after. If you want the mechanics of how those odds are priced, see how to read CME FedWatch and fed funds futures.
There is one more channel worth naming. Residential construction feeds jobs (framers, electricians, lumber yards) and spending on furniture and appliances. A falling permit line now tends to show up in those parts of the economy over the next few quarters. That is why I watch housing even on days I am not trading a single builder.
What to watch next for housing starts and permits
Nov. 25: October new home sales. Census releases the next report then (Census Bureau, Lumina Markets). The key line is months of supply, which sat at 8.4 in September. If supply rises while sales fall, expect more price cuts.
Every Wednesday: MBA mortgage applications. The purchase index is the most real-time read on buyer demand. A turn from minus 18% year over year toward flat would be the first sign the buyer side is healing.
Dec. 8-9: FOMC meeting. The statement is due Dec. 9 at 2:00 PM ET (FatTail, Fed Rate Calc). What matters for housing is less the hike itself and more what it does to the 10-year yield and the mortgage spread afterward.
Dec. 17: November housing starts and permits. That is the next Census construction release, at 8:30 AM ET (Census Bureau, Finance Calendar). If single-family permits fall again, the slowdown is confirmed. If they bounce while starts fade, October’s split was just a noisy month.
Mid-December NAHB index. Watch buyer traffic and the share of builders cutting prices. A rise in cuts above 46% would mean builders are still chasing demand rather than letting it come back.
How TapeDash tracks the housing and rates story
If you want to watch whether this housing slowdown spreads into the rest of the economy, this is what we track. Macro Pulse scores every major U.S. data release against its own recent trend and rolls them into two lines, Growth and Inflation. When housing, jobs and spending data start missing their trends together, the Growth line shows it before the headlines do. Macro & Regime sits next to it with the Treasury yield curve, credit spreads and sector rotation, which is where you see whether the 10-year (and with it, mortgage rates) is finally easing.
For the market side, ETF Flows shows where real money is moving between about 50 major funds, so you can spot a rotation out of rate-sensitive sectors early, and Large Prints shows big single-buyer options trades as they hit, including in the homebuilders after a report like this one. You can look at all of it in the Terminal Preview, or get the free TapeDash Daily for a morning rundown of the data calendar.
Housing starts and permits FAQ
Why did housing starts rise while building permits fell?
Starts reflect projects that were approved earlier and broke ground in October, and the jump was mostly large apartment buildings. Permits reflect new decisions, and those fell broadly. Census also said the monthly rise in starts was not statistically significant.
Are building permits a leading indicator?
Yes. A permit is usually issued before construction starts, so permit trends tend to lead starts by weeks to months. That is why economists and traders watch permits for the direction of housing activity.
What does a low NAHB housing market index mean?
The index runs from 0 to 100, and 50 means as many builders see conditions as good as see them as poor. A reading of 25 means most builders see poor conditions, which usually leads to fewer new projects and more discounts on existing ones.
The one thing to remember
October’s housing report had a good headline and a bad forecast. The starts jump was apartments and noise. The permit drop, the 14-year low in builder confidence and a post-Covid high in price cutting all point the same way: builders are getting ready for a slower 2027. Until mortgage rates come down from above 7%, the permit line is the one to believe.
See it on the tape, not just in the headlines
TapeDash is a market research and data analytics platform for traders and investors: live options flow, dealer positioning, a real-time market scanner, stock ratings, and macro and earnings data in one terminal. Memberships open Black Friday, November 27, and the first 200 members lock Pro at $69.99 a month on their account, even if they cancel and come back later.
Join the waitlistClick through the terminalSee the track recordSources
- U.S. Census Bureau: Monthly New Residential Construction, October 2026 (Nov 18, 2026)
- NAHB Eye on Housing: Single-Family Starts Post Modest Monthly Rebound Amid Challenging Conditions (Nov 18, 2026)
- United States Real Estate Investor: Housing Starts Rose 9.9% to 1.309 Million in October 2026, but Permits Fell to a May 2020 Low (Nov 18, 2026)
- WRE News: October Housing Permits Fall 7.4% Despite Starts Increase (Nov 18, 2026)
- Trading Economics: US Building Permits news stream (Nov 18, 2026)
- HousingWire: Housing permits fall to COVID-era lows as mortgage rates top 7% (Nov 18, 2026)
- NAHB: Builder Sentiment Continues to Fall on Affordability Concerns (Nov 17, 2026)
- HousingWire: Homebuilder confidence sinks to a 14-year low as buyers hibernate (Nov 17, 2026)
- WRE News: Mortgage Applications Fall 2.3% as 30-Year Contract Rate Climbs to 7.35% (Nov 18, 2026)
- Calculated Risk: Misc Data: Mortgage Applications Weak, Inventory Up, NAHB Builder Confidence Plunges (Nov 18, 2026)
- MyMortgageInsider: Existing-Home Sales, October 2026: Lowest Pace Since 2010 (Nov 12, 2026)
- FatTail: October Existing-Home Sales 2026: 3.75M, Lowest Since 2010 (Nov 12, 2026)
- U.S. Census Bureau: Monthly New Residential Sales, September 2026 (Oct 27, 2026)
- Real Estate News: New home sales slowed in September but still beat forecasts (Oct 27, 2026)
- 24/7 Wall St.: Traders Now See a 95% Chance the Fed Hikes Rates in December (Nov 18, 2026)
- FatTail: December Fed Meeting 2026: Odds, SEP Day and the Data Path
- Fed Rate Calc: FOMC meeting schedule, December 2026
- Finance Calendar: US New Residential Construction (Housing Starts), December 17, 2026 release
- Lumina Markets: US New Home Sales in October 2026 (release Nov 25, 2026)
This article is for educational and informational purposes only. It is not financial, investment, medical or legal advice, and it is not a recommendation to buy or sell any security. Figures come from the sources listed and were checked on the date of publication; markets change quickly. Options trading involves substantial risk of loss.