Amazon and Microsoft Earnings: Why AWS and Azure Got Different Verdicts
Amazon and Microsoft earnings explained: Azure grew 48% and AWS 39%, yet the stocks split. What the numbers said about cloud growth, AI spending and cash flow.
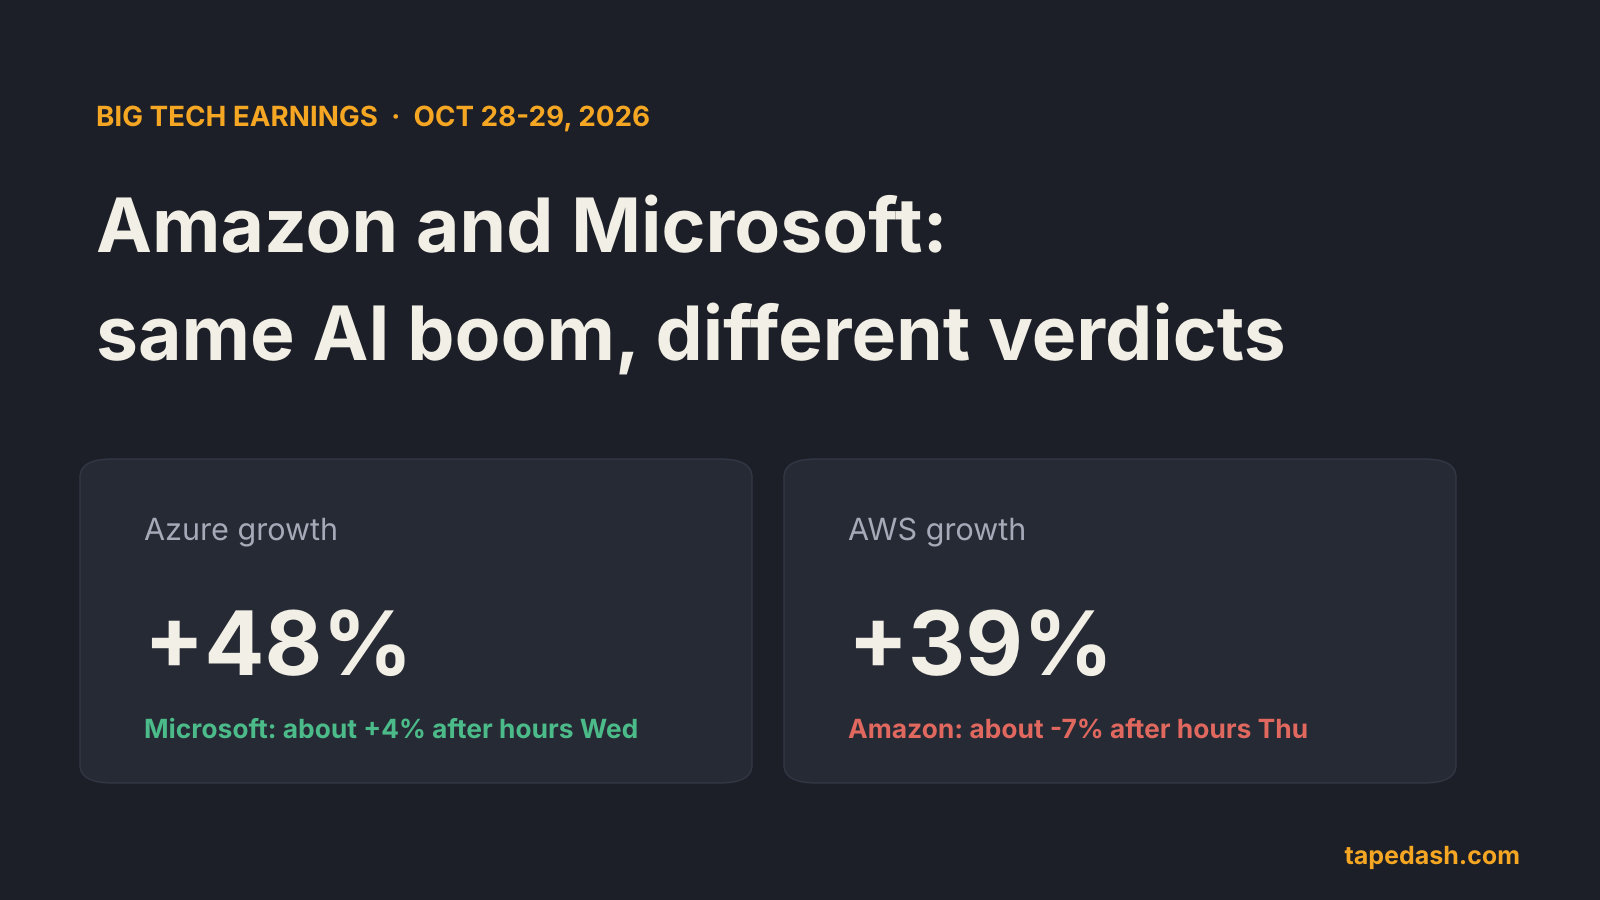
Amazon and Microsoft both reported this week that their cloud businesses are speeding up, and the market still handed them opposite verdicts. Microsoft’s Azure grew 48% in the July to September quarter and the stock rose about 4% after hours on Wednesday. Amazon’s AWS grew 39%, its fastest pace in nearly five years, and the stock was down about 7% after hours on Thursday, on top of a 4.25% drop in the regular session before the report.
The short answer to why: investors are no longer paying for cloud growth alone. They are paying for cloud growth relative to what it costs. Microsoft beat on revenue and profit, spent less than analysts expected, and guided Azure even faster. Amazon missed slightly on revenue and earnings per share, and its free cash flow over the last twelve months has swung deep into negative territory as it builds data centers. Same AI boom, very different math.
This piece walks through both reports, what the reactions tell you about how the market is grading big tech right now, and how to read the next round of these numbers yourself.
- Azure grew 48% and Microsoft guided 49% to 50% for the December quarter, ahead of the roughly 45% Wall Street expected.
- AWS grew 39% to $46.0 billion, up from 37% the quarter before, but Amazon missed slightly on revenue and earnings per share.
- Amazon’s free cash flow over the last twelve months was negative $42.4 billion, versus positive $14.8 billion a year earlier. That is the number the market fixed on.
- Microsoft’s quarterly capital spending of $45.2 billion, including finance leases, came in below the roughly $50.7 billion analysts had projected.
- The lesson: in this phase of the AI build-out, the market rewards growth that arrives with spending discipline and punishes growth that arrives with a cash drain.
Microsoft earnings: what Azure’s 48% actually told us
Microsoft’s fiscal first quarter of 2027 covered July through September. Revenue was $92.3 billion, up 19% from a year earlier, against a Wall Street estimate of roughly $90.7 billion. Adjusted earnings per share came in at $4.89 versus about $4.73 expected. Those are clean beats, but they were not the headline.
The headline was Azure. Microsoft’s cloud platform grew 48%, and the company told investors to expect 49% to 50% growth in constant currency for the October to December quarter. The consensus had been around 45%. When a business the size of Azure guides above the street and accelerates at the same time, it is telling you demand is still running ahead of the capacity it can build.
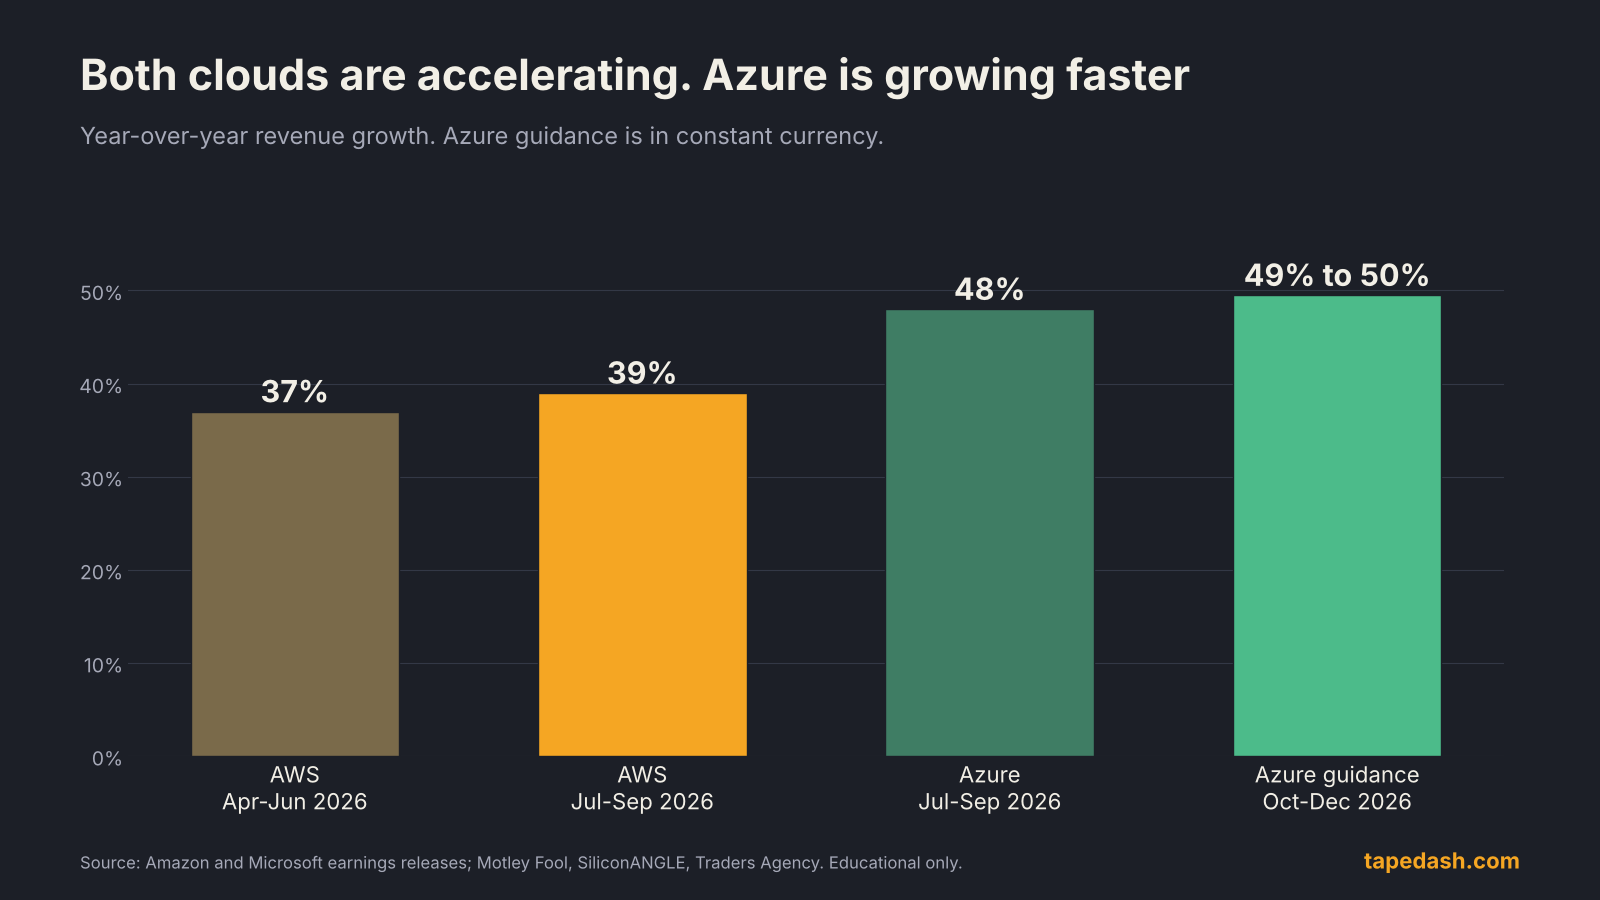
Both clouds sped up this quarter. Azure is growing from a smaller base, and Microsoft guided it higher again.
The backlog number most people skipped
Microsoft also reported commercial remaining performance obligation of $677 billion, up 73%. In plain terms, that is revenue customers have already contracted for but Microsoft has not yet recognized. It is the closest thing a software company has to an order book. When it grows faster than revenue, future revenue is effectively pre-sold, which is a big part of why investors were comfortable with the spending.
Microsoft Cloud as a whole brought in $63.9 billion, up 30%. Not every line was strong: the newly renamed Devices and Consumer segment fell 3%. Nobody traded the stock on that. The market looks at where the growth and the margins are, and for Microsoft both sit in the cloud.
Why spending less than expected mattered
Capital expenditures including finance leases were $45.2 billion for the quarter. That is a staggering number in isolation, but analysts had projected as much as about $50.7 billion. Microsoft also trimmed its full-year spending plan to about $170 billion from $175 billion. So the company grew faster than expected while spending less than expected. That is the combination investors want right now, and it is why the stock rose about 4% after hours.
It did not hold. Microsoft closed Thursday’s session slightly lower (down 0.16% on CNBC’s closing quote), which is worth noticing. When a strong report fades the next day, it usually means the good news was already partly in the price, or that the wider tech tape is pulling everything down. On Thursday it was mostly the second: the Nasdaq 100 fell about 1.4% while the equal-weight S&P 500 rose about 1.2%.
Amazon earnings: AWS accelerated, cash flow did not
Amazon’s third quarter looked like this. Net sales were $201.9 billion, up 12%, a hair under the $202.2 billion analysts expected. Earnings per share were $1.89 against estimates of about $1.96 to $1.97. Operating income jumped about 61% to $28.1 billion, so the business itself is far from struggling.
AWS was the bright spot. Revenue reached $46.0 billion, up 39%, accelerating from 37% in the April to June quarter. That is the fastest AWS growth in nearly five years. If you had been told only that one number before the report, you would probably have guessed the stock would rise.
The cash flow swing
The problem sat in the cash flow statement. Amazon’s free cash flow over the trailing twelve months was negative $42.4 billion. A year earlier it was positive $14.8 billion. That is a swing of more than $57 billion, and nearly all of it is data center construction: servers, chips, buildings and power. Amazon has said it plans to spend roughly $220 billion on capital projects this year.
For context, here is how the two reports stack up side by side.
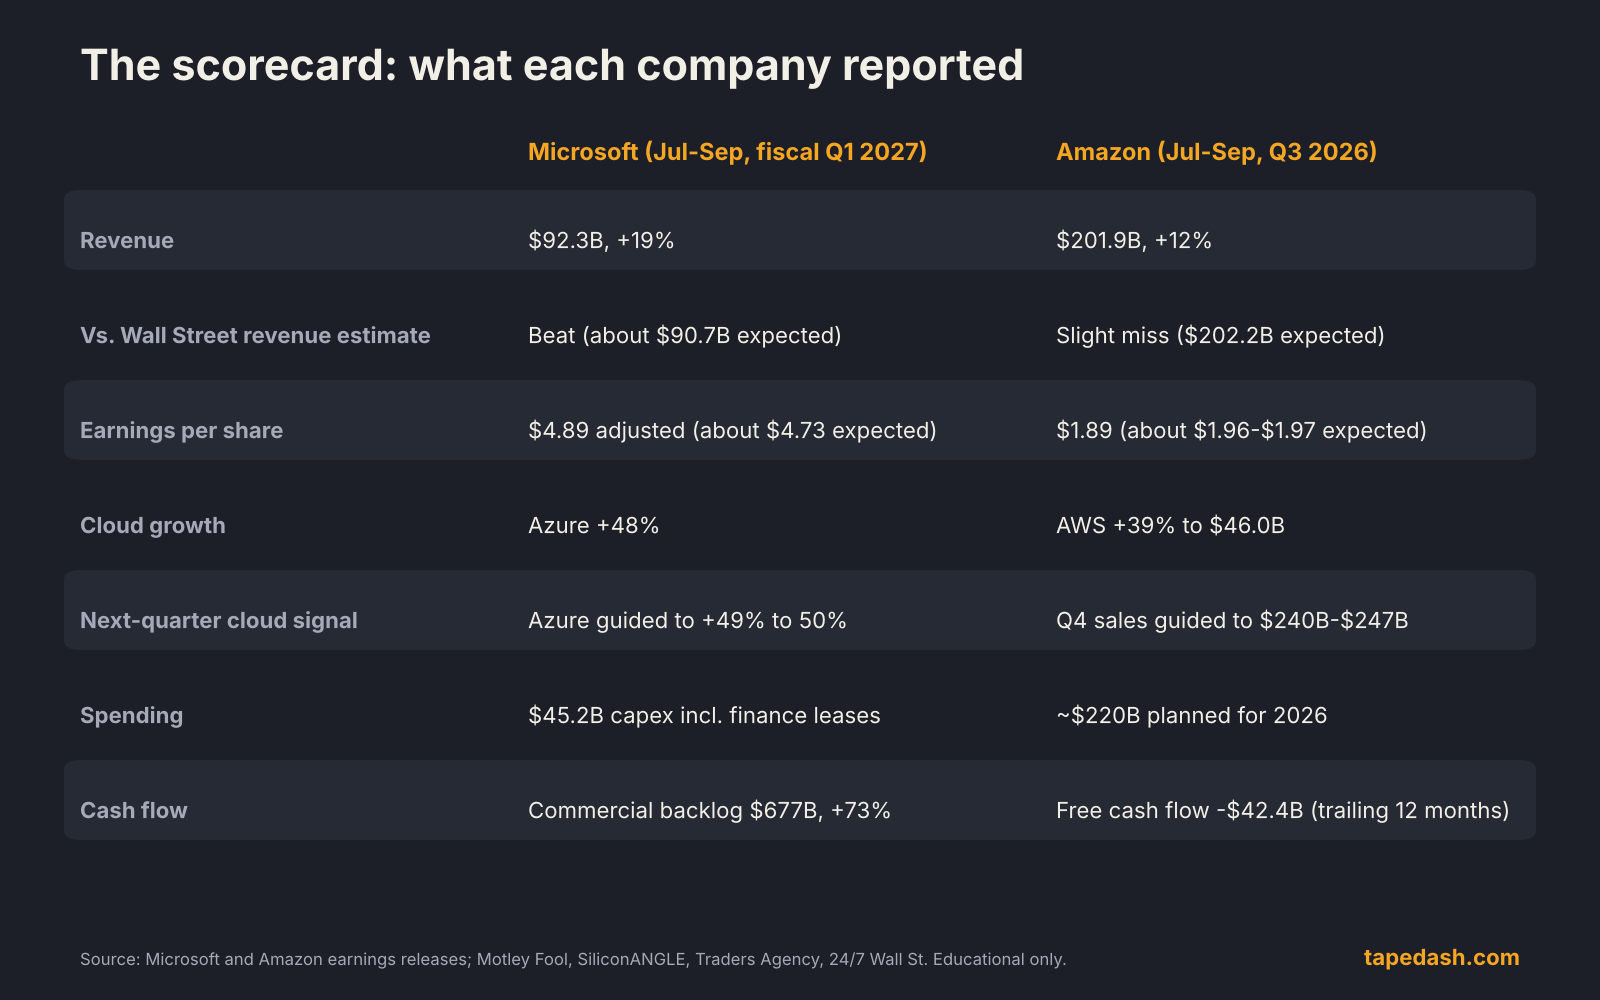
Microsoft beat and spent less than expected. Amazon accelerated in the cloud but missed slightly and is burning cash to build.
| Metric | Microsoft (Jul to Sep) | Amazon (Jul to Sep) |
|---|---|---|
| Revenue | $92.3 billion, up 19% | $201.9 billion, up 12% |
| Versus revenue estimate | Beat (about $90.7 billion expected) | Slight miss ($202.2 billion expected) |
| Earnings per share | $4.89 adjusted (about $4.73 expected) | $1.89 (about $1.96 to $1.97 expected) |
| Cloud growth | Azure up 48% | AWS up 39%, to $46.0 billion |
| Next-quarter signal | Azure guided to 49% to 50% | Q4 sales guided to $240 to $247 billion |
| Spending | $45.2 billion capex incl. finance leases | About $220 billion planned for 2026 |
| Cash picture | $677 billion commercial backlog, up 73% | Trailing free cash flow of negative $42.4 billion |
Guidance did not rescue it
Amazon guided fourth-quarter net sales to $240 billion to $247 billion, growth of 12% to 16%. That was roughly in line with what analysts expected. In a quarter where the stock needed a reason to look past the cash burn, an in-line holiday guide did not provide one. The company also said it expects advertising growth to return to the high teens in the fourth quarter, which is constructive but not a headline mover.
By about 8 PM ET Thursday, Amazon traded around $226 in after-hours trading, roughly 7.3% below its regular-session close of $243.79, according to both TapeDash data and CNBC.
Why the market punished Amazon and rewarded Microsoft
Strip it down and the difference is sequencing. Every big cloud company is spending enormous sums to build AI capacity. The question investors are asking each quarter is whether the revenue shows up fast enough to justify the spending, and whether the company can prove it.
Microsoft could show three things at once: faster growth, a giant contracted backlog, and spending that came in under forecast. Amazon could show faster growth, but its cash flow tells you the bill is arriving well before the revenue. That is not a sign the strategy is wrong. It is a sign the market wants to see payback before it gives credit.
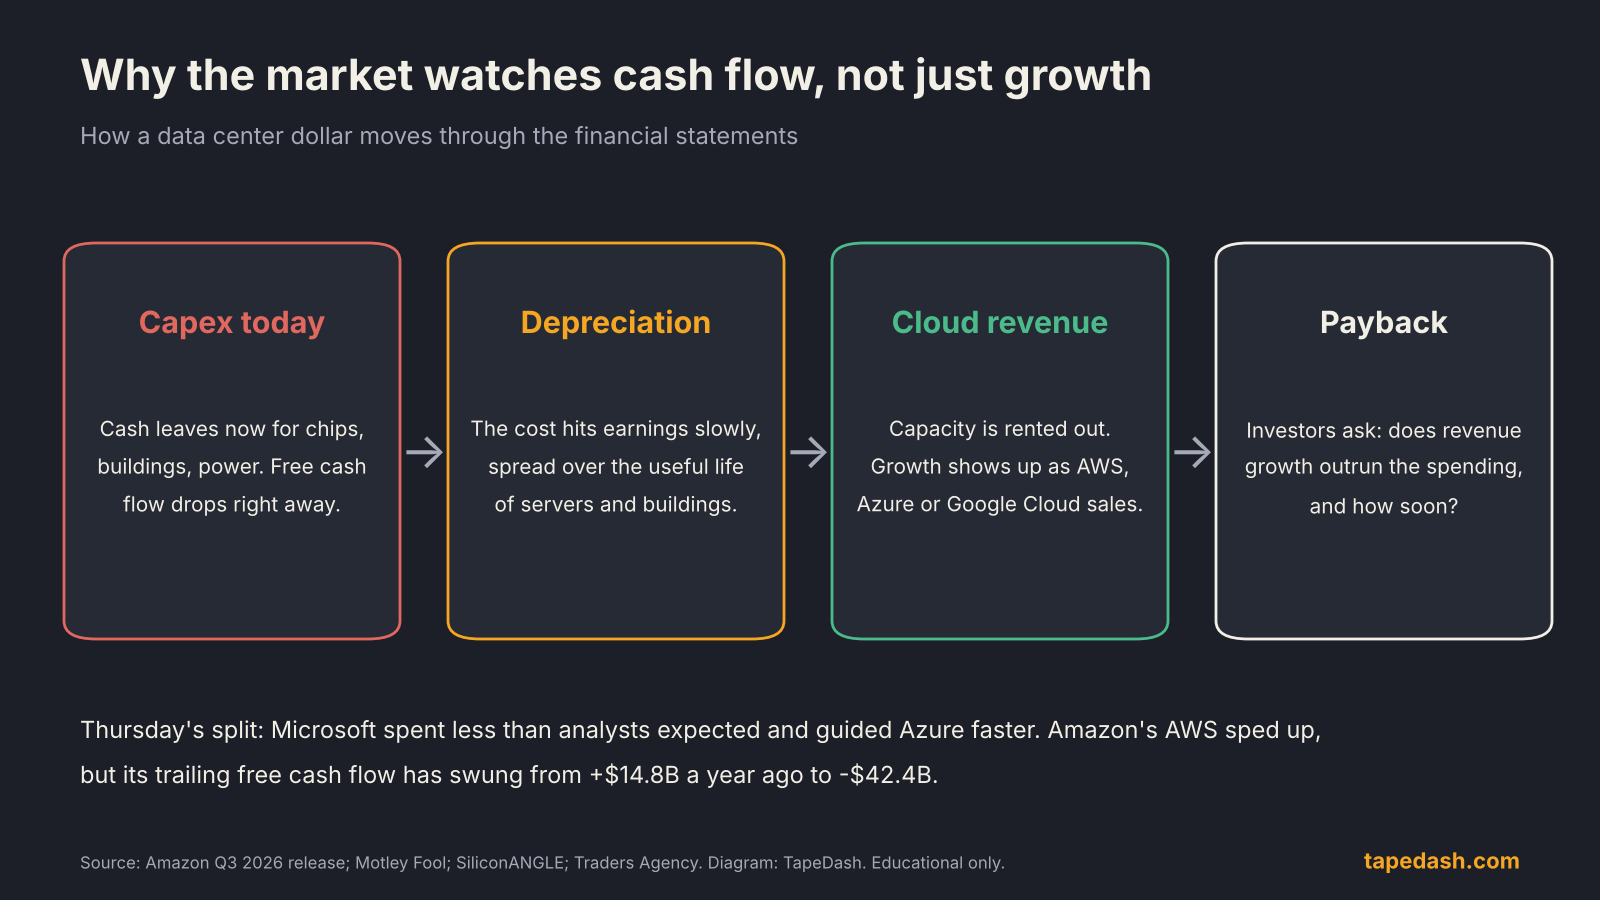
Capex leaves as cash today, hits earnings slowly through depreciation, and only later shows up as cloud revenue. Investors are grading how long that gap lasts.
Where Alphabet fits
Alphabet reported the same evening as Microsoft and fell 12.64% in Thursday’s session, according to CNBC’s closing quote (TapeDash data showed nearly 13%). Its cloud business grew strongly too. The reaction rhymed with Amazon’s rather than Microsoft’s: heavy spending, with cash flow under pressure. Three companies, the same AI theme, and the market sorted them almost entirely by how much cash the build-out is costing them right now. If you want the supply-chain side of that spending, our piece on how AI capex reaches chip stocks follows the dollars into GPUs, memory and power.
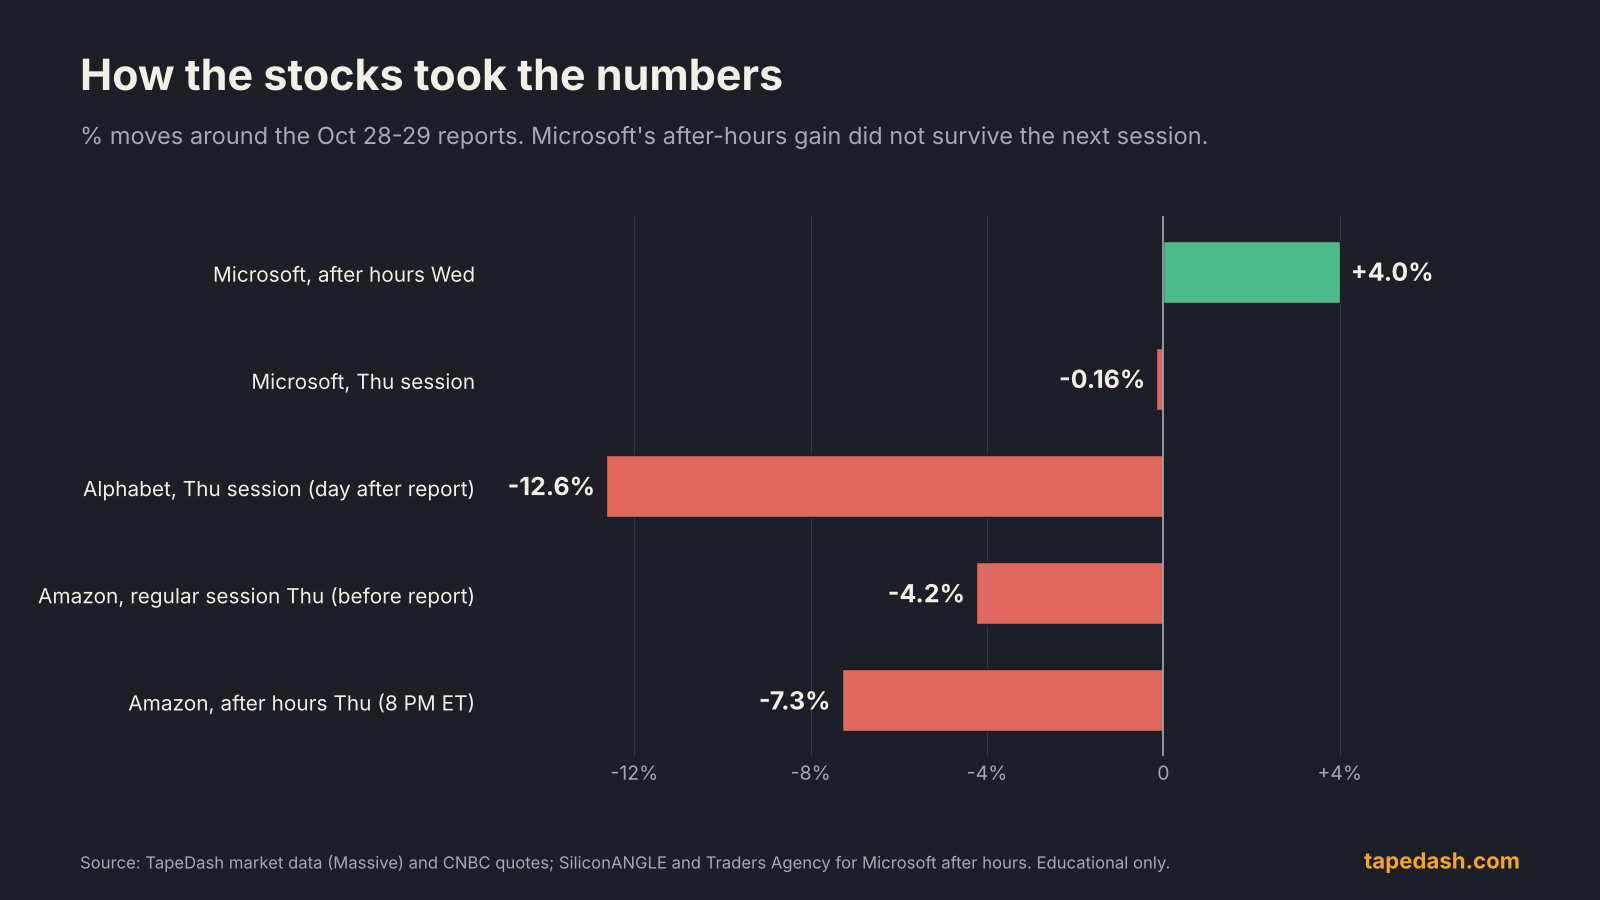
Microsoft’s after-hours pop faded Thursday. Alphabet and Amazon were punished hardest, and both carry the heaviest cash drain from spending.
How to read a big tech earnings report yourself
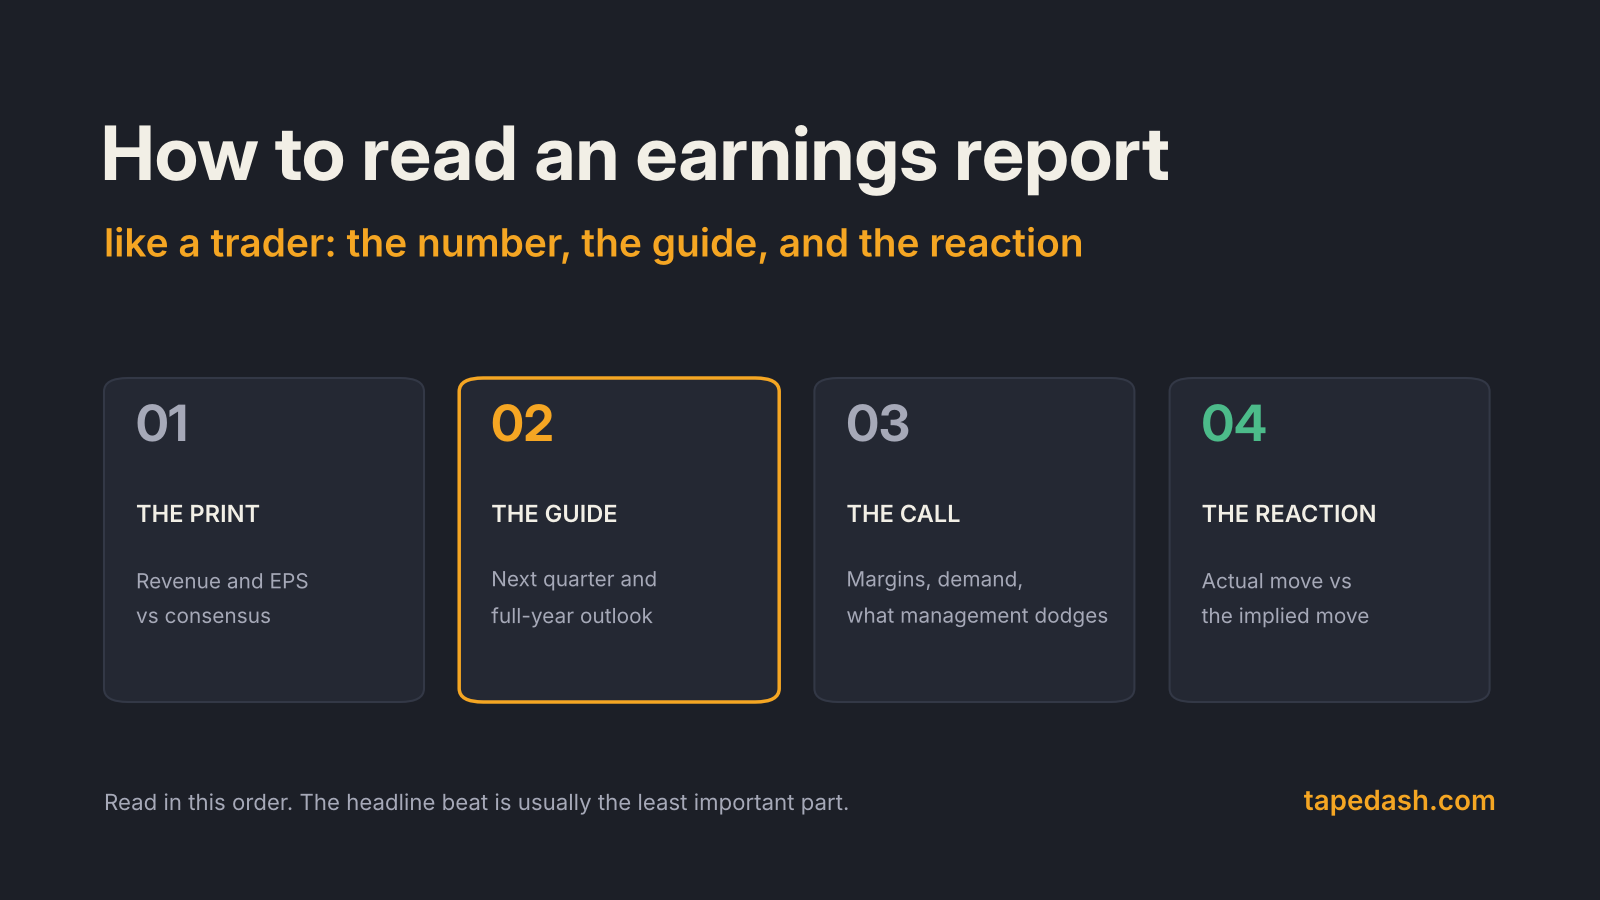
When I look at a mega-cap report, I don’t start with earnings per share. For these companies EPS is a noisy number, moved by tax rates, investment gains and one-time items. Amazon’s net income actually slipped from a year earlier this quarter, even as its operating income jumped about 61%. Here is the order I read in, and it is the order the market reacted in this week.
1. The growth engine and its direction
Find the segment that drives the valuation (AWS, Azure, Google Cloud) and look at two things: the growth rate, and whether it is speeding up or slowing down versus last quarter. Acceleration matters more than the level. AWS going from 37% to 39% counts, and so does Azure guiding its next quarter above the one it just reported.
2. The forward signal
Guidance and backlog tell you whether the acceleration continues. Microsoft gave both: an Azure guide above consensus and a backlog growing 73%. Amazon’s guide was in line. When the forward signal is merely fine, the stock trades on whatever else stands out.
3. The cost of the growth
Look at capital spending against what analysts projected, and look at free cash flow (operating cash flow minus capital spending). This is the line that separated the winners from the losers this week. Spending under forecast with growth above forecast is the best case. Spending at record highs with cash flow turning negative is where the market gets nervous, even if growth is strong.
4. The reaction itself
The after-hours move is a first draft. The next regular session is the edit. Microsoft’s 4% after-hours gain shrank to a small loss on Thursday because the broader tech tape sold off. Reading both tells you whether the report changed the story or just bounced around inside it. If you trade options around these reports, our explainer on IV crush after earnings covers why the option price can fall even when you get the direction right.
The common mistake: trading the headline number
The most common error I see is reacting to the headline growth rate in isolation. “AWS grew 39%, fastest in five years” sounds like a buy signal. It was not, at least not on Thursday night. The market had already priced a strong AWS number. What it had not priced was how large the cash outflow had become.
The second mistake is assuming the after-hours move is final. Microsoft showed the opposite this week. Wednesday’s after-hours gain looked like a clean win, and by Thursday’s close it was gone, mostly because the Nasdaq 100 had a rough day. A report can be good and the stock can still go down when the whole group is being sold.
What to watch next
The next dates that matter for this theme:
- Friday, November 6: the October jobs report. A strong labor market keeps yields elevated, which tends to weigh hardest on the long-duration growth stocks that dominate the Nasdaq 100.
- The October to December quarter: Microsoft has put a marker down at 49% to 50% Azure growth. The next report will show whether the acceleration held. Amazon has guided $240 billion to $247 billion in sales and high-teens advertising growth.
- Capex updates at upcoming conferences: any change to Amazon’s roughly $220 billion plan or Microsoft’s roughly $170 billion plan will move these stocks, and the chip suppliers behind them, more than most product news.
The scenario worth framing: if Amazon’s cloud growth keeps accelerating while spending plateaus, the cash flow gap starts to close, and that is the kind of change the market tends to reward quickly. If spending keeps climbing faster than AWS revenue, the pressure on the stock is likely to persist even with strong growth.
How to track this on TapeDash
If you want to watch whether this split between the spenders and the disciplined continues, these are the things we track every day. The Live Scanner shows which mega-caps are leading or lagging the tape in real time, and the earnings calendar in the Terminal Preview shows the implied move for each report, so you can see how much the options market expects before the numbers land.
On the flow side, TapeDash Signals and Large Prints show when big money is positioning in names like Amazon, Microsoft and Alphabet around these reports, and every trade alert we publish is graded in public on the track record, wins and losses alike. The free TapeDash Daily recaps stories like this one each weekday evening. Memberships are opening soon, and the first 200 members lock Pro at $69.99 a month on their account, even if they cancel and come back later.
FAQ
Why did Amazon stock fall if AWS grew 39%?
Investors had largely expected strong cloud growth. The reaction centered on a slight miss on revenue and earnings per share, an in-line holiday guide, and trailing free cash flow of negative $42.4 billion as data center spending outran the cash the business brings in.
Why did Microsoft stock rise after earnings?
Microsoft beat on revenue and earnings, Azure grew 48%, guidance called for 49% to 50% Azure growth next quarter, and capital spending came in below what analysts projected. The after-hours gain of about 4% faded in Thursday’s session as tech stocks broadly sold off.
What is free cash flow and why does it matter for big tech?
Free cash flow is the cash a company generates from operations minus what it spends on capital projects like data centers. In an AI build-out, it shows how much of the investment is being paid for today versus promised back later, which is why the market is watching it so closely this earnings season.
The one idea to keep
This earnings week was not a referendum on whether AI demand is real. Both AWS and Azure answered that. It was a test of who can show the payback on the spending, and the market paid for proof over promise.
See it on the tape, not just in the headlines
TapeDash is the research desk for traders and investors: live options flow, dealer positioning, a real-time market scanner and trade alerts graded in public. Memberships open January 1, 2027, and the first 200 members lock Pro at $69.99 a month on their account, even if they cancel and come back later.
Join the waitlistClick through the terminalSee the track recordSources
- Microsoft: Microsoft announces first quarter results (fiscal 2027)
- SiliconANGLE: Microsoft's stock rises on solid earnings and revenue beat, with Azure growing 48%
- Traders Agency: Microsoft beats estimates as Azure grows 48%; capex trails projections
- 24/7 Wall St.: Microsoft Q1 2027 earnings
- BigGo Finance: Microsoft Q1 2027 earnings call
- Amazon: Amazon.com announces third quarter results
- Amazon: Amazon.com announces second quarter results (Nasdaq)
- Motley Fool: Stock market today, Oct. 29: Amazon falls on Q3 earnings report and capex concerns
- Motley Fool: AWS jumps 39% as Amazon's cash flow sinks
- 24/7 Wall St.: Amazon Q3 2026 earnings
- CNBC: Microsoft, Amazon and Alphabet quotes
- Finance Calendar: US employment situation, November 2026
- Thrive Markets: Next NFP release date
This article is for educational and informational purposes only. It is not financial, investment, medical or legal advice, and it is not a recommendation to buy or sell any security. Figures come from the sources listed and were checked on the date of publication; markets change quickly. Options trading involves substantial risk of loss.