The TapeDash Blog
What is moving markets and the economy right now, explained in depth: stocks and options, technology, healthcare and biotech, energy and the world economy. A new long read every evening from the TapeDash desk.
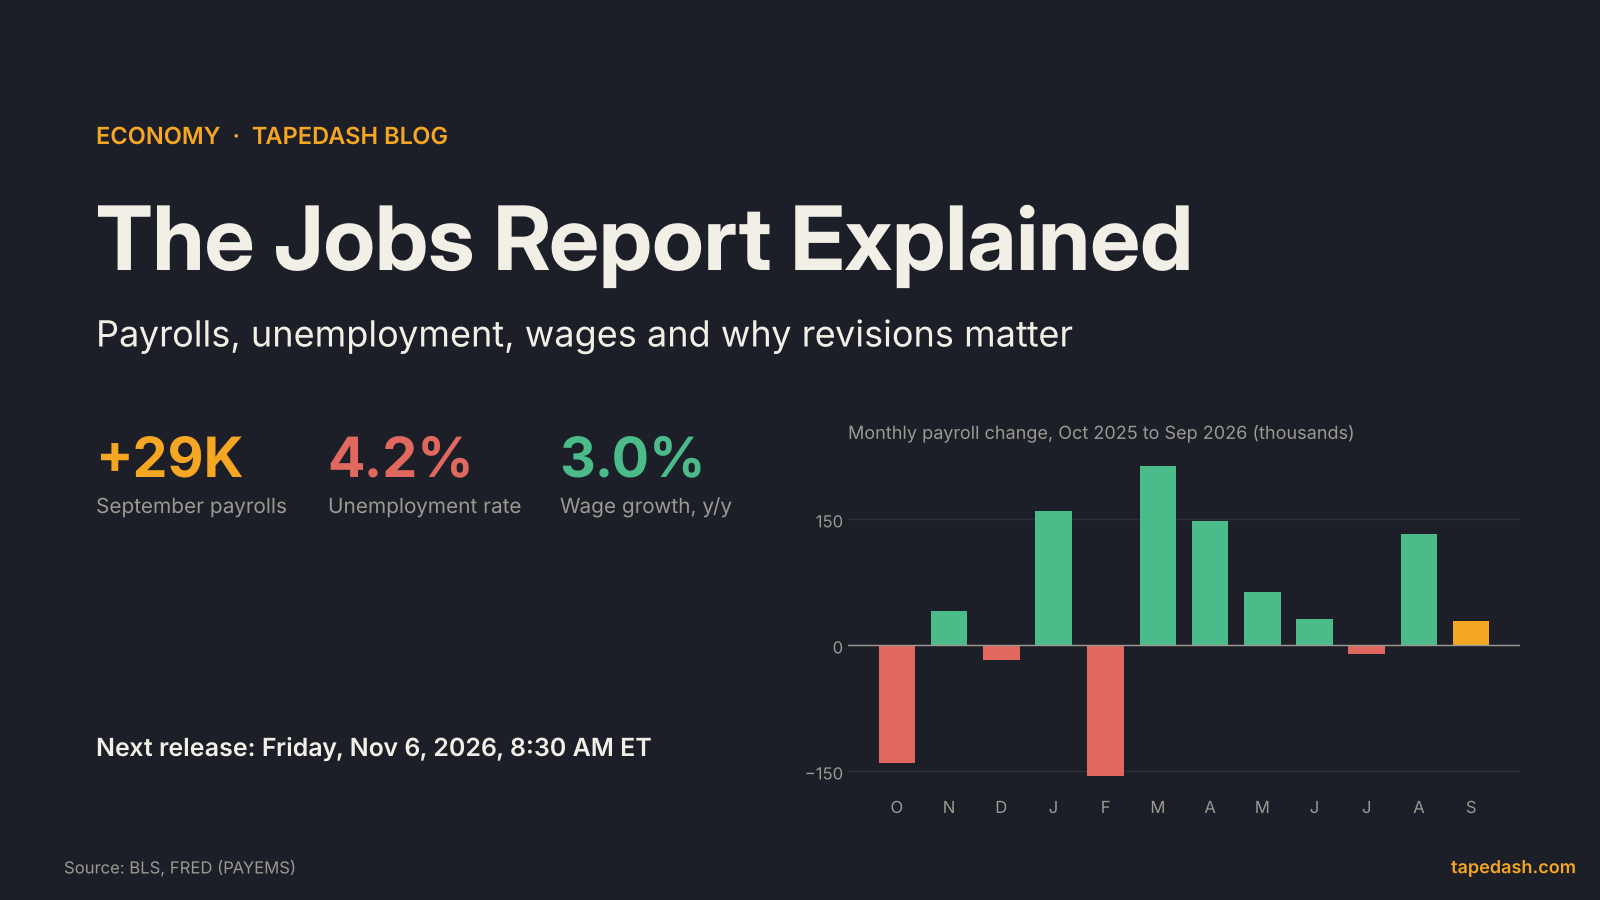
The Jobs Report Explained: Payrolls, Unemployment and Wages
The jobs report explained in plain English: nonfarm payrolls, the unemployment rate, U-6, wages, revisions and how markets react on release day.

The Yen Carry Trade Explained: Why Japan Can Shake Global Markets
The yen carry trade explained: how cheap yen funds global bets, why the August 2024 unwind hit every market, and what the Bank of Japan means for it now.
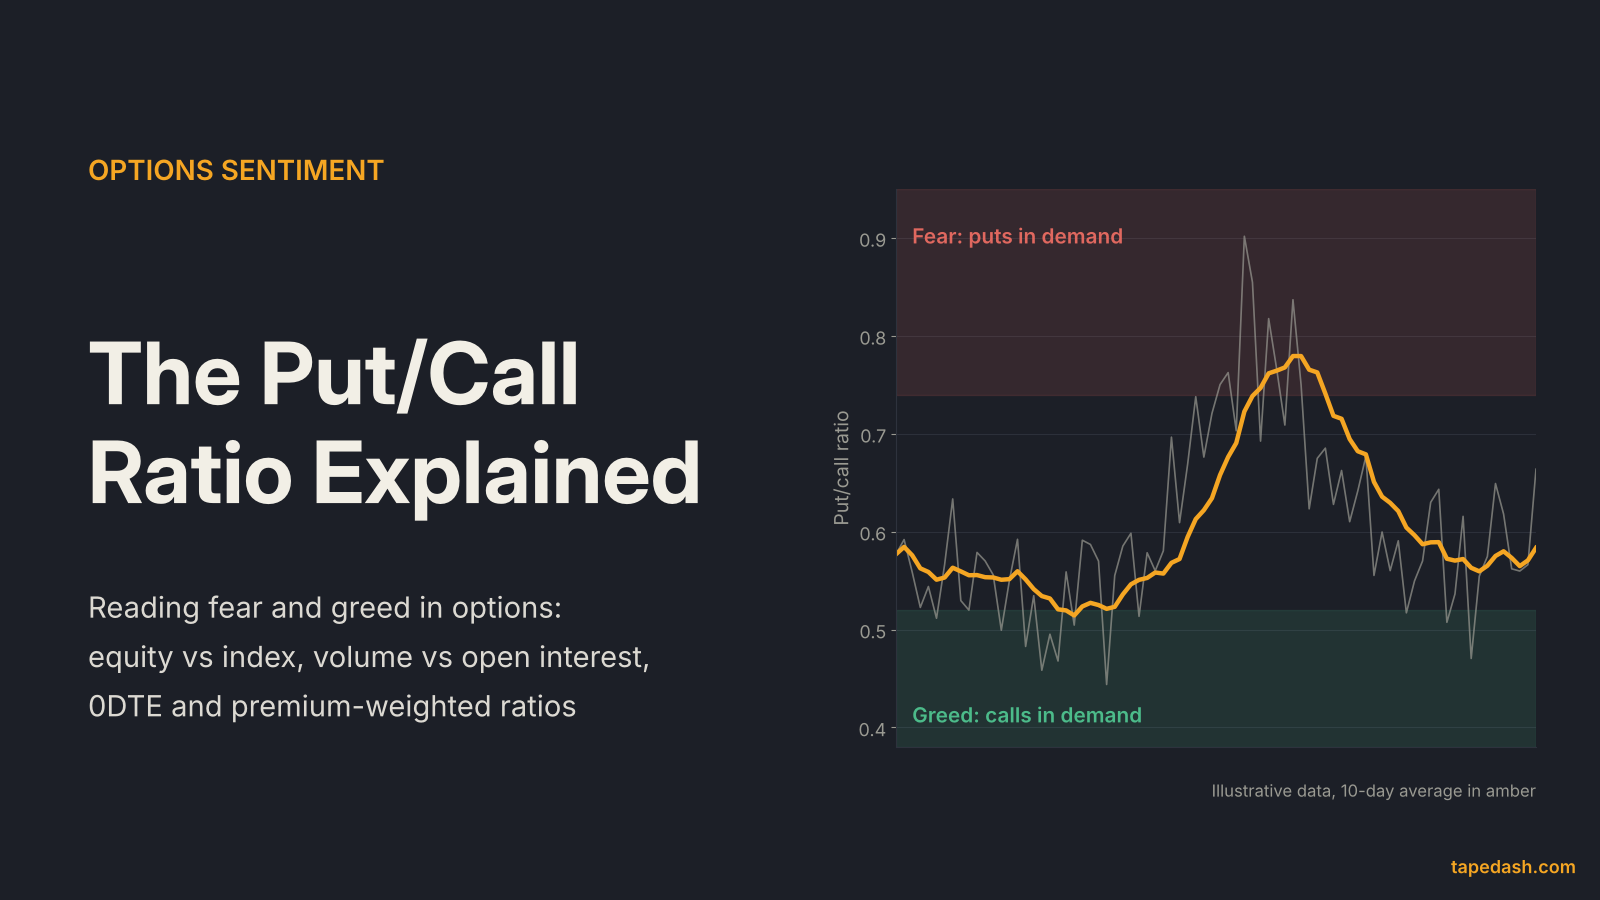
The Put/Call Ratio Explained: Reading Fear and Greed in Options
The put/call ratio measures fear and greed in options. How equity, index, open-interest, 0DTE and premium-weighted ratios differ, and how to use them.
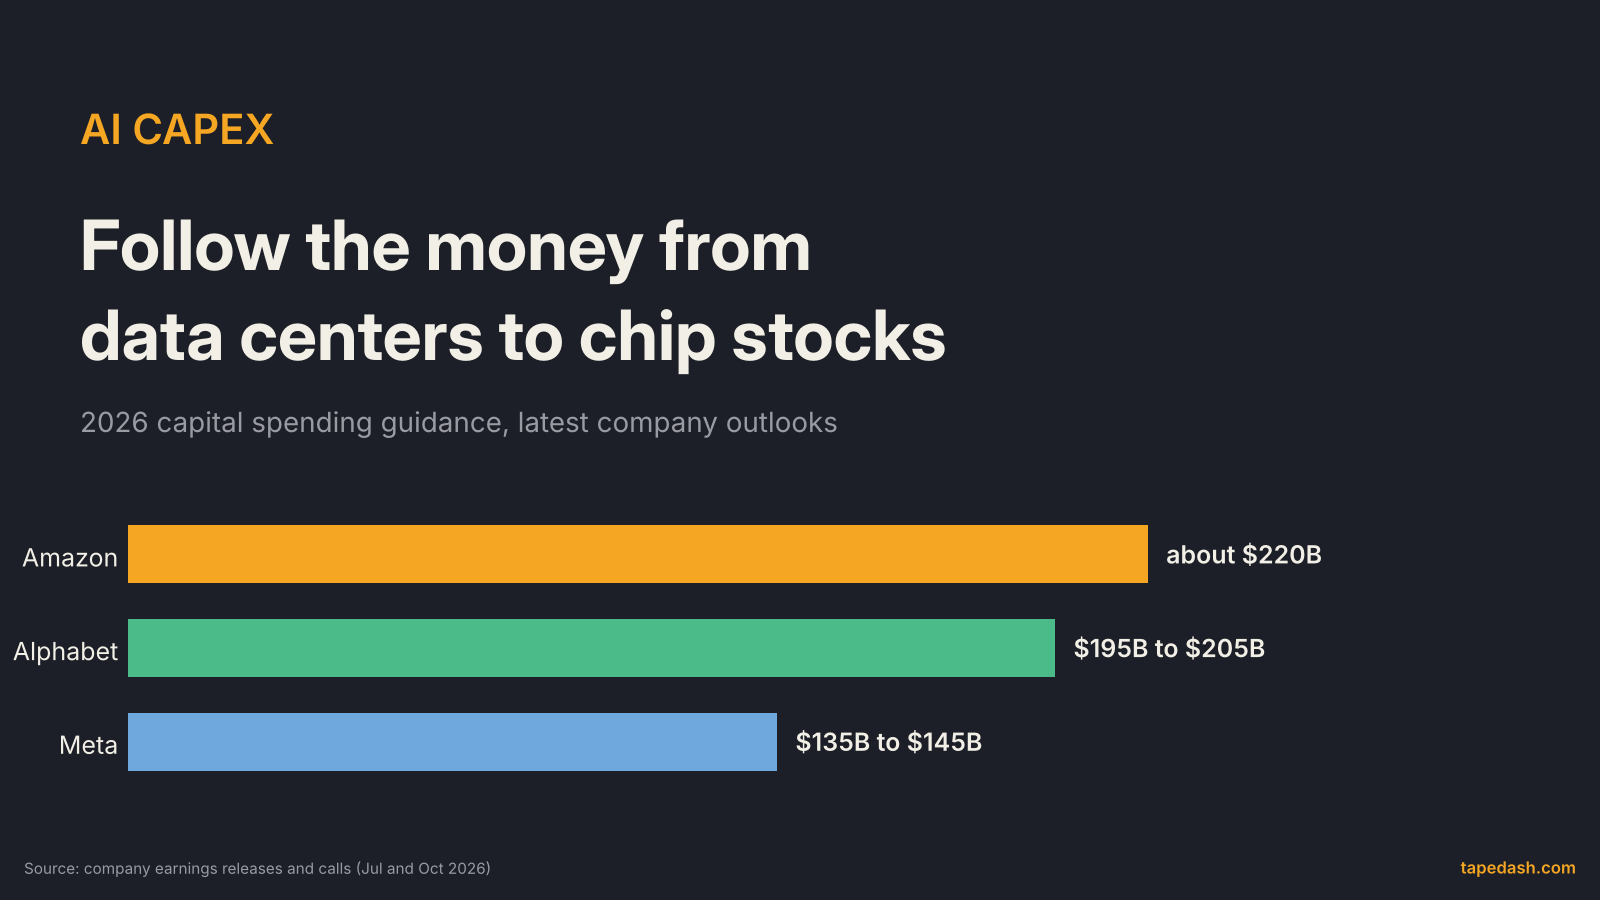
AI Capex Explained: How Data Center Spending Reaches Chip Stocks
AI capex is the data center spending behind chip stocks. Follow hyperscaler guidance into GPUs, HBM, networking, power and foundries, and spot a slowdown.
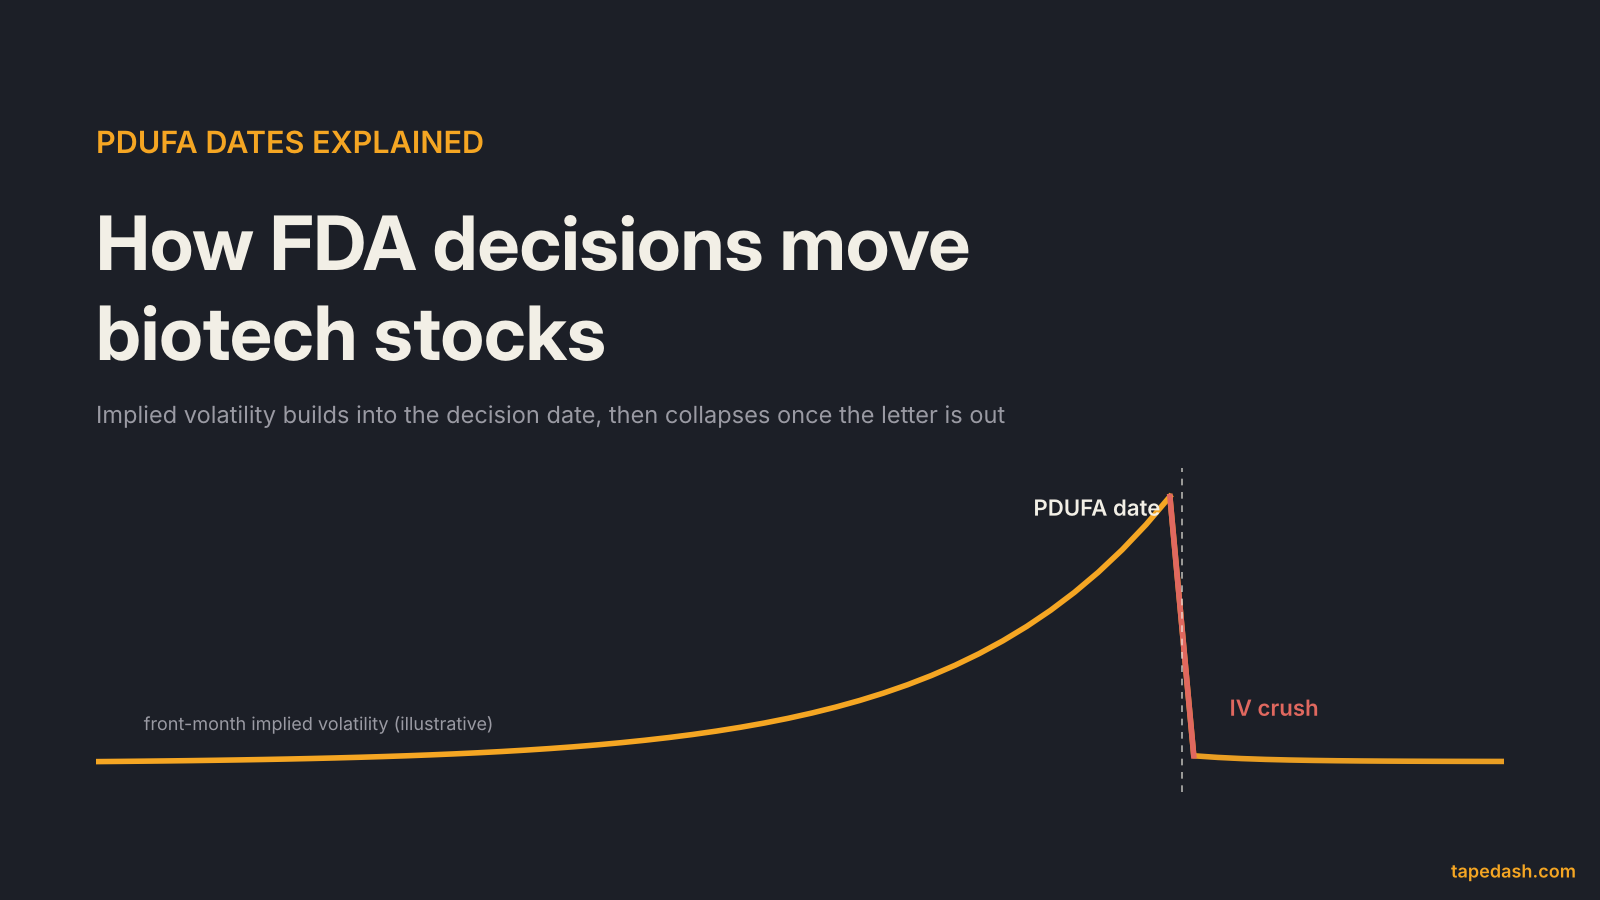
PDUFA Dates Explained: How FDA Decisions Move Biotech Stocks
A PDUFA date is the FDA's goal date to rule on a new drug. How the approval path works, why biotech options price huge moves into it, and how to read it.
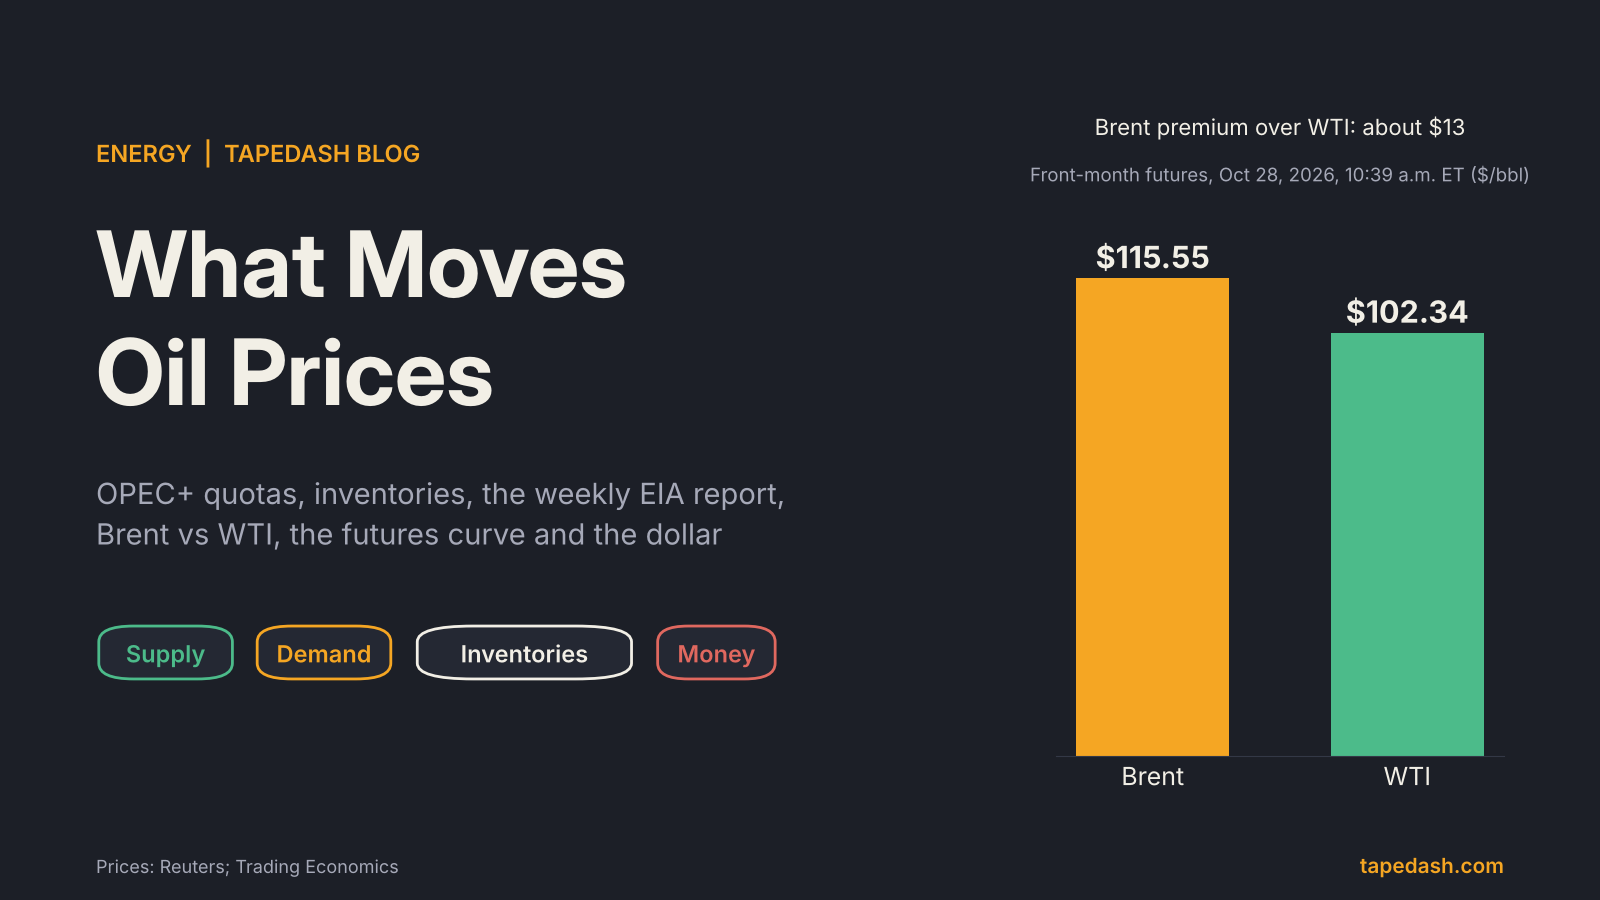
What Moves Oil Prices: OPEC+, Inventories and the EIA Report
What moves oil prices, explained: OPEC+ quotas, spare capacity, demand, the weekly EIA inventory report, Brent vs WTI, the futures curve and the dollar.
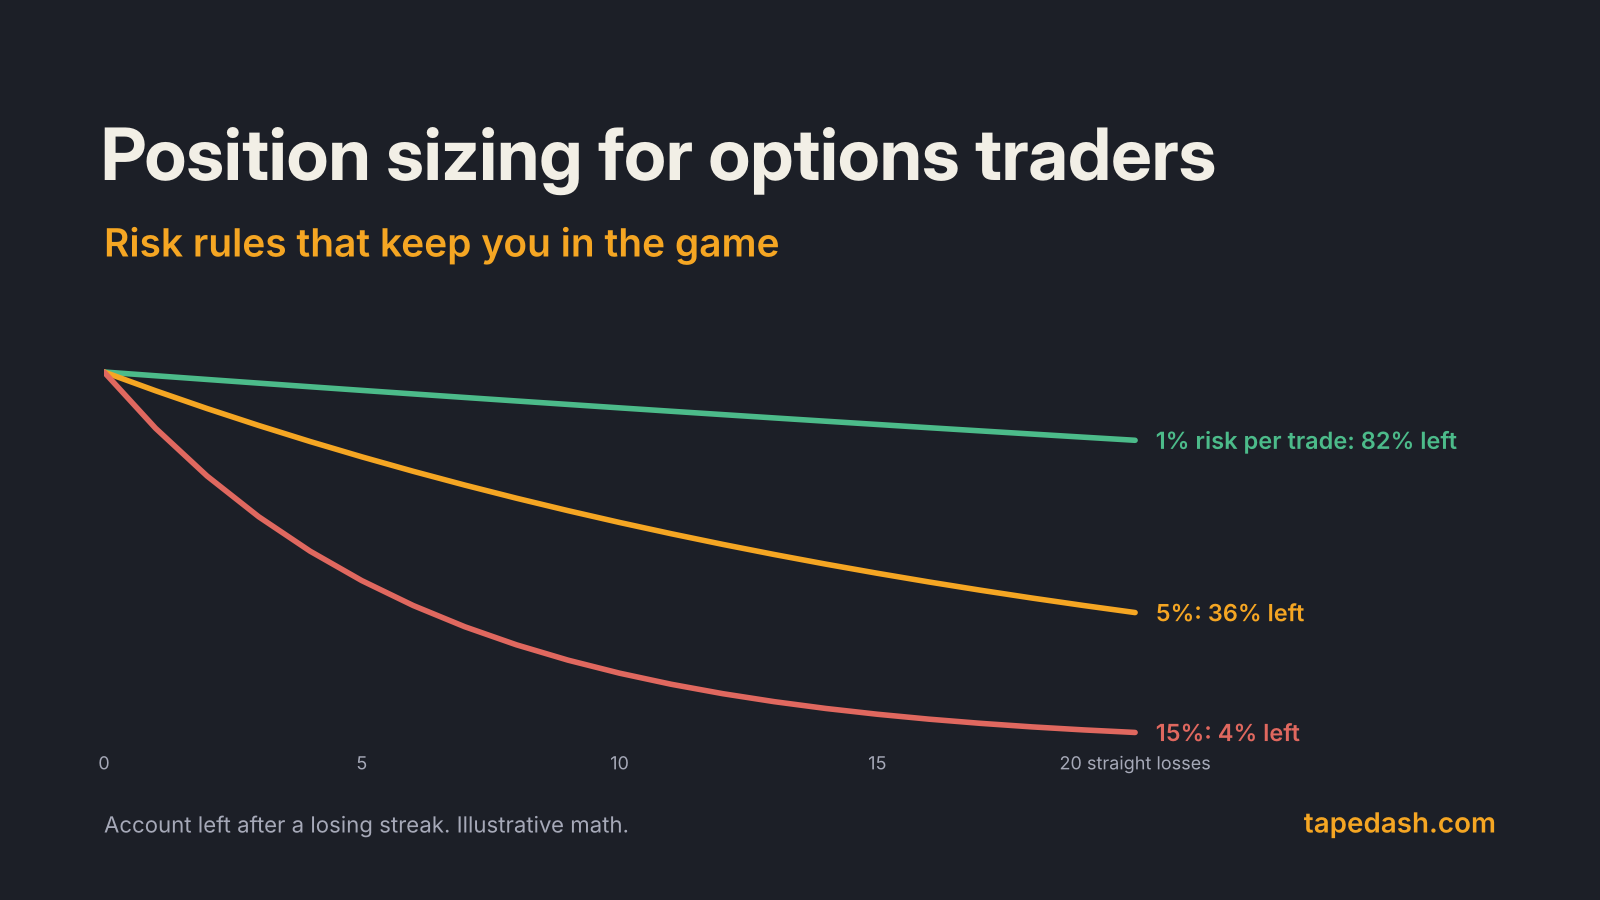
Position Sizing for Options Traders: Risk Rules That Last
Options position sizing explained: how much to risk per trade, how to size spreads and naked options by max loss, why margin is not risk, and Kelly limits.
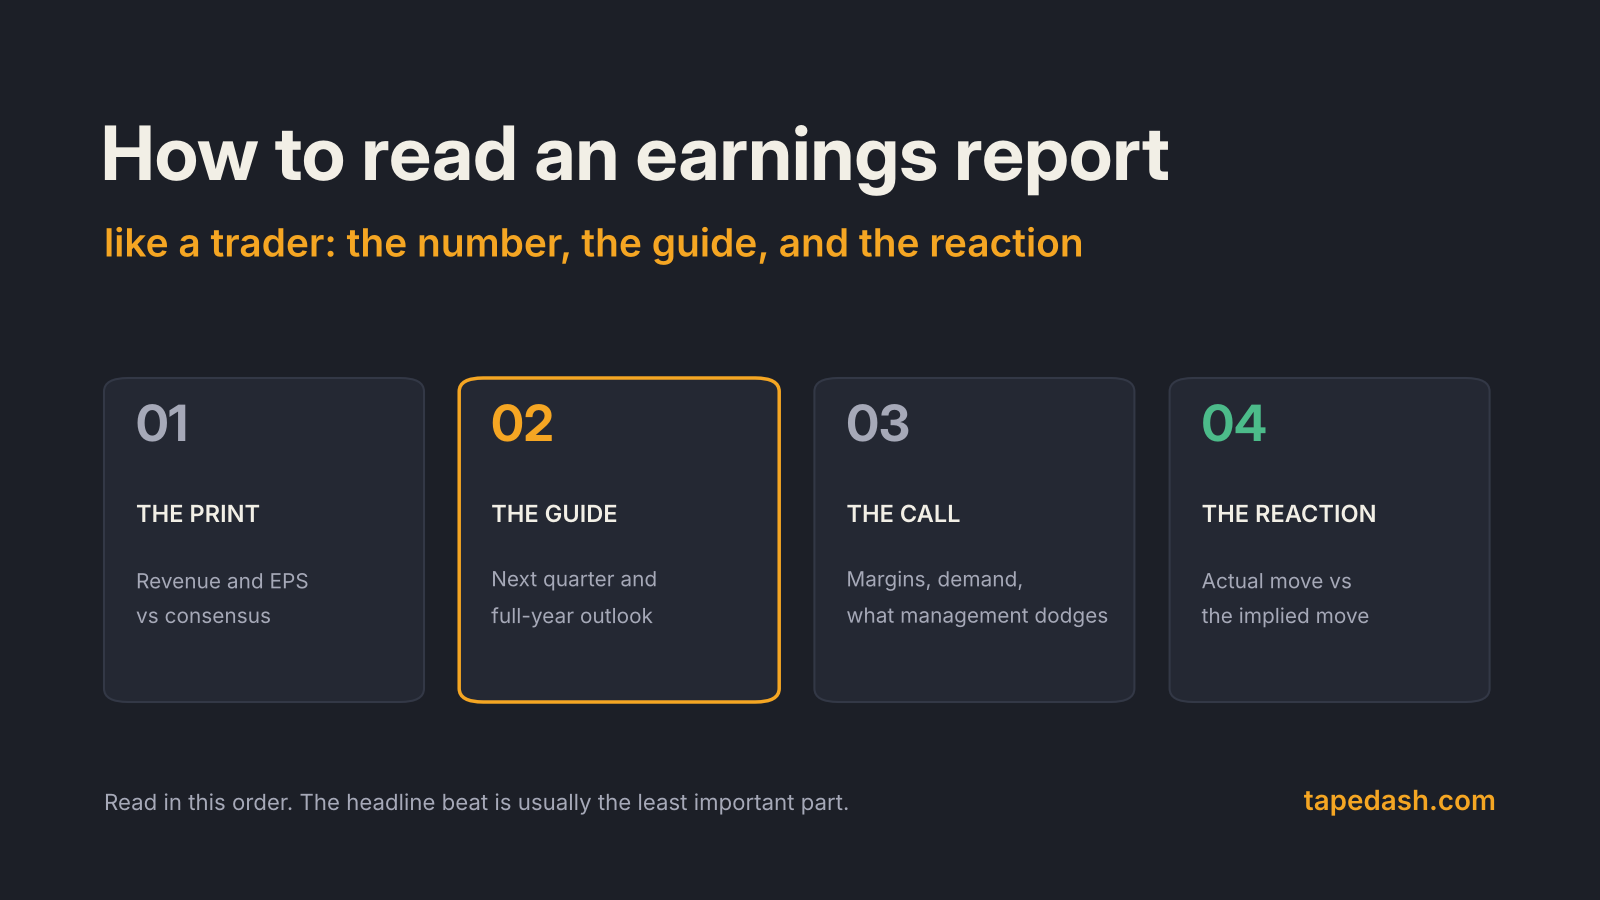
How to Read an Earnings Report Like a Trader
How to read an earnings report like a trader: what to check first, why guidance beats the headline EPS, how to judge non-GAAP numbers and the stock's reaction.
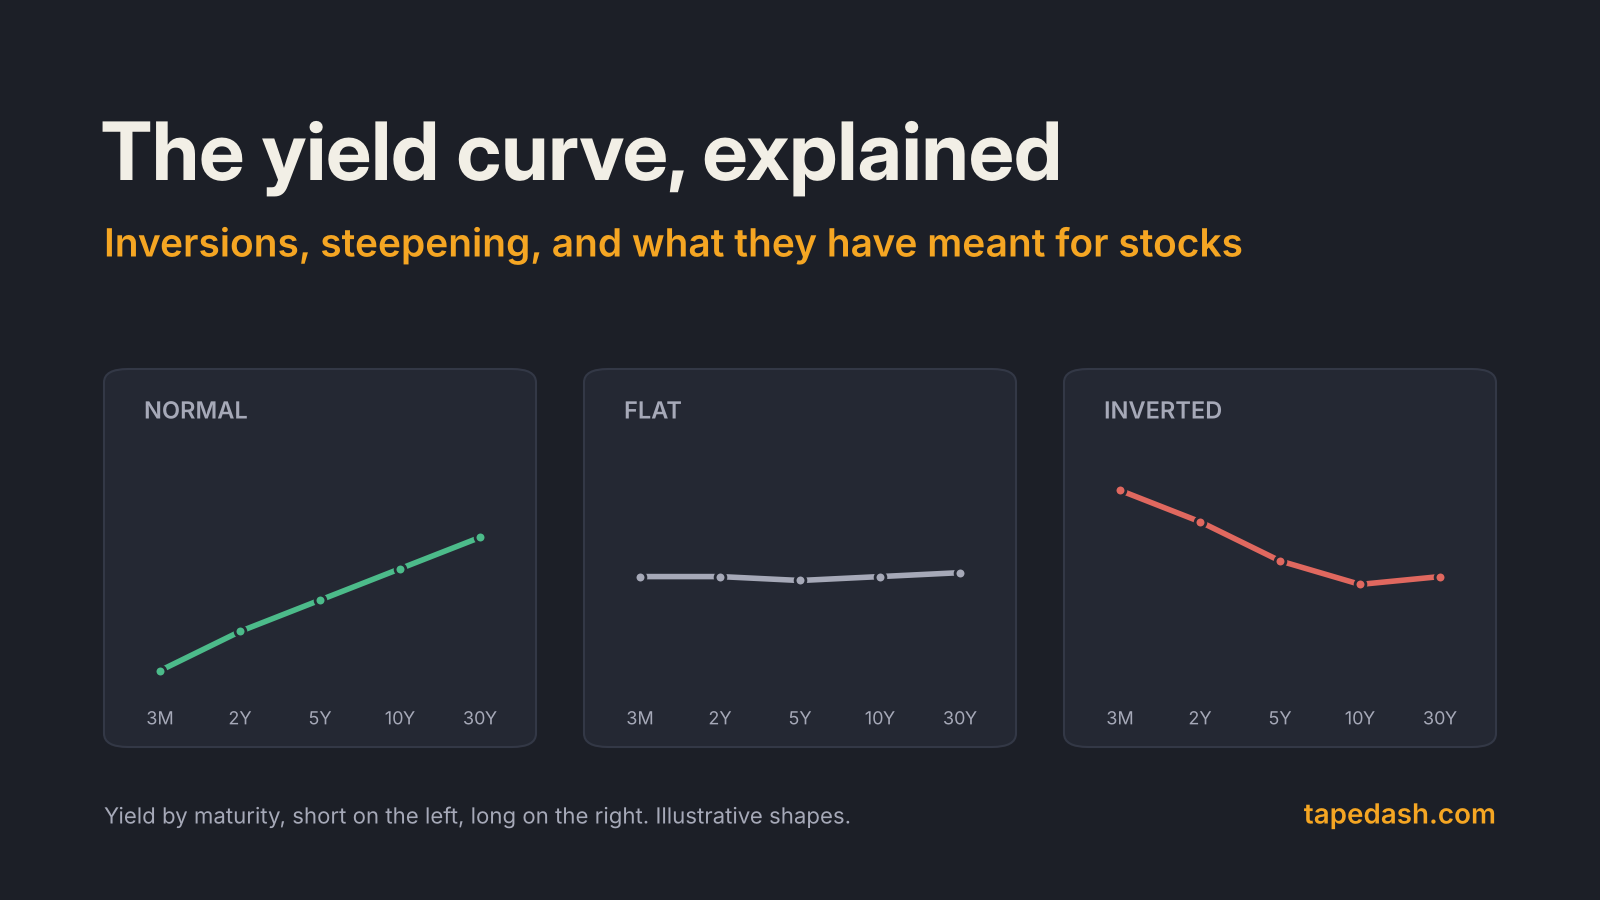
The Yield Curve Explained: Inversions, Steepening and Stocks
What the yield curve is, why an inverted yield curve warned of past recessions, what steepening means now, and how traders read it for stocks.
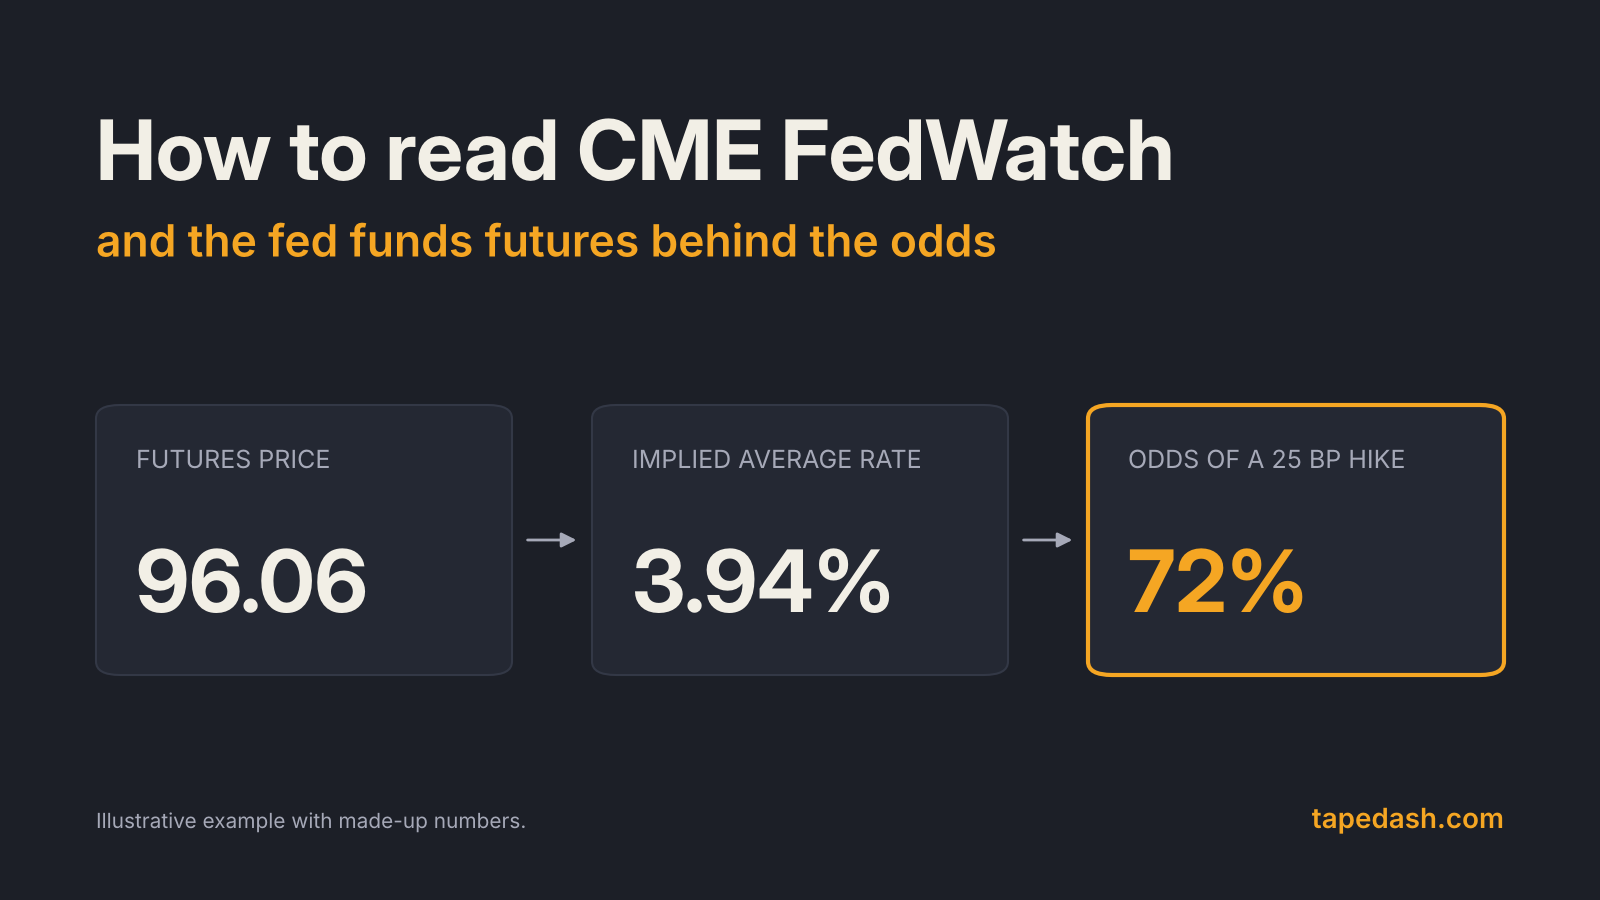
How to Read CME FedWatch and Fed Funds Futures
CME FedWatch turns fed funds futures prices into Fed rate odds. Here is how the math works, how to read the screen, and where the numbers can mislead you.
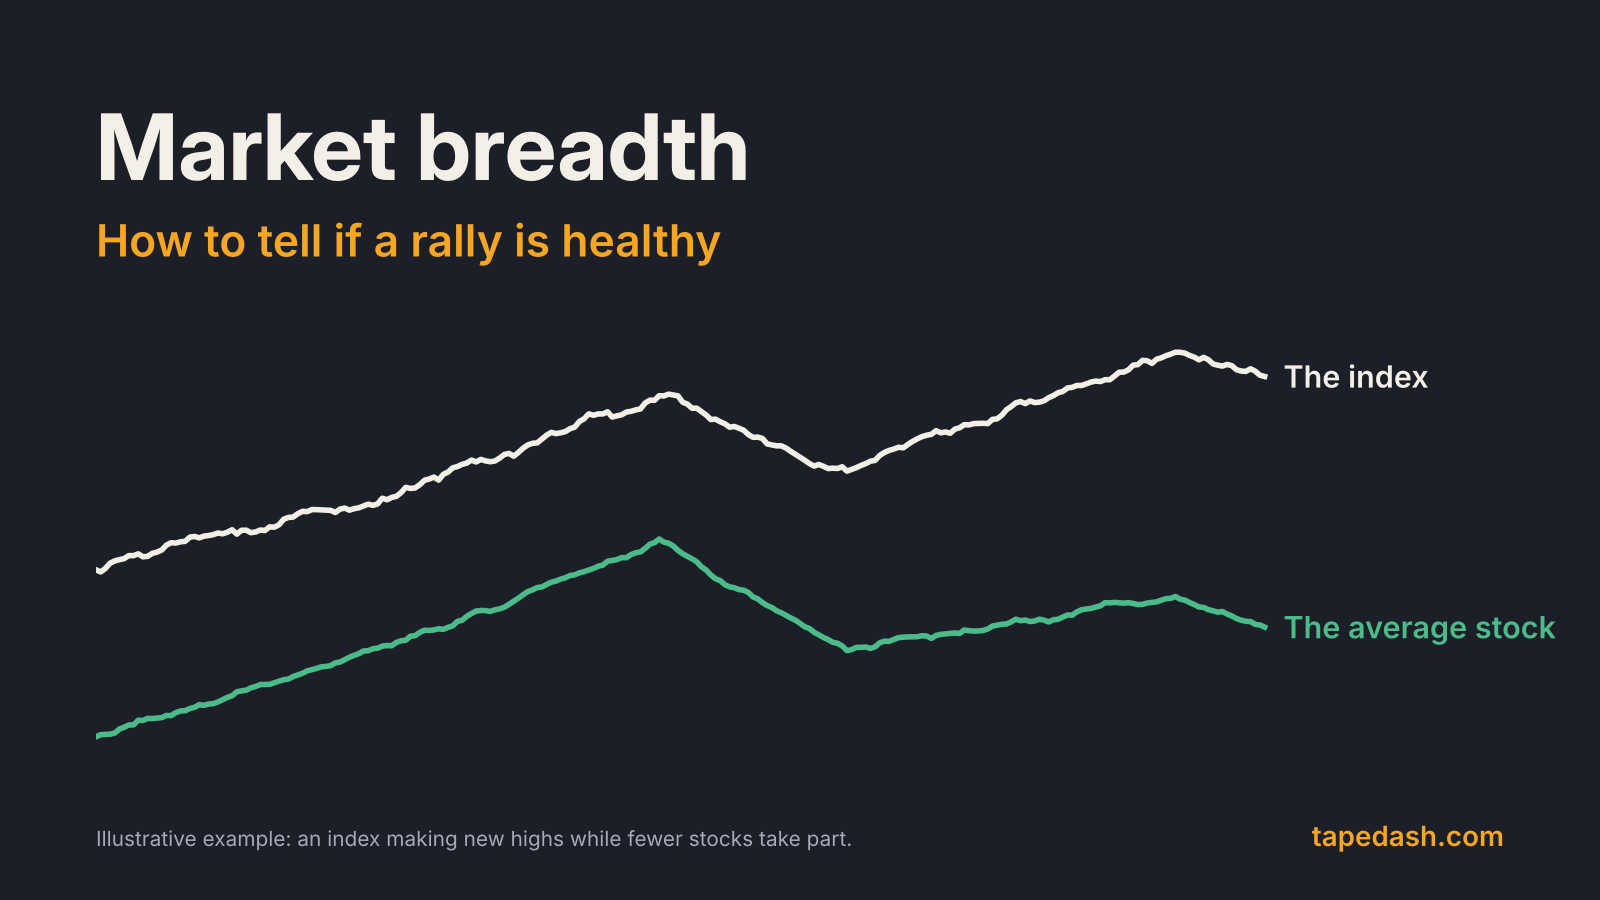
Market Breadth: How to Tell If a Rally Is Healthy
Market breadth shows whether most stocks are joining a rally or a few giants are carrying it. Here is how to read the A/D line, new highs and other key gauges.
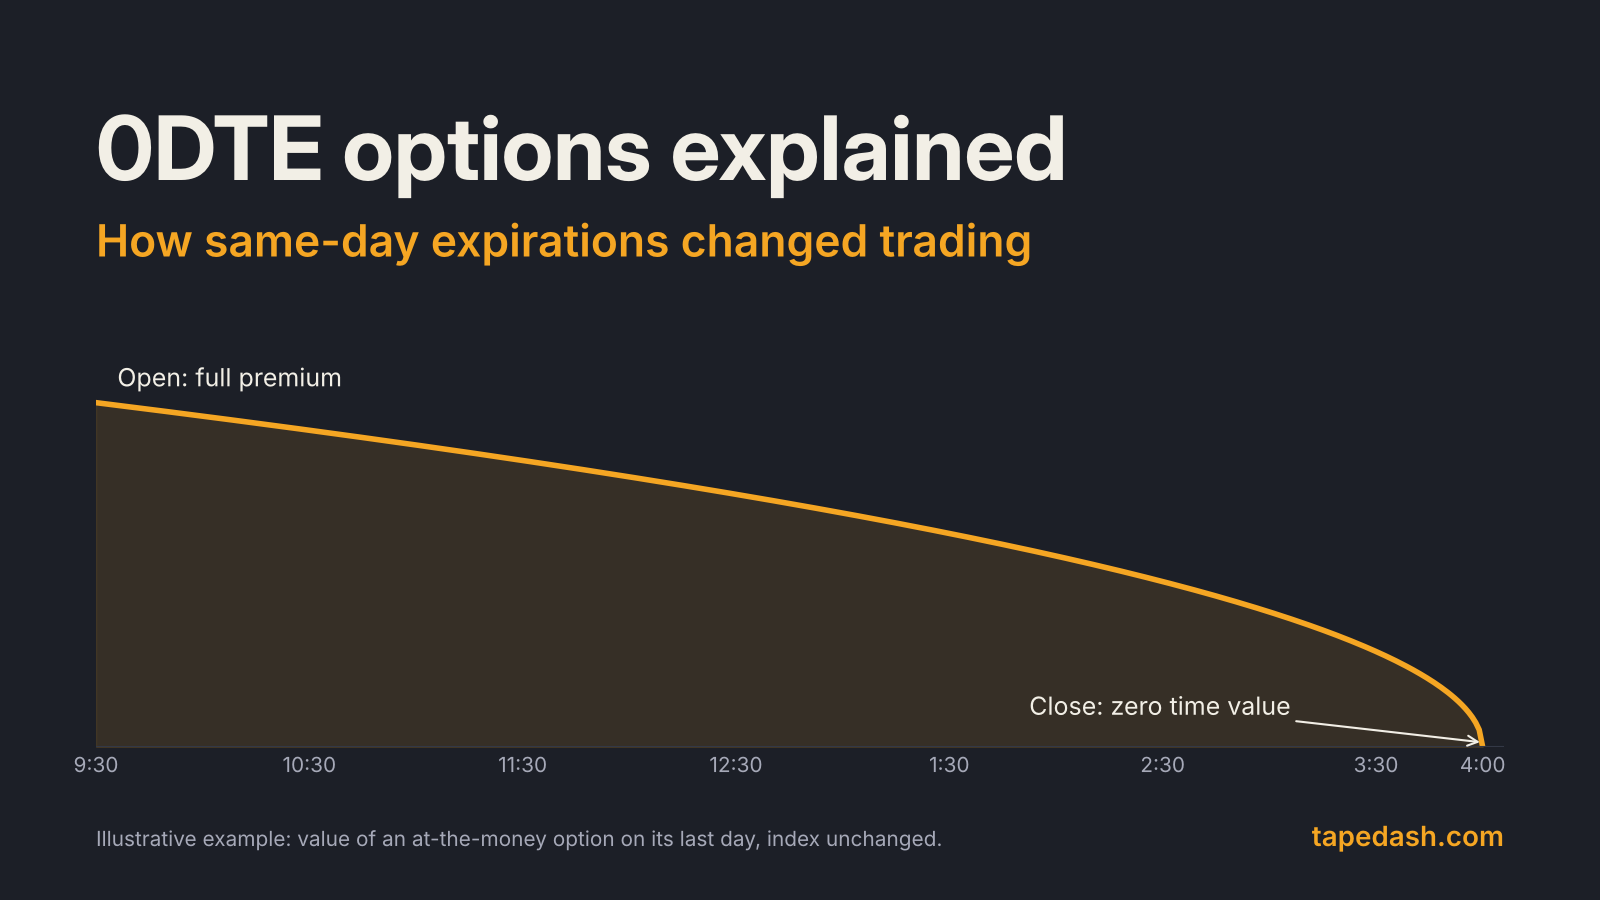
0DTE Options Explained: How Same-Day Expirations Changed Trading
0DTE options now make up most S&P 500 index option volume. Here is how same-day expirations work, why they move so fast, and how traders read them.
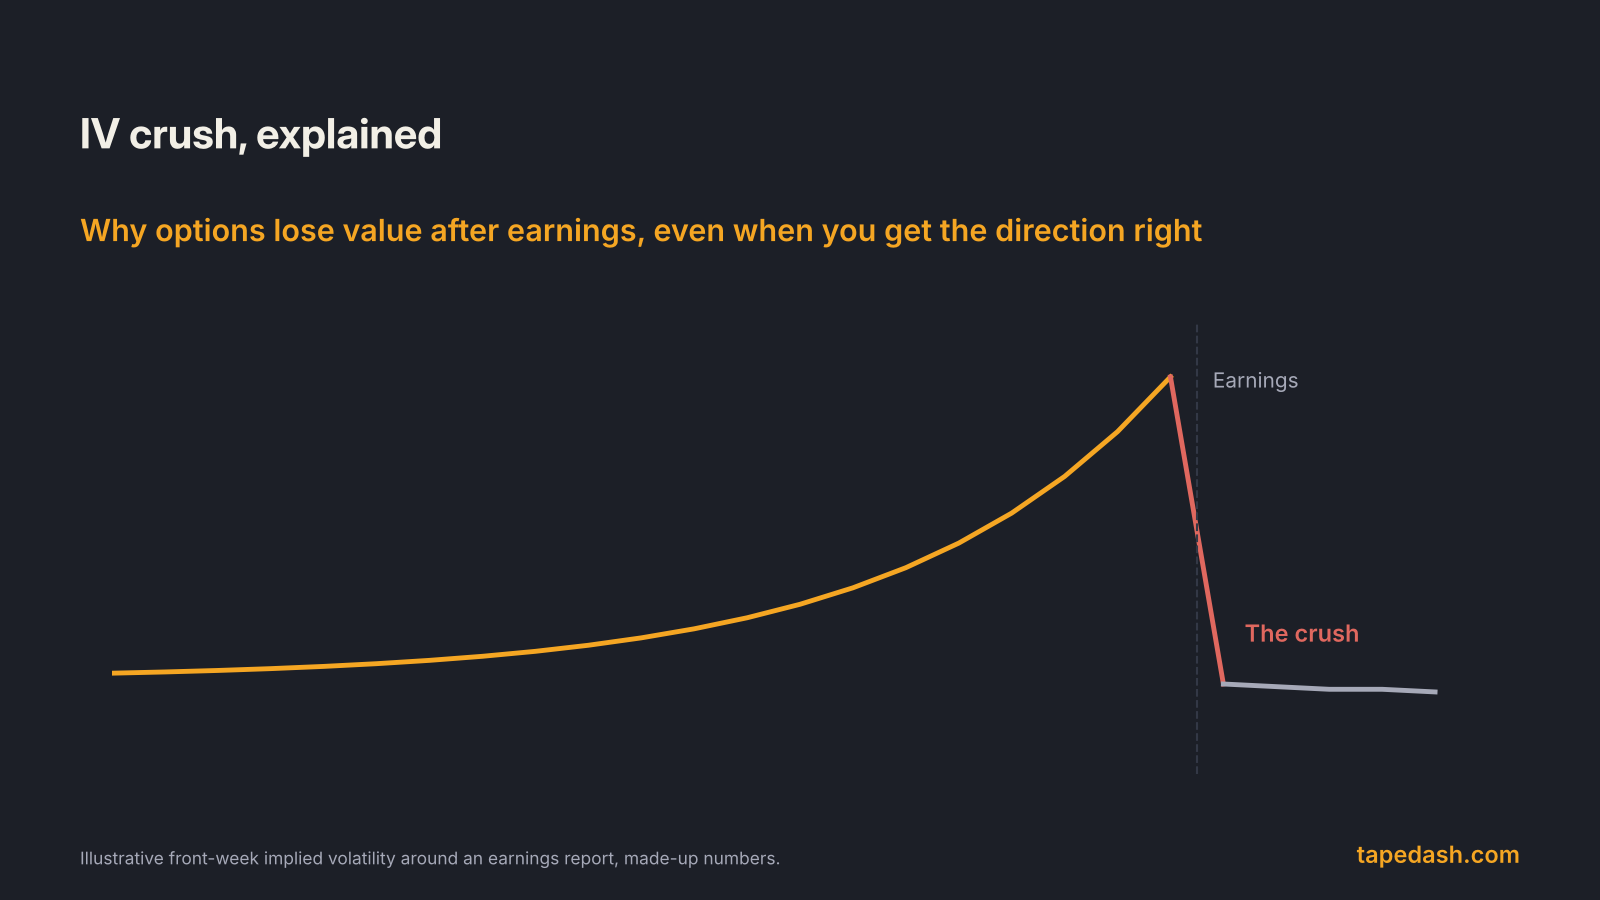
IV Crush: Why Options Lose Value After Earnings
IV crush is the drop in implied volatility after earnings that can sink an option even when you call the direction right. Here is how it works and how to plan for it.
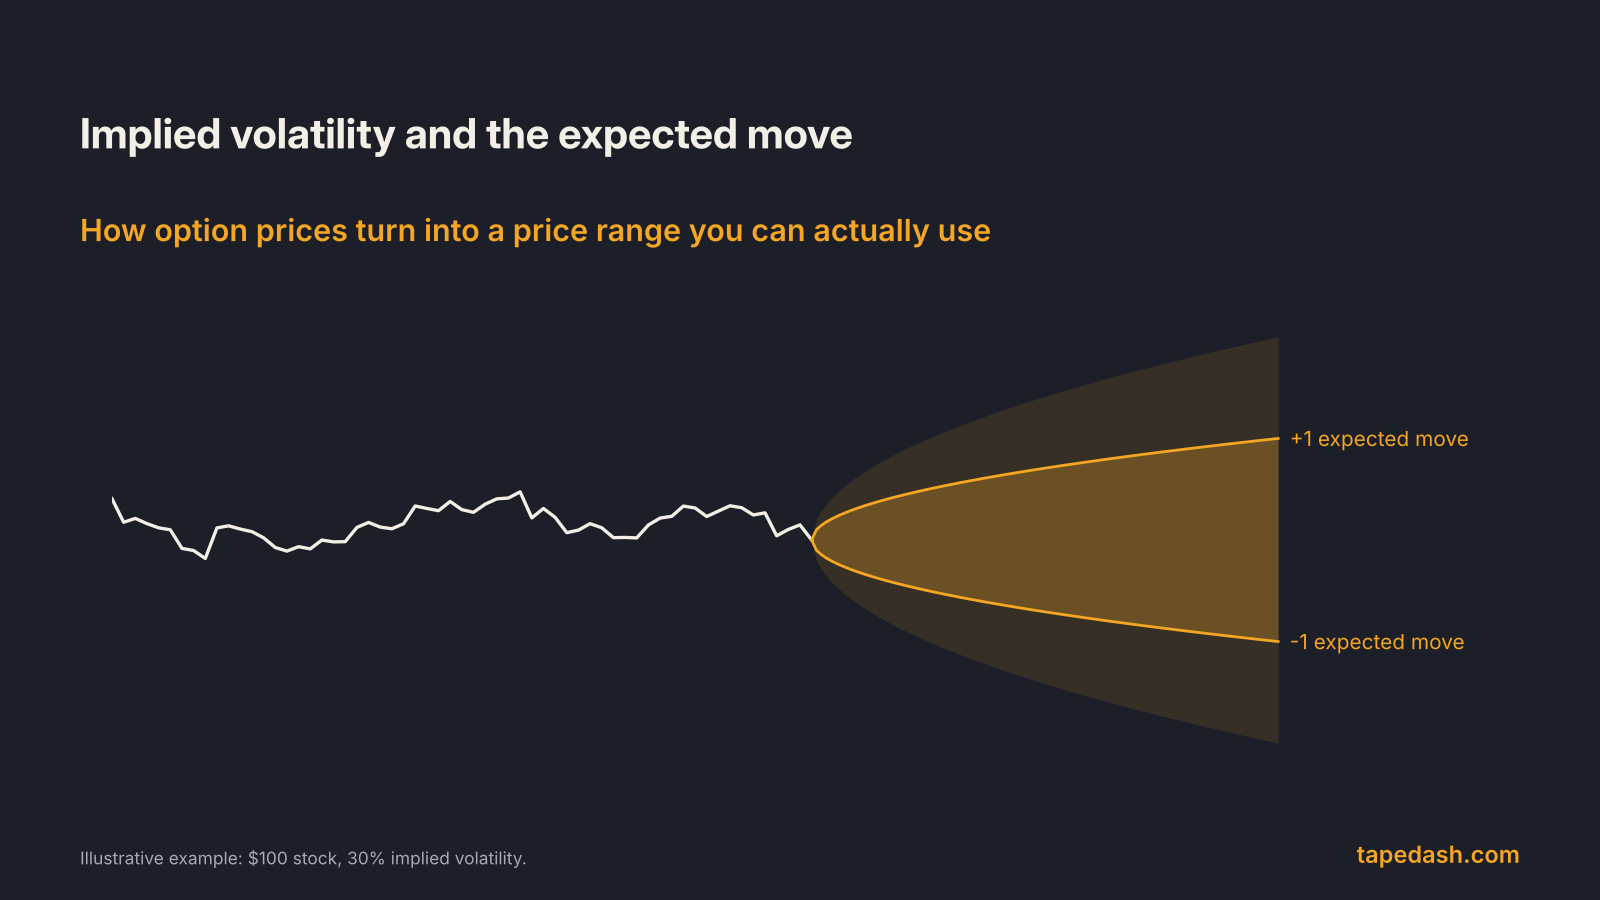
Implied Volatility and the Expected Move, Explained
Implied volatility tells you how far the options market expects a stock to move. Here is how to turn IV into an expected move, and where the math breaks.
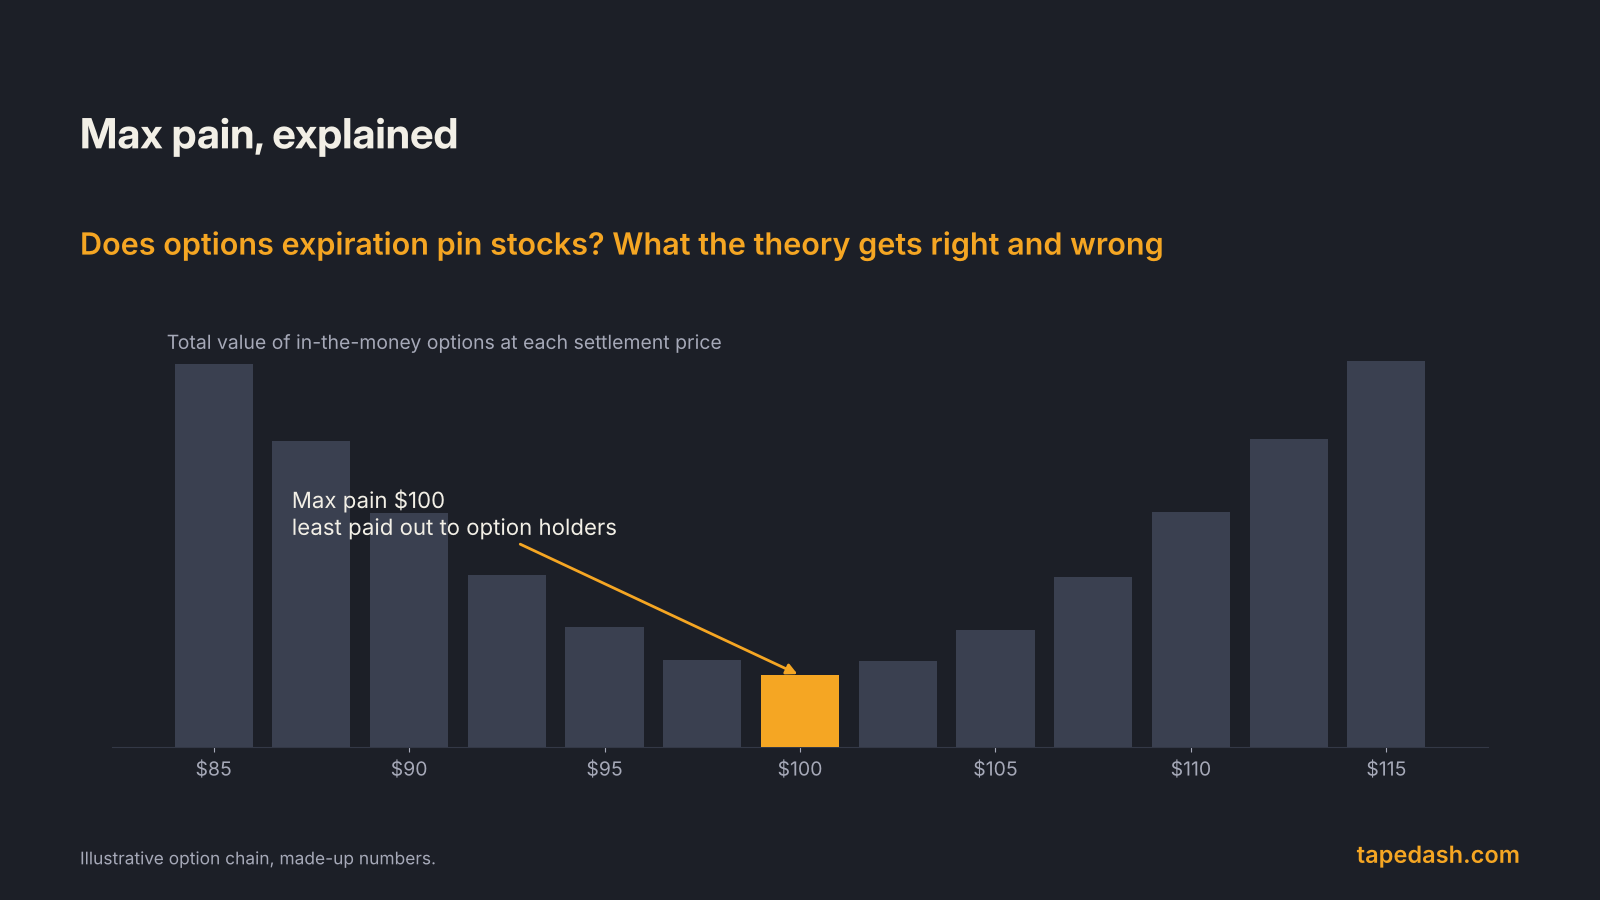
Max Pain Explained: Does Options Expiration Pin Stocks?
Max pain is the strike where the most options expire worthless. Here is how it is calculated, what the research on pinning shows, and how to use it.
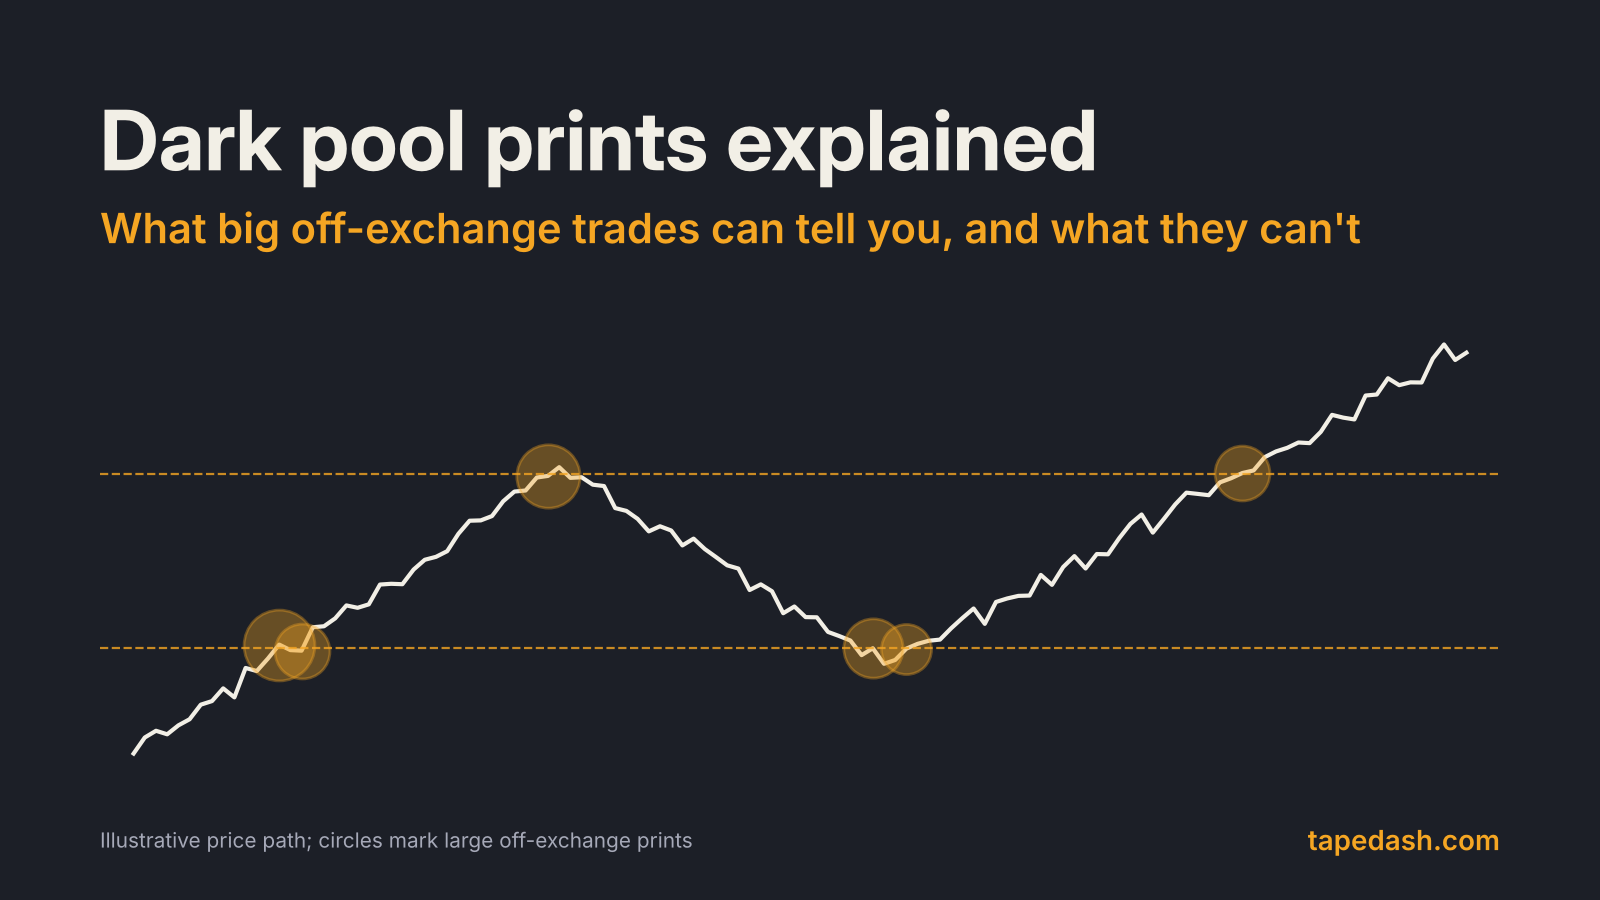
Dark Pool Prints Explained: What Big Off-Exchange Trades Mean
Dark pool prints explained: how off-exchange trades get reported, what a big print can and can't tell you, which prints to ignore, and how traders use them as levels.
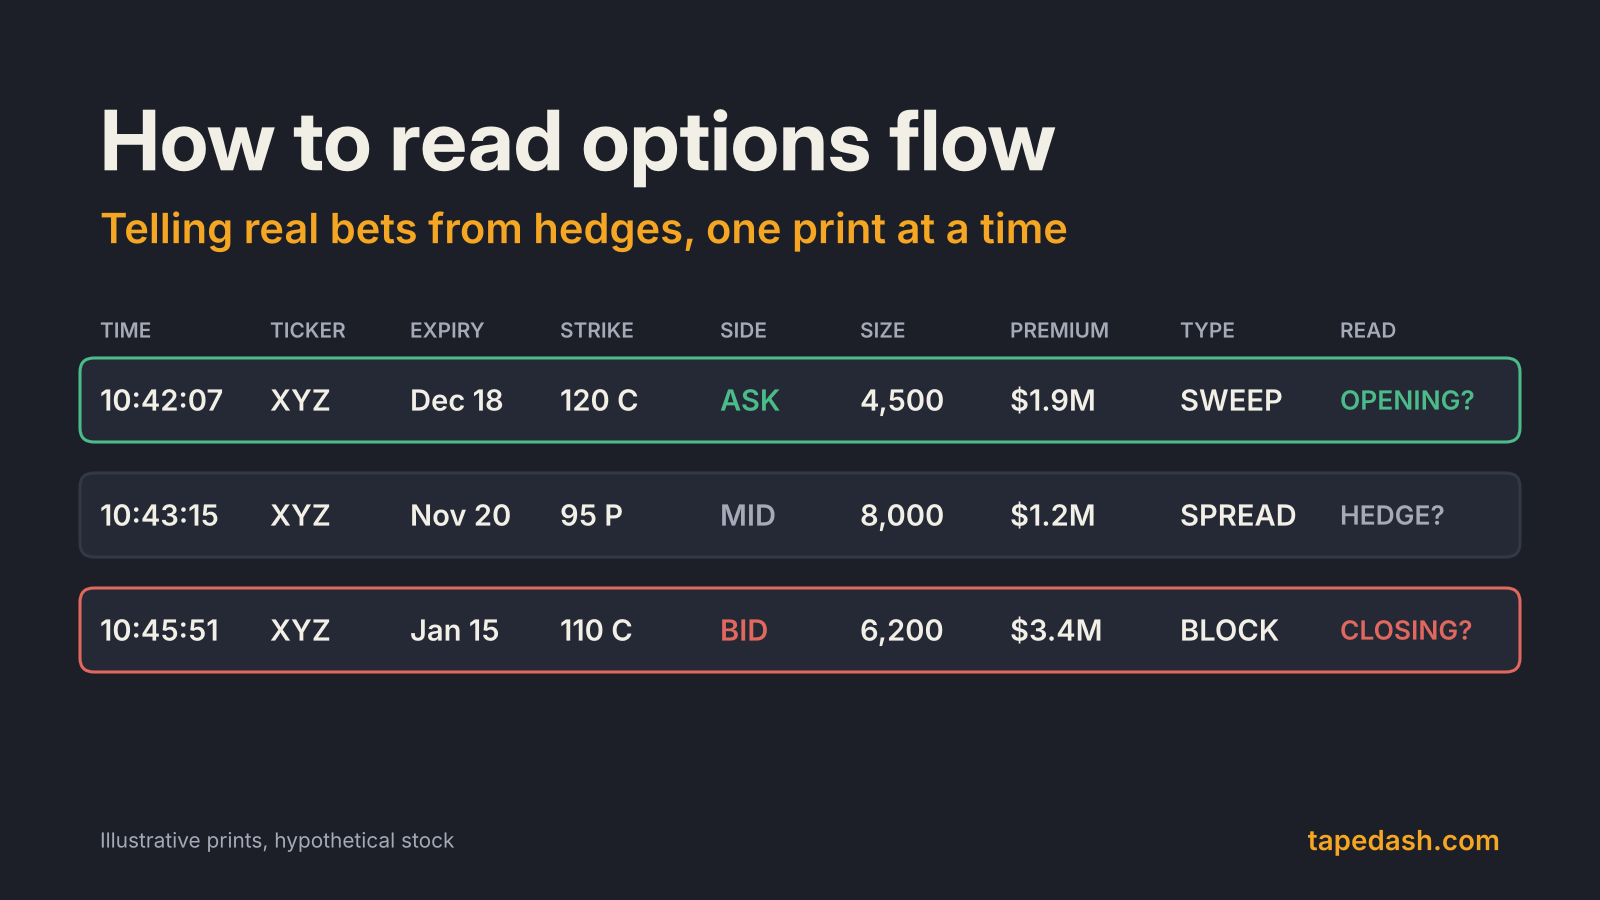
How to Read Options Flow: Real Bets vs Hedges
How to read options flow without getting fooled: sweeps, blocks, bid vs ask, volume vs open interest, and a simple checklist for telling real bets from hedges.
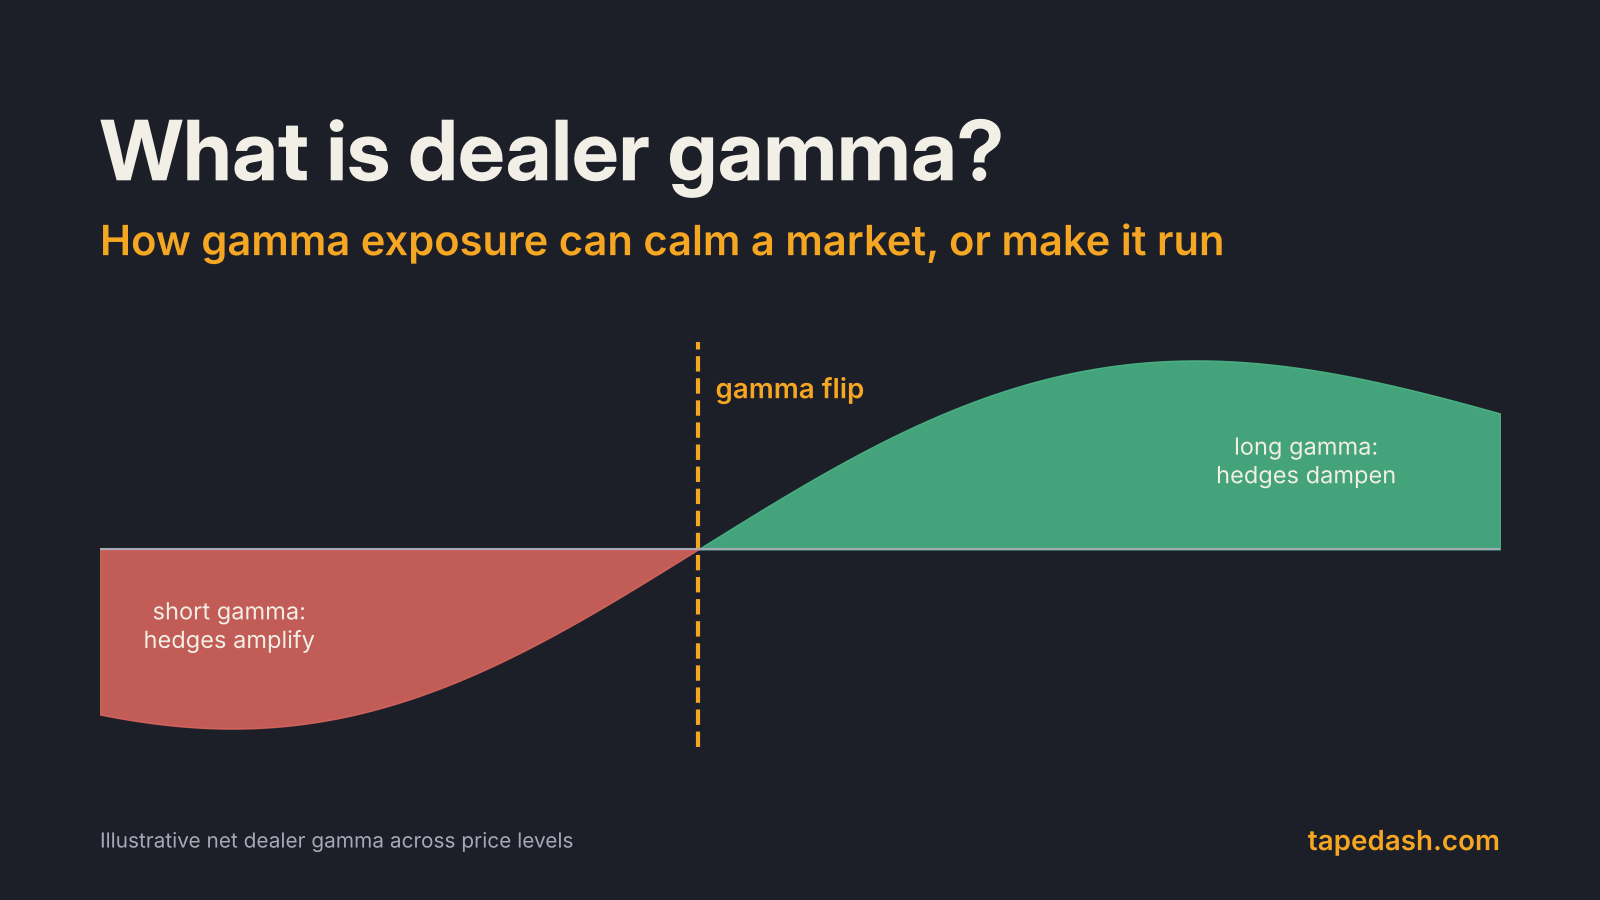
What Is Dealer Gamma? How Gamma Exposure Moves Stocks
Dealer gamma explained in plain English: how market maker hedging can pin a stock or make it run, how gamma exposure (GEX) is estimated, and how to use it.
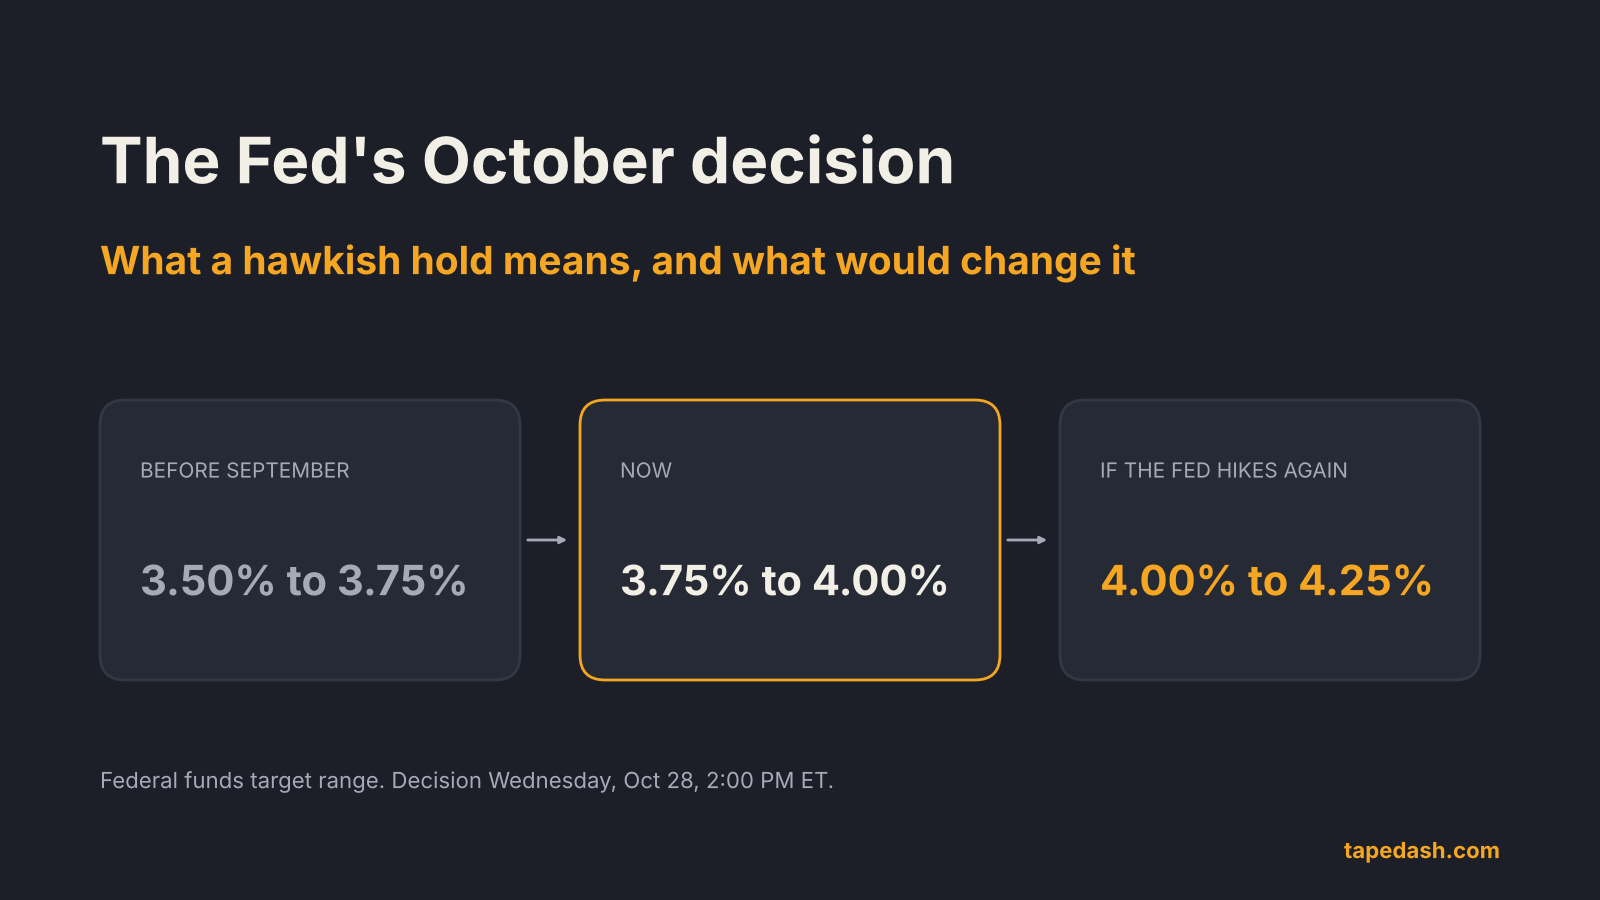
Fed Decision October 2026: What a Hawkish Hold Means for Markets
The Fed is expected to hold at 3.75% to 4.00% on Oct 28 while keeping a December hike in play. Here is what a hawkish hold means and how to read the day.
Get the TapeDash Daily, free
Every weekday evening: the one story that mattered, the day's numbers and what is on deck tomorrow. Join the waitlist and it starts tonight. The first 200 members lock Pro at $69.99 a month on their account, even if they cancel and come back later.
Join the waitlistLook inside the terminal